. 2022 Jul 13:13:869207.
doi: 10.3389/fimmu.2022.869207. eCollection 2022.

Acinar Cell-Derived Extracellular Vesicle MiRNA-183-5p Aggravates Acute Pancreatitis by Promoting M1 Macrophage Polarization Through Downregulation of FoxO1

Affiliations

Acinar Cell-Derived Extracellular Vesicle MiRNA-183-5p Aggravates Acute Pancreatitis by Promoting M1 Macrophage Polarization Through Downregulation of FoxO1

De-Sheng Tang et al. Front Immunol. .

Abstract

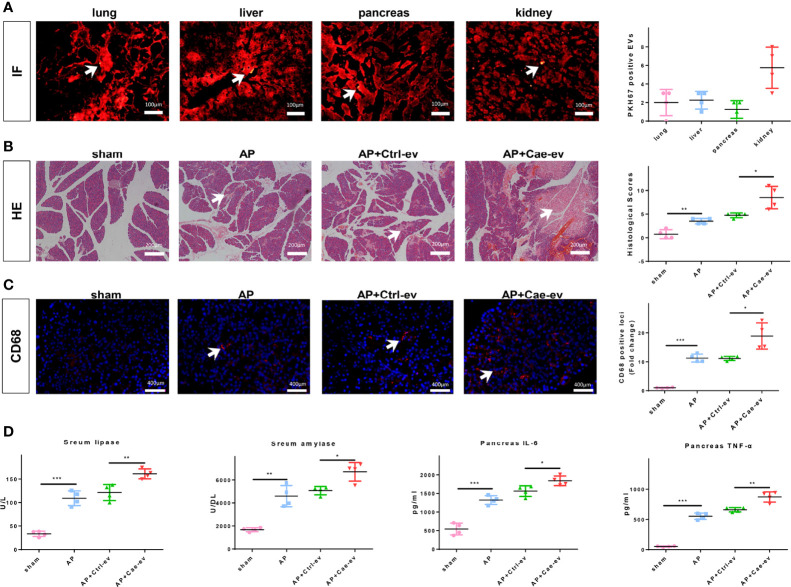
Acute pancreatitis (AP) is a common cause of a clinically acute abdomen. Crosstalk between acinar cells and leukocytes (especially macrophages) plays an important role in the development of AP. However, the mechanism mediating the interaction between acinar cells and macrophages is still unclear. This study was performed to explore the role of acinar cell extracellular vesicles (EVs) in the crosstalk between acinar cells and macrophages involved in the pathogenesis of AP. EVs derived from caerulein-treated acinar cells induced macrophage infiltration and aggravated pancreatitis in an AP rat model. Further research showed that acinar cell-derived EV miR-183-5p led to M1 macrophage polarization by downregulating forkhead box protein O1 (FoxO1), and a dual-luciferase reporter assay confirmed that FoxO1 was directly inhibited by miR-183-5p. In addition, acinar cell-derived EV miR-183-5p reduced macrophage phagocytosis. Acinar cell-derived EV miR-183-5p promoted the pancreatic infiltration of M1 macrophages and increased local and systemic damage in vivo. Subsequently, miR-183-5p overexpression in macrophages induced acinar cell damage and trypsin activation, thus further exacerbating the disease. In clinical samples, elevated miR-183-5p levels were detected in serum EVs and positively correlated with the severity of AP. EV miR-183-5p might play an important role in the development of AP by facilitating M1 macrophage polarization, providing a new insight into the diagnosis and targeted management of pancreatitis. Graphical abstract of the present study. In our caerulein-induced AP model, miR-183-5p was upregulated in injured acinar cells and transported by EVs to macrophages. miR-183-5p could induce M1 macrophage polarization through downregulation of FoxO1 and the release of inflammatory cytokines, which could aggravate AP-related injuries. Therefore, a vicious cycle might exist between injured ACs and M1 macrophage polarization, which is fulfilled by EV-transported miR-183-5p, leading to sustainable and progressive AP-related injuries.

Keywords: acute pancreatitis; exosome; extracellular vesicles; inflammation; macrophage polarization.


Conflict of interest statement

The authors declare that the research was conducted in the absence of any commercial or financial relationships that could be construed as a potential conflict of interest.

Figures

Figure 1
Figure 1
EVs from caerulein-treated ACs aggravate AP. (A) Photographs of IF-stained sections of AP rat lung, liver, pancreas, and kidney samples harvested 6 h after EV injection. The number of PKH67-labeled EVs in the same field of view from the four groups was determined. EVs are labeled with white arrows. Scale bar, 100 μm. (B) Representative photographs and histological scores of HE-stained pancreatic sections harvested from the rats in the 4 groups at 6 h after EV injection: sham, AP, AP+Ctrl-ev and AP+Cae-ev groups. Pancreatic injury is indicated by the white arrows. Scale bar, 200 μm. (C) Microscopy images of the distribution of CD68 immunostaining in pancreatic sections from the aforementioned groups of AP rats. Scale bars, 200 μm. The fold change in the number of CD68 positive macrophages in the four groups was determined. Scale bar, 400 μm. (D) Amylase and lipase levels in the blood and inflammatory cytokine levels in the pancreas were determined by ELISA. Data are presented as the mean ± SD. All experiments were repeated three times. *p < 0.05, **p < 0.01, ***p < 0.001. AP: AP rats, AP+Ctrl-ev: AP rats treated with EVs from PBS-treated acinar cells, AP+Cae-ev: AP rats treated with EVs from caerulein-treated acinar cells.
Figure 2
Figure 2
EVs from caerulein-treated ACs promote M1 macrophage polarization. (A) Representative electron micrograph of EVs purified from AC supernatant from the Ctrl-ev and Cae-ev groups. EVs are indicated by the white arrows. Scale bar, 100 nm. (B) NTA-based determination of the diameter of EVs in the Ctrl-ev and Cae-ev groups. (C) Protein expression and analysis of EV markers (including Alix, TSG101 and CD63) in EVs from ACs treated with or without caerulein by western blotting. (D) Macrophages were treated for 12 h with PKH67-labeled EVs from the Ctrl-ev and Cae-ev groups. The relative fluorescence intensity was calculated. Scale bar, 10 μm. (E) CD86 (M1 macrophage marker) and CD163 (M2 macrophage marker) expression levels in macrophages treated with Ctrl-ev and Cae-ev were detected by flow cytometry. (F) Protein expression and analysis of iNOS in macrophages treated with EVs from PBS-treated ACs and caerulein-treated ACs using western blotting. (G) Inflammatory cytokine mRNA expression (IL-1β, IL-6 and TNF-α) in macrophages was detected by qRT-PCR. Data are presented as the mean ± SD. All experiments were repeated three times. *p < 0.05, **p < 0.01, ***p < 0.001. NTA: nanoparticle tracking analysis, Ctrl-ev: EVs derived from PBS-treated acinar cells, Cae-ev: EVs derived from caerulein-treated acinar cells.
Figure 3
Figure 3
MiR-183-5p is highly expressed in caerulein-induced ACs. (A) Heat map of differentially expressed EV miRNAs. The expression cluster shows the expression level of EV miRNAs on the left of the figure. Red indicates high expression, and blue represents low expression. C1, C2 and C3 represent EVs secreted by saline-treated ACs; S1, S2, and S3 represent EVs secreted by caerulein-treated ACs. (B) The volcano plot of miRNAs from AC-derived EVs. Green dots represent downregulated miRNAs, and red dots represent upregulated miRNAs. (C) GO functional enrichment analysis of target genes of upregulated miRNAs. The vertical axis shows the GO term, and the horizontal axis shows the P-value and gene number. (D) KEGG pathway analysis revealed the top 30 enriched pathways involving the target genes of upregulated miRNAs. (E) The expression of the top eight upregulated miRNAs in EVs measured by sequencing. The expression of miR-183-5p in Ctrl-ev and Cae-ev was detected using qRT-PCR (F) After the overexpression of miRNAs in BMDMs, iNOS and Arg-1 mRNA expression in BMDMs were detected by qRT-PCR. Data are presented as the mean ± SD. All experiments were repeated three times. *p < 0.05, **p < 0.01, ***p < 0.001. KEGG Kyoto Encyclopedia of Genes and Genomes, GO Gene Ontology. Ctrl-ev: EVs derived from PBS-treated acinar cells, Cae-ev: EVs derived from caerulein-treated acinar cells.
Figure 4
Figure 4
AC-derived EV miR-183-5p promotes M1 macrophage polarization. (A) Expression of miR-183-5p in ACs and NR8383 macrophages from the Ctrl, Cae, or Cae+GW4869 group in a co-culture system. (B) Expression of miR-183-5p in NR8383 macrophages treated with Ctrl-ev or Cae-ev. (C) Levels of inflammatory cytokines (IL-1β, IL-6 and TNF-α) in NR8383 macrophages transfected with NC-mimic, miR-183-5p mimic, NC-inhibitor and miR-183-5p inhibitor. (D) Protein expression and analysis of iNOS in the aforementioned groups of NR8383 macrophages by western blotting. (E) The expression of CD86 and CD163 in the aforementioned groups of NR8383 cells was detected by flow cytometry. (F) Levels of inflammatory cytokines (IL-1β, IL-6 and TNF-α) in BMDMs transfected with NC-mimic, miR-183-5p mimic, NC-inhibitor and miR-183-5p inhibitor. (G) Protein expression and analysis of iNOS in the aforementioned groups of BMDMs by western blotting. (H) The expression of CD86 and CD163 in BMDMs transfected with NC-mimic and miR-183-5p mimic was detected using flow cytometry. (I) The phagocytic activity of macrophages in the Cae-ev, Ctrl-ev, miR-183-5p mimic and miR-183-5p inhibitor groups was quantified by flow cytometry. Data are presented as the mean ± SD. All experiments were repeated three times. *p < 0.05, **p < 0.01, ***p < 0.001. Ctrl: PBS-treated acinar cells, Cae: caerulein-treated acinar cells, Cae+GW4869: EVs from acinar cells co-treated with caerulein and GW4869, Ctrl-ev: EVs derived from PBS-treated acinar cells, Cae-ev: EVs derived from caerulein-treated acinar cells, NC-mimic: macrophages transfected with NC-mimic, miR-183-5p mimic: macrophages transfected with miR-183-5p mimic, NC-inhibitor: macrophages transfected with NC-inhibitor, miR-183-5p inhibitor: macrophages transfected with miR-183-5p inhibitor, and BMDMs: bone marrow-derived macrophages.
Figure 5
Figure 5
AC-derived EV miR-183-5p induces macrophage M1 polarization by targeting FoxO1. (A) Venn diagram showing the number of potential common target genes identified by three bioinformatics analysis tools. (B) The presence of a complementary miR-183-5p sequence in the 3′-UTR of FoxO1 mRNA was predicted by TargetScan. (C-D) Western blotting: (C) levels and analysis of the FoxO1 and P-FoxO1 proteins in NR8383 macrophages and BMDMs treated with Ctrl-ev and Cae-ev; (D) levels and analysis of the FoxO1 and P-FoxO1 proteins in NR8383 macrophages and BMDMs transfected with NC-mimic, miR-183-5p mimic, NC-inhibitor and miR-183-5p inhibitor. (E) Levels and analysis of the FoxO1 and iNOS proteins in BMDMs transfected with the NC inhibitor, miR-183-5p inhibitor, si-NC+miR-183-5p inhibitor and siFoxO1+miR-183-5p inhibitor. (F) A luciferase reporter assay was performed with 3′UTR-NC (negative control), 3′UTR-FoxO1 and 3′UTR-FoxO1-mutant. The miR-183-5p overexpression plasmid and the above constructs were transfected into 293T cells. All experiments were repeated three times. *p < 0.05, **p < 0.01, ***p < 0.001. Ctrl-ev: EVs derived from PBS-treated ACs, Cae-ev: EVs derived from caerulein-treated ACs, NC-mimic: macrophages transfected with NC-mimic, miR-183-5p mimic: macrophages transfected with miR-183-5p mimic, NC-inhibitor: macrophages transfected with NC-inhibitor, miR-183-5p inhibitor: macrophages transfected with miR-183-5p inhibitor, si-NC+miR-183-5p inhibitor: macrophages transfected with miR-183-5p inhibitor and si-NC, siFoxO1+miR-183-5p inhibitor: macrophages transfected with miR-183-5p inhibitor and siFoxO1.
Figure 6
Figure 6
AC-derived EV miR-183-5p aggravates pancreatitis in AP rats in vivo. (A) Overexpression and inhibition of miR-183-5p expression in ACs and EVs were detected using qRT-PCR. The absolute expression of miR-183-5p in pancreatic tissue was calculated from a standard curve of logarithmic values of miR-183-5p concentrations and the CT value. (B) Electron microscopy photographs of pancreatic sections obtained from the above groups of AP rats. Scale bar, 10 μm. (C) Representative photographs and histological scores of HE-stained pancreatic sections obtained from AP rats in the following groups at 6 h after the EV injection s: NC-mimic, NC-inhibitor, miR-183-5p mimic and miR-183-5p inhibitor. Pancreatic injury is indicated by the white arrows. Scale bar, 200 μm. (D) Microscopy images of the distribution of CD68 and iNOS immunostaining in the indicated colors in pancreatic sections from the aforementioned groups of AP rats. Scale bars, 100 μm. The fold change in the number of macrophages co-expressing CD68 and iNOS in the four groups was determined. Scale bar, 400 μm. (E) Creatinine and urea nitrogen levels in the blood and MPO levels in the pancreas were determined. (F) Levels of amylase and lipase in the blood and inflammatory cytokines in the pancreas from the aforementioned groups of AP rats were determined by ELISA. All experiments were repeated three times. *p < 0.05, **p < 0.01, ***p < 0.001. NC-mimic: AP rats treated with EVs from acinar cells transfected with the NC-mimic, miR-183-5p mimic: AP rats treated with EVs from acinar cells transfected with the miR-183-5p mimic, NC-inhibitor: AP rats treated with EVs from acinar cells transfected with the NC-inhibitor, miR-183-5p inhibitor: AP rats treated with EVs from acinar cells transfected with the miR-183-5p inhibitor.
Figure 7
Figure 7
Macrophages overexpressing miR-183-5p aggravate AC damage. (A) Representative western blot and quantification of P-P65/P65 and TNF-α levels in ACs from the four groups: Ctrl, Cae, Cae+NC-mimic M, and Cae+miR-183-5p mimic M. (B) Trypsinogen activation assay in ACs from the above groups. The percentage of positive cells (white arrow) was calculated to quantify the degree of trypsinogen activation. (C) Representative flow cytometry results for necrosis in ACs from the above groups. All experiments were repeated three times. *p < 0.05, **p < 0.01, ***p < 0.001. Ctrl: PBS-treated acinar cells, Cae: caerulein-treated acinar cells, Cae+NC-mimic: M caerulein-treated acinar cells cocultured with macrophages transfected with the NC-mimic, Cae+miR-183-5p mimic M: caerulein-treated acinar cells cocultured with macrophages transfected with the miR-183-5p mimic.
Figure 8
Figure 8
Higher EV miR-183-5p levels in blood from patients with AP positively correlate with disease severity. (A) Representative electron micrograph of EVs purified from blood collected from patients with AP. EVs are labeled with white arrows. Scale bar, 150 μm. (B) NTA of the diameter of EVs in the blood of patients with AP. (C) Western blot analysis of the protein expression of EV markers (including Alix, TSG101 and CD63) in EVs isolated from blood. (D) The level of miR-183-5p in EVs from blood of normal controls and patients with AP. (E) The level of miR-183-5p in EVs from blood of patients with mild and moderate-to-severe AP. Correlation analysis between miR-183-5p expression in blood EVs and blood amylase levels in patients with AP (r = 0.86, p < 0.05). All experiments were repeated three times. *p < 0.05, **p < 0.01, ***p < 0.001. Ctrl-ev: EVs from the serum of normal participants, AP-ev: EVs from the serum of patients with AP, mild group: patients with mild AP, moderate-to-severe group: patients with moderate or severe AP.

Similar articles

Cited by

References

    1. Saluja A, Dudeja V, Dawra R, Sah RP. Early Intra-Acinar Events in Pathogenesis of Pancreatitis. Gastroenterology (2019) 156(7):1979–93. doi: 10.1053/j.gastro.2019.01.268 - DOI - PubMed
    1. Kang R, Lotze MT, Zeh HJ, Billiar TR, Tang D. Cell Death and DAMPs in Acute Pancreatitis. Mol Med (2014) 20:466–77. doi: 10.2119/molmed.2014.00117 - DOI - PMC - PubMed
    1. Gukovskaya AS, Gukovsky I, Algul H, Habtezion A. Autophagy, Inflammation, and Immune Dysfunction in the Pathogenesis of Pancreatitis. Gastroenterology (2017) 153(5):1212–26. doi: 10.1053/j.gastro.2017.08.071 - DOI - PMC - PubMed
    1. Han X, Ni J, Wu Z, Wu J, Li B, Ye X, et al. . Myeloid-Specific Dopamine D2 Receptor Signalling Controls Inflammation in Acute Pancreatitis via Inhibiting M1 Macrophage. Br J Pharmacol (2020) 177(13):2991–3008. doi: 10.1111/bph.15026 - DOI - PMC - PubMed
    1. Wu J, Zhang L, Shi J, He R, Yang W, Habtezion A, et al. . Macrophage Phenotypic Switch Orchestrates the Inflammation and Repair/Regeneration Following Acute Pancreatitis Injury. EBioMedicine (2020) 58:102920. doi: 10.1016/j.ebiom.2020.102920 - DOI - PMC - PubMed

Publication types