. 2022 Jul 15:13:869103.
doi: 10.3389/fneur.2022.869103. eCollection 2022.

The Quest for Anti-α-Synuclein Antibody Specificity-Lessons Learnt From Flow Cytometry Analysis

Affiliations

The Quest for Anti-α-Synuclein Antibody Specificity-Lessons Learnt From Flow Cytometry Analysis

Lukas Leupold et al. Front Neurol. .

Abstract

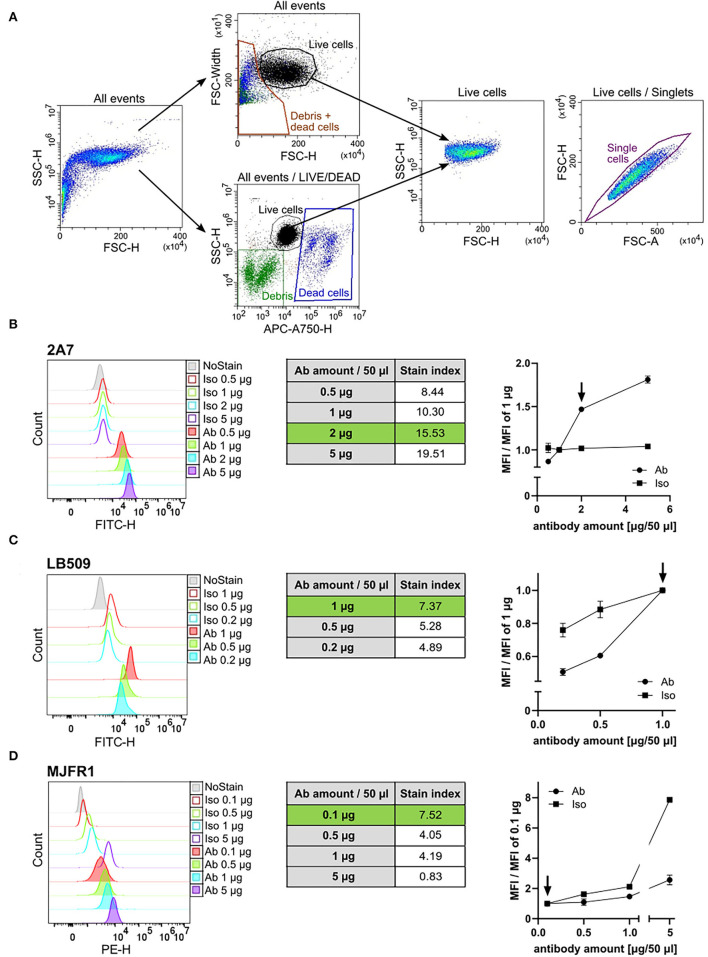
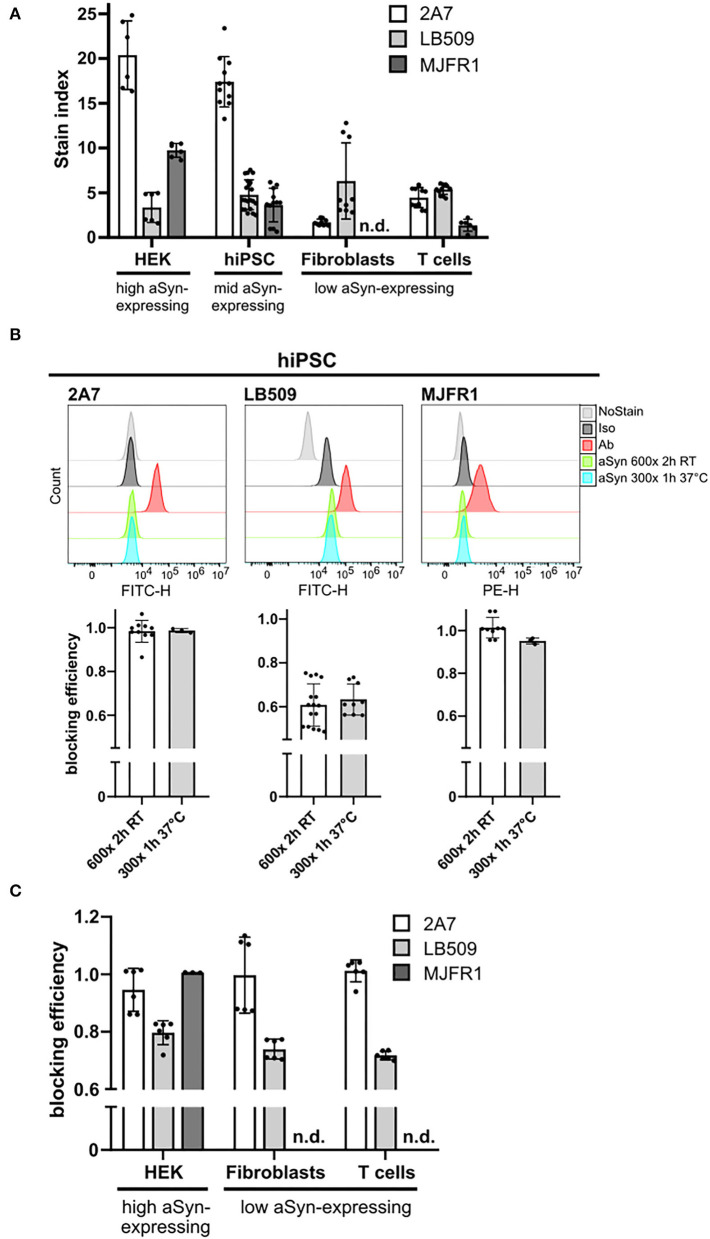
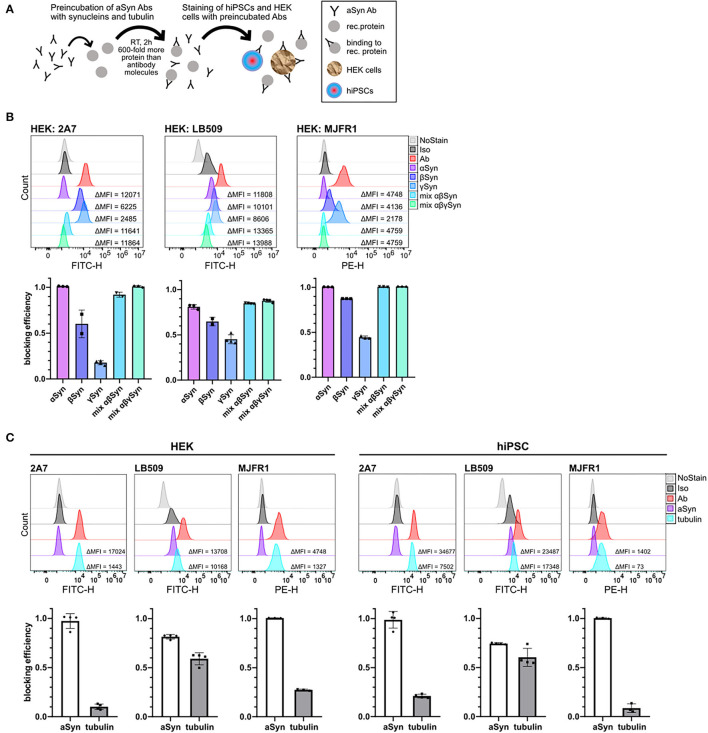
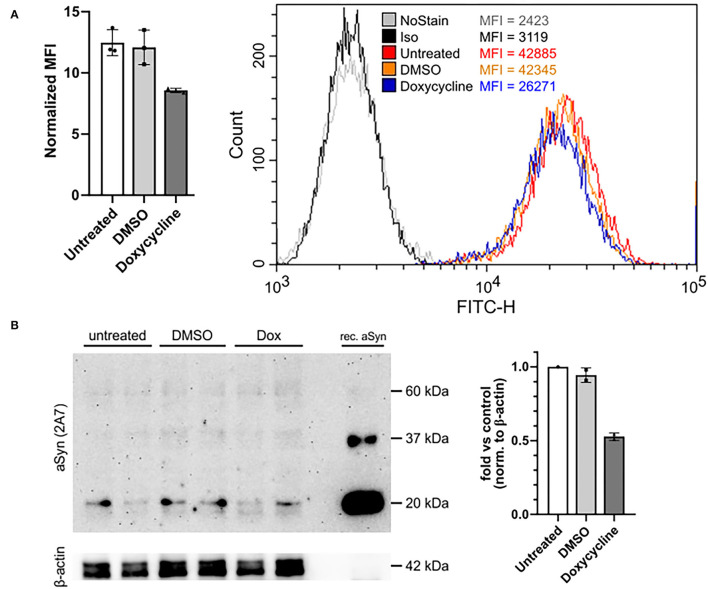
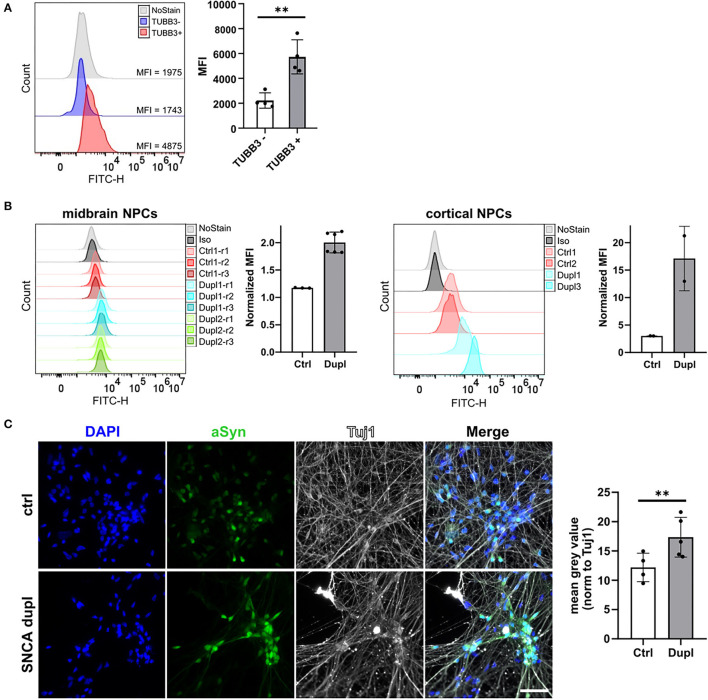
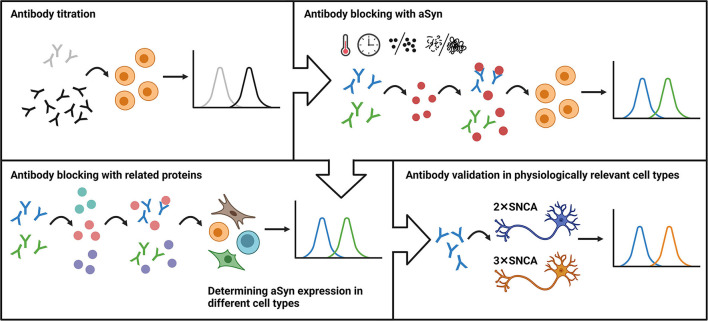
The accumulation of alpha-synuclein (aSyn) is the hallmark of a group of neurodegenerative conditions termed synucleopathies. Physiological functions of aSyn, including those outside of the CNS, remain elusive. However, a reliable and reproducible evaluation of aSyn protein expression in different cell types and especially in low-expressing cells is impeded by the existence of a huge variety of poorly characterized anti-aSyn antibodies and a lack of a routinely used sensitive detection methods. Here, we developed a robust flow cytometry-based workflow for aSyn detection and antibody validation. We test our workflow using three commercially available antibodies (MJFR1, LB509, and 2A7) in a variety of human cell types, including induced pluripotent stem cells, T lymphocytes, and fibroblasts, and provide a cell- and antibody-specific map for aSyn expression. Strikingly, we demonstrate a previously unobserved unspecificity of the LB509 antibody, while the MJFR1 clone revealed specific aSyn binding however with low sensitivity. On the other hand, we identified an aSyn-specific antibody clone 2A7 with an optimal sensitivity for detecting aSyn in a range of cell types, including those with low aSyn expression. We further utilize our workflow to demonstrate the ability of the 2A7 antibody to distinguish between physiological differences in aSyn expression in neuronal and non-neuronal cells from the cortical organoids, and in neural progenitors and midbrain dopaminergic neurons from healthy controls and in patients with Parkinson's disease who have aSyn gene locus duplication. Our results provide a proof of principle for the use of high-throughput flow cytometry-based analysis of aSyn and highlight the necessity of rigorous aSyn antibody validation to facilitate the research of aSyn physiology and pathology.

Keywords: T cell; alpha-synuclein; antibodies; antibody specificity; flow cytometry; synuclein antibodies; α-synuclein expression.


Conflict of interest statement

The authors declare that the research was conducted in the absence of any commercial or financial relationships that could be construed as a potential conflict of interest.

Figures

Figure 1
Figure 1
Antibody titration of the 2A7, LB509, and MJFR1. (A) Representative flow cytometry plots of human induced pluripotent stem cells (hiPSC) gating strategy. Two strategies for gating on living cells were applied: either an exclusion of debris and dead cells based on a forward scatter-height (FSC-H) to FSC-width plot (“All events” upper plot) or labeling of dead cells fluorescently using the Live-or-Dye™ 750/777 fixable dead cell dye (“All events/LIVE/DEAD” lower plot). Both strategies allowed for a comparable and reliable gating of living cells [“Live cells” FSC to side scatter (SSC) density plot]. Single events within living hiPSC were gated based on a pulse area to height signal ratio (“Live cells/Singlets” FSC-A to FSC-H plot). (B–D) Left: Histograms of the intracellular aSyn staining of hiPSC with different amounts of antibody (Ab) and the corresponding amounts of isotype control (Iso) in a total staining volume of 50 μl. Middle: Tables show the stain index (SI) of the intracellular aSyn staining with respective amounts of the 2A7 (B), LB509 (C), or MJFR1 (D) antibodies. The SI was determined for each antibody as the ratio between mean fluorescent intensity (MFI) of the positive population (antibody-stained sample) and MFI of the negative population (isotype control-stained sample) divided by two times the standard deviation (SD) of the negative population. Green rows correspond to the optimal staining-to-background conditions. Right: normalization of MFI of antibody staining signal and isotype controls to the manufacturer's recommended concentrations. Arrows indicate the optimal amount of the antibody per staining at the best signal-to-background ratio.
Figure 2
Figure 2
MJFR1 and 2A7 antibodies exhibit high specificity to aSyn in blocking experiments but differential sensitivity. (A) Stain index (SI) was calculated for three anti-aSyn antibodies used at their respective optimal amounts to quantitatively evaluate physiological aSyn protein levels in a variety of human cell types (HEK cells, hiPSC, fibroblasts, and T cells) and to compare antibody sensitivities. Six independent staining rounds of HEK cells were performed. Three hiPSC lines were used in 3–4 independent staining rounds. Fibroblasts and T cells from 2 individuals were stained in 3 independent experiments. (B) Top: Histograms of the intracellular aSyn staining of hiPSC, showing the signal intensities of unstained (NoStain), isotype control-stained (Iso), antibody-stained (Ab), and pre-incubated with 600- or 300-fold excess of aSyn protein either for 2 h at room temperature (RT) (aSyn 600x 2 h RT) or for 1 h at 37°C (aSyn 300x 1 h 37°C) antibody-stained cells for the AF488-labeled 2A7 and LB509 antibodies and PE-conjugated MJFR1 antibody. Bottom: Quantification of blocking efficiencies for the 2A7, LB509, and MJFR1 antibodies under both tested conditions as in the top panel. Blocking efficiency was calculated as a signal intensity difference between cells stained directly and with pre-blocked antibodies related to singal intensity difference between direct staining with a specific antibody and no stain control. 2 hiPSC lines were tested in 3 independent experiments. (C) Blocking of stainings with 2A7, LB509, and MJFR1 antibodies by pre-incubating them with a 600-fold molecular excess of aSyn protein for 2 h at RT in different human cell types (HEK cells, fibroblasts, and T cells). Blocking efficiency was calculated as in (B). Fibroblasts and T cells from 2 individuals were stained in 3 independent experiments; 6 independent staining rounds for HEK cells were performed. Error bars represent standard deviations. n.d., not determined; RT, room temperature; h, hours.
Figure 3
Figure 3
Comparison of a cross-reactivity of 2A7, LB509, and MJFR1 antibodies with different synucleins and rat tubulin. (A) Schematic illustration of protein blocking experiments. Anti-aSyn antibodies were pre-incubated for 2 hours at room temperature (RT) with 600-fold molecular excess of a recombinant protein and intracellular aSyn staining of hiPSC or HEK cells was performed. (B) In HEK cells, 2A7 and MJFR1 antibodies were efficiently blocked by pre-incubating them with aSyn, while the LB509 and MJFR1 antibodies but not the 2A7 antibody exhibit remarkable cross-reactivity with β- and γ-synucleins. Top: representative histograms of the intracellular aSyn staining of HEK cells with either AF488-conjugated 2A7 (HEK: 2A7) or LB509 antibody (HEK: LB509) or PE-conjugated MJFR1 antibody (HEK: MJFR1) before and after blocking with α-, β-, γ-synucleins (αSyn, βSyn, γSyn, respectively), or with mixtures of either α- and β-synucleins (mix αβSyn) or α-, β-, and γ-synucleins (mix αβγSyn). Bottom: blocking efficiencies for each condition shown in histograms were calculated as a ratio of the difference in MFI between aSyn staining and staining with pre-blocked antibody to the difference in MFI between aSyn staining and no staining control (NoStain). Error bars represent standard deviations. (C) LB509, but not MJFR1 and 2A7 exhibits significant cross-reactivity with pig brain-derived tubulin in HEK cells and hiPSC. Top: histograms of the intracellular aSyn staining of HEK cells and hiPSC with 2A7, LB509, or MJFR1 antibodies before and after blocking with either aSyn (aSyn) or pig brain-derived tubulin (tubulin). Bottom: comparison of cross-reactivity of 2A7, LB509, and MJFR1 antibodies with pig brain-derived tubulin represented by blocking efficiencies. Blocking efficiency was calculated as described in (B). Ab, antibody staining; Iso, staining with isotype control; MFI, mean fluorescence intensity.
Figure 4
Figure 4
The 2A7 antibody detects physiological aSyn expression levels. (A) The 2A7 antibody detects biological changes of aSyn protein expression in H4 cells overexpressing aSyn under the control of a tetracycline-responsive promoter (tet-off system). Left: Comparison of normalized MFI of intracellular aSyn staining with the 2A7 antibody of H4 cells overexpressing aSyn (untreated) and treated with either diluent control (DMSO) or doxycycline (Dox). Normalized MFI was calculated as MFI value of the antibody-stained sample divided by the MFI of the isotype control staining. Right: Representative histograms of intracellular aSyn staining with the 2A7 antibody of untreated and treated with DMSO or doxycycline H4 cell overexpressing aSyn under the tet-off system. Iso, isotype control; MFI, mean fluorescence intensity. (B) Detection of aSyn protein levels in untreated and treated with DMSO or doxycycline (Dox) H4 cell overexpressing aSyn under the tet-off system with the 2A7 antibody by using Western blot (WB). Left: WB membrane probed with the 2A7 antibody. Two replicates per sample were loaded. Recombinant aSyn (rec. aSyn) was loaded as a positive control for aSyn protein detection. Distinct bands at the approximate size of aSyn monomer (just below 20 kDa protein marker) were detected. β-Actin was used as a loading control. Right: Quantification of the WB results revealed marked downregulation of aSyn protein level in Doxycycline-treated aSyn overexpressing H4 cells compared to DMSO-treated or untreated ones. The band intensity of aSyn monomer was normalized to β-actin in each sample followed by the normalization to the untreated sample.
Figure 5
Figure 5
The 2A7 antibody detects aSyn expression in neural precursors and neurons. (A) The 2A7 antibody detects higher aSyn protein levels in neurons (TUBB3+) compared to non-neuronal cells (TUBB3-) in hiPSC-derived cortical organoids. Left: Histograms of intracellular aSyn staining of hiPSC-derived cortical organoid cells. Right: Comparison of mean fluorescence intensities (MFI) of intracellular aSyn staining in TUBB3+ and TUBB3- organoid cells. Error bars represent standard deviations. Four independent staining experiments were performed. (B) Intracellular aSyn staining with the 2A7 antibody in the midbrain and cortical neural precursor cells (NPCs) revealed a more robust detection of an aSyn protein increase in NPC from patients with Parkinson's disease having SNCA locus duplication (Dupl 1, 2, and 3 lines) compared to control NPC (Ctrl 1 and 2 lines). Histograms (“midbrain NPCs” and “cortical NPCs”) and quantified mean fluorescence intensities (MFI, right to each histogram) are shown. Normalized MFI values for each staining were calculated as a difference between MFI of antibody staining and of isotype control staining (Iso). (C) The 2A7 antibody detects a significant increase of aSyn expression in hiPSC-derived midbrain dopaminergic neurons from SNCA locus duplication in patients with Parkinson's disease (SNCA dupl) compared to control (ctrl) using immunocytochemistry. Left: Representative images of ctrl (Ctrl 1 line) and SNCA dupl hiPSC-derived (Dupl 1 line) midbrain dopaminergic neurons stained for aSyn (green) with 2A7 antibody, tubulin β3 (Tuj 1; white), and DAPI (blue). Right: Quantification of mean gray values of the 2A7 aSyn staining of ctrl and SNCA dupl midbrain dopaminergic neurons. Error bars represent standard deviations. Five independent measurements were performed. **p < 0.01, one-way ANOVA.
Figure 6
Figure 6
The schematic representation of the flow cytometry-based workflow for anti-aSyn antibody validation and aSyn detection. The workflow includes an antibody titration in order to optimize signal-to-noise ratio (Antibody titration), followed by blocking experiments based on the pre-incubation step of antibody with its specific target (Antibody blocking with aSyn) and related protein(s) (Antibody blocking with related proteins), evaluation antibody specificity and sensitivity in different cell types (Determining aSyn expression in different cell types), with a final confirmation of the antibody validity by testing its capability to detect physiologically-relevant protein levels (Antibody validation in physiologically-relevant cell types).

Similar articles

Cited by

References

    1. Henderson MX, Trojanowski JQ, Lee VMY. α-synuclein pathology in Parkinson's disease and related α-synucleinopathies. Neurosci Lett. (2019) 709:134316. 10.1016/j.neulet.2019.134316 - DOI - PMC - PubMed
    1. Lermyte F. Roles, characteristics, and analysis of intrinsically disordered proteins: a minireview. Life (Basel). (2020) 10:320. 10.3390/life10120320 - DOI - PMC - PubMed
    1. Sormanni P, Aprile FA, Vendruscolo M. Rational design of antibodies targeting specific epitopes within intrinsically disordered proteins. Proc Natl Acad Sci USA. (2015) 112:9902–7. 10.1073/pnas.1422401112 - DOI - PMC - PubMed
    1. Alam P, Bousset L, Melki R, Otzen DE. α-synuclein oligomers and fibrils: a spectrum of species, a spectrum of toxicities. J Neurochem. (2019) 150:522–34. 10.1111/jnc.14808 - DOI - PubMed
    1. Kumar ST, Jagannath S, Francois C, Vanderstichele H, Stoops E, Lashuel HA. How specific are the conformation-specific α-synuclein antibodies? Characterization and validation of 16 α-synuclein conformation-specific antibodies using well-characterized preparations of α-synuclein monomers, fibrils and oligomers with distinct structures and morphology. Neurobiol Dis. (2020) 146:105086. 10.1016/j.nbd.2020.105086 - DOI - PubMed

LinkOut - more resources