. 2022 Jul 14:9:945808.
doi: 10.3389/fmolb.2022.945808. eCollection 2022.

Antibody-Antigen Binding Interface Analysis in the Big Data Era

Affiliations

Antibody-Antigen Binding Interface Analysis in the Big Data Era

Pedro B P S Reis et al. Front Mol Biosci. .

Abstract

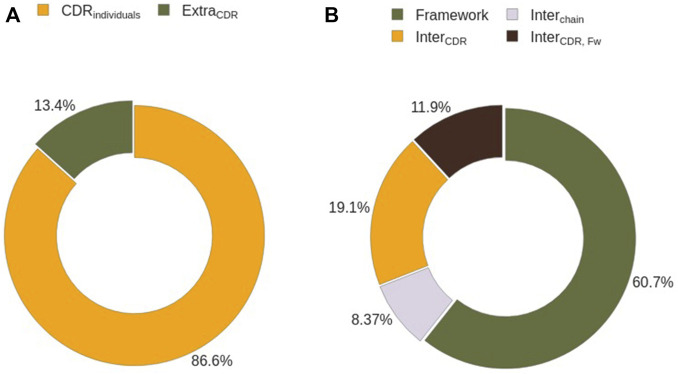
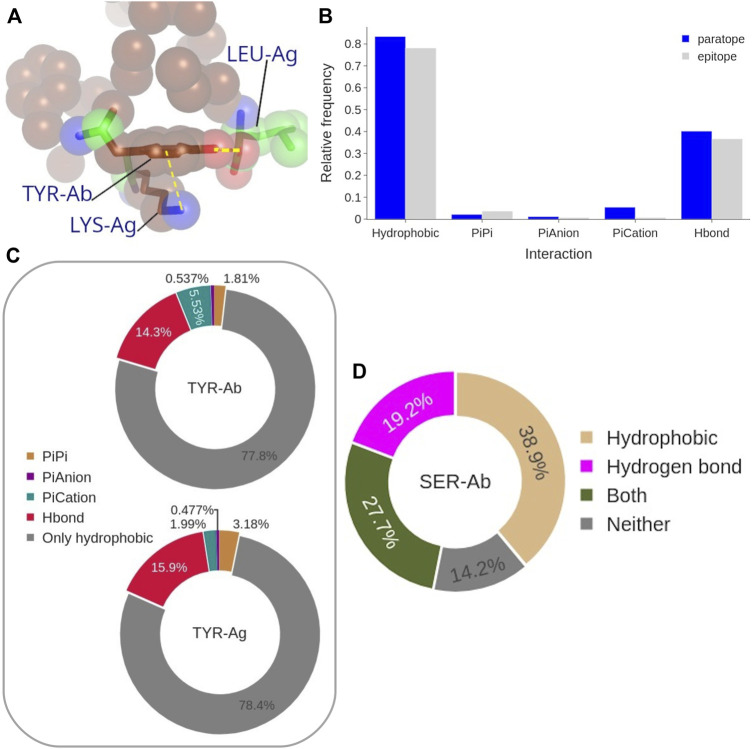
Antibodies have become the Swiss Army tool for molecular biology and nanotechnology. Their outstanding ability to specifically recognise molecular antigens allows their use in many different applications from medicine to the industry. Moreover, the improvement of conventional structural biology techniques (e.g., X-ray, NMR) as well as the emergence of new ones (e.g., Cryo-EM), have permitted in the last years a notable increase of resolved antibody-antigen structures. This offers a unique opportunity to perform an exhaustive structural analysis of antibody-antigen interfaces by employing the large amount of data available nowadays. To leverage this factor, different geometric as well as chemical descriptors were evaluated to perform a comprehensive characterization.

Keywords: antibody-antigen complex; complementarity-determining region (CDR); epitope analysis; paratope analysis; structure analysis and characterization.


Conflict of interest statement

The authors declare that the research was conducted in the absence of any commercial or financial relationships that could be construed as a potential conflict of interest.

Figures

FIGURE 1
FIGURE 1
Binding surfaces identification and separation into connected components for Human Hedgehog acyltransferase in complex with two Fab antibody fragments (pdb code: 7MHY). In cyan the surface of the antibody fragment; in white, the antigen. The paratope, shown in the left bottom, is in gray while the different connected components of the epitope surface are colored in green and red, respectively. On the right: zoom of the epitope surface patches. Each color indicates a distinct connected component of the epitope. Components that are a fraction below 5% of the total contact area are discarded, yielding in this case two residual components.
FIGURE 2
FIGURE 2
Procedure to characterize C-C interactions between Ag and Ab. (A) The example of interacting carbon pair from PDB ID: 4CMH shows that the distances between CE1 atom from Tyr92 (paratope) and CB and CG atoms from His79 (epitope) are within the threshold (5 Å), but not between CE1 and CD2. (B) Evaluation of the potential shielding between CE1 and CG. The first dot product between VCE1−CG and VCE1−ND1 exceeds the threshold (0.85) and indicates that the ND1 atom from His79 is either between the C atoms, or behind CG. The second dot product between VCE1−CG and VCGND1 confirms the shielding as its value is below the threshold (−0.2). (C) Evaluation of the potential shielding between CE1 and CB. The first dot product value between VCGCE2 and VCGND1 below the threshold (0.85) already proves that CE1-CB interaction is cleared. In all figures, carbon atoms accepted for the hydrophobic cluster are shown in brown, while rejected C atoms are in yellow and nitrogen in blue.
FIGURE 3
FIGURE 3
Paratope analysis. (A) Covox-269 Fab interacting with the receptor binding domain of SARS-Cov-2 spike protein (PDB code: 7NEH) as representative structure of an Ab-Ag complex. (B) Distribution of paratope residues according to Ab chain type and CDR presence. (C) Distribution of CDRs in the paratope. (D) Distribution of paratope residues given the number of H3 residues. Color code: light chain elements (magenta), heavy chain elements (cyan).
FIGURE 4
FIGURE 4
Comparison between the amino acid composition of paratope (blue), epitope (orange), and the entire SES of the antigen (gray). Individual structures are taken from that of the complex, by rigid removal. Data calculated over the SabDab database as of May 2022 (1425 structures).
FIGURE 5
FIGURE 5
Epitope analysis. (A) Covox-269 Fab interacting with the receptor binding domain of SARS-Cov-2 spike protein (PDB code: 7NEH) as representative structure of Ab-Ag complex. The antigen is represented as a solid surface. Color code: antibody heavy/light chains (cyan/magenta), epitope (orange). (B) Length, expressed in residue number, distribution in all sequential epitope stretches and in the longest one. (C) Distribution of the fraction of residues at the epitope exclusively exposed at each considered probe radius. (D) Distribution of the secondary structure of the epitope. The different secondary structure elements were grouped in helix (H), strand (E), and loops (C).
FIGURE 6
FIGURE 6
Analysis of the hydrophobic interactions in Ab-Ag complexes. (A) Representative structure of the hydrophobic cluster in the Ab-Ag interface. (B) Number of C atoms that participate in the biggest hydrophobic cluster. (C) Participation (in %) of each CDR to the biggest hydrophobic cluster. (D) Amino acid contribution in the biggest hydrophobic cluster, computed by counting the number of carbon atoms contributed by that amino acid type to the cluster.
FIGURE 7
FIGURE 7
Interface titratable residues characterization. (A) Average pK a shift of titratable residues at the Ab-Ag interface with respect to their value in water. (B) Distribution of the net charge in the paratope and epitope at pH 7.2. (C) Ab-Ag interface charge complementary composition. Distinctions are made among interfaces in which paratope and epitope have the same charge, opposite charges, and when one partner is neutral.
FIGURE 8
FIGURE 8
(A) Graphical representation of the different types of polar interactions. (B) Distribution of the different roles of polar atoms at the Ab-Ag interface. Participation (in %) of the polar atoms in each CDR to the polar bonds. (C) Participation of each CDR in polar interactions. (D) Distribution probability of H-bonds, salt bridges and water-mediated interactions to all polar bonds.
FIGURE 9
FIGURE 9
Epitope residues characterization by their interacting partner. (A) Identification of epitope residues interacting with single CDRs. (B) Sub-classification of epitope residues not interacting with CDRs on an individual basis.
FIGURE 10
FIGURE 10
(A) Representative structure of coordinated interactions of Tyr from PDB: 3CVH. Tyr is participating in the main hydrophobic cluster (brown spheres) while forming H-bond and π-cation with two Ag residues. (B) Frequency of each interaction type performed by the paratope (blue) and epitope (gray) Tyrosines. (C) Frequency of the coordinated interactions of paratope and epitope Tyrosines that occur within hydrophobic clusters. (D) Frequency of paratope Ser forming H-bond, to participate in a hydrophobic cluster, both, or neither of them.

References

    1. Cignoni P., Callieri M., Corsini M., Dellepiane M., Ganovelli F., Ranzuglia G. (2008). “MeshLab: an Open-Source Mesh Processing Tool,” in Eurographics Italian Chapter Conference. Editors Scarano V., Chiara R. D., Erra U. (Champagne-Ardenne: The Eurographics Association; ). 10.2312/LocalChapterEvents/ItalChap/ItalianChapConf2008/129-136 - DOI
    1. [Dataset] Muntoni A., Cignoni P. (2021). PyMeshLab. 10.5281/zenodo.4438750 - DOI
    1. Dalkas G. A., Teheux F., Kwasigroch J. M., Rooman M. (2014). Cation-π, Amino-π, π-π, and H‐bond Interactions Stabilize Antigen-Antibody Interfaces. Proteins 82, 1734–1746. 10.1002/prot.24527 - DOI - PubMed
    1. Decherchi S., Colmenares J., Catalano C. E., Spagnuolo M., Alexov E., Rocchia W. (2013). Between Algorithm and Model: Different Molecular Surface Definitions for the Poisson-Boltzmann Based Electrostatic Characterization of Biomolecules in Solution. Commun. Comput. Phys. 13, 61–89. 10.4208/cicp.050711.111111s - DOI - PMC - PubMed
    1. Decherchi S., Rocchia W. (2013). A General and Robust Ray-Casting-Based Algorithm for Triangulating Surfaces at the Nanoscale. Plos One 8, e59744–15. 10.1371/journal.pone.0059744 - DOI - PMC - PubMed

LinkOut - more resources