

Identification of Effective Diagnostic Biomarkers and Immune Cell Infiltration in Atopic Dermatitis by Comprehensive Bioinformatics Analysis
- PMID: 35911963
- PMCID: PMC9330059
- DOI: 10.3389/fmolb.2022.917077
Identification of Effective Diagnostic Biomarkers and Immune Cell Infiltration in Atopic Dermatitis by Comprehensive Bioinformatics Analysis
Abstract
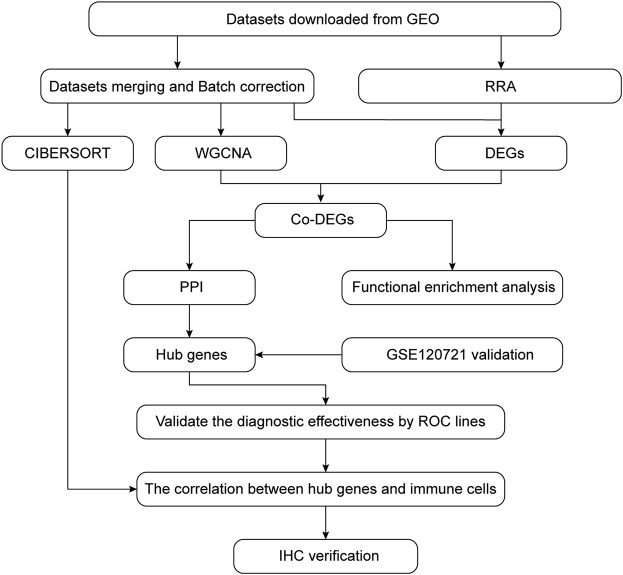
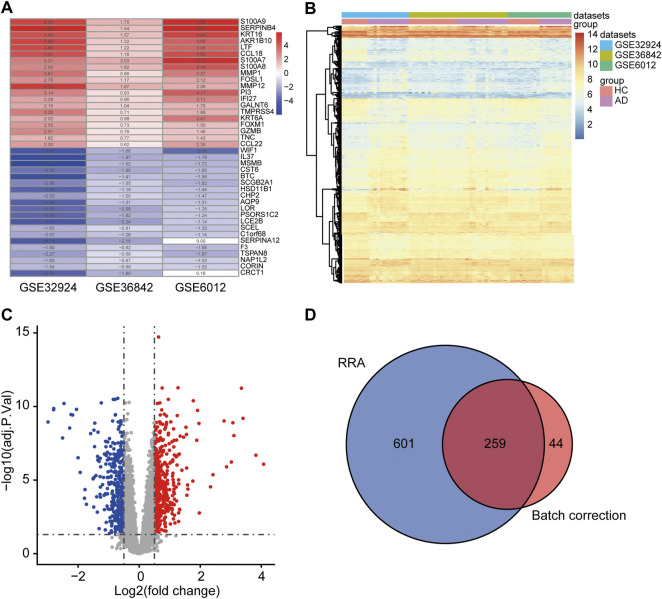
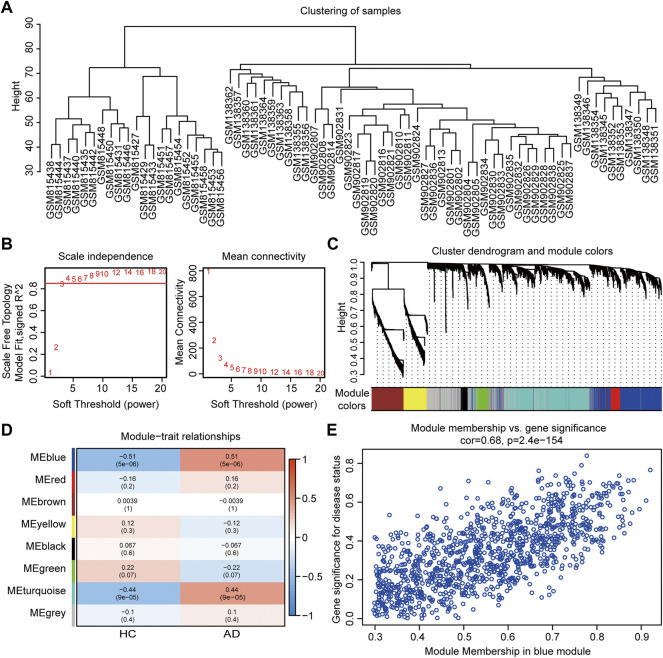
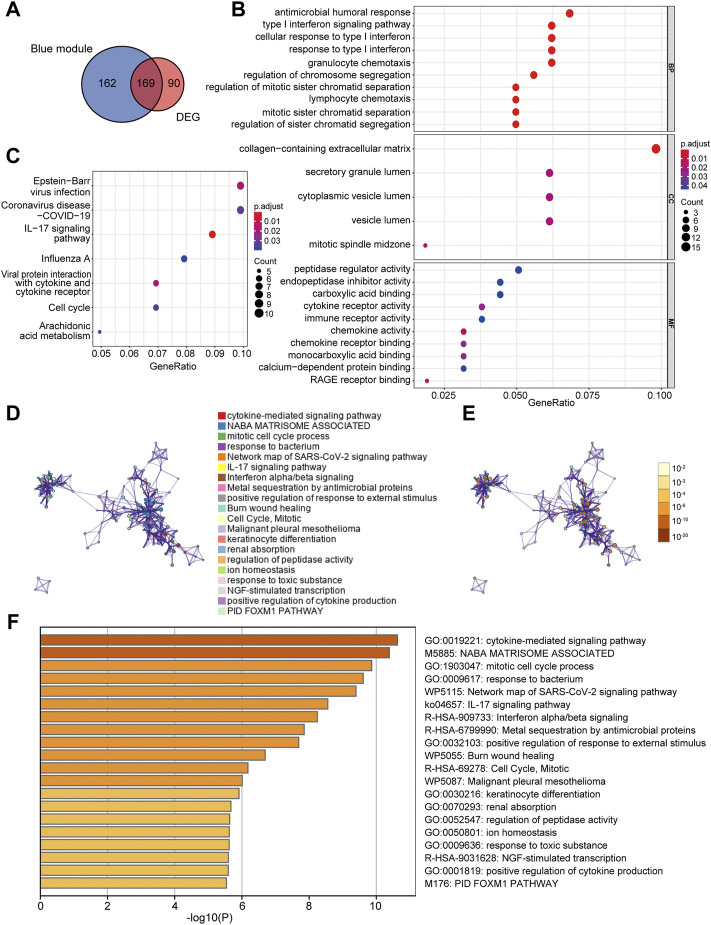
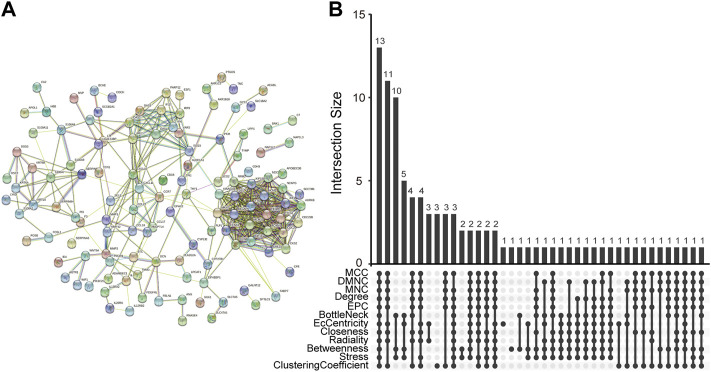
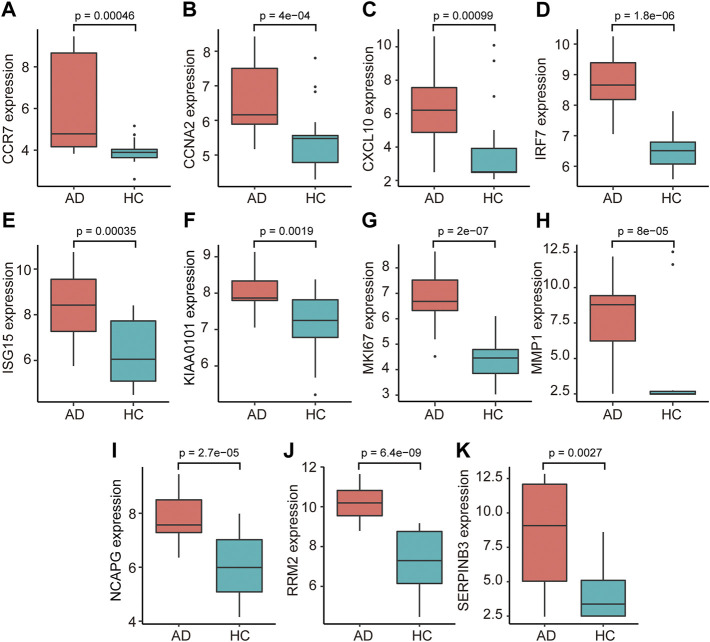
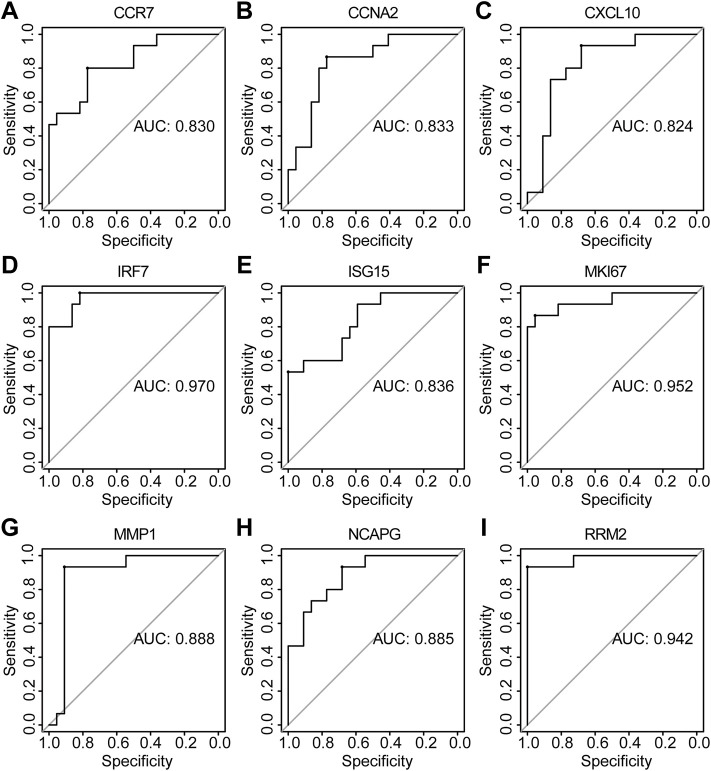
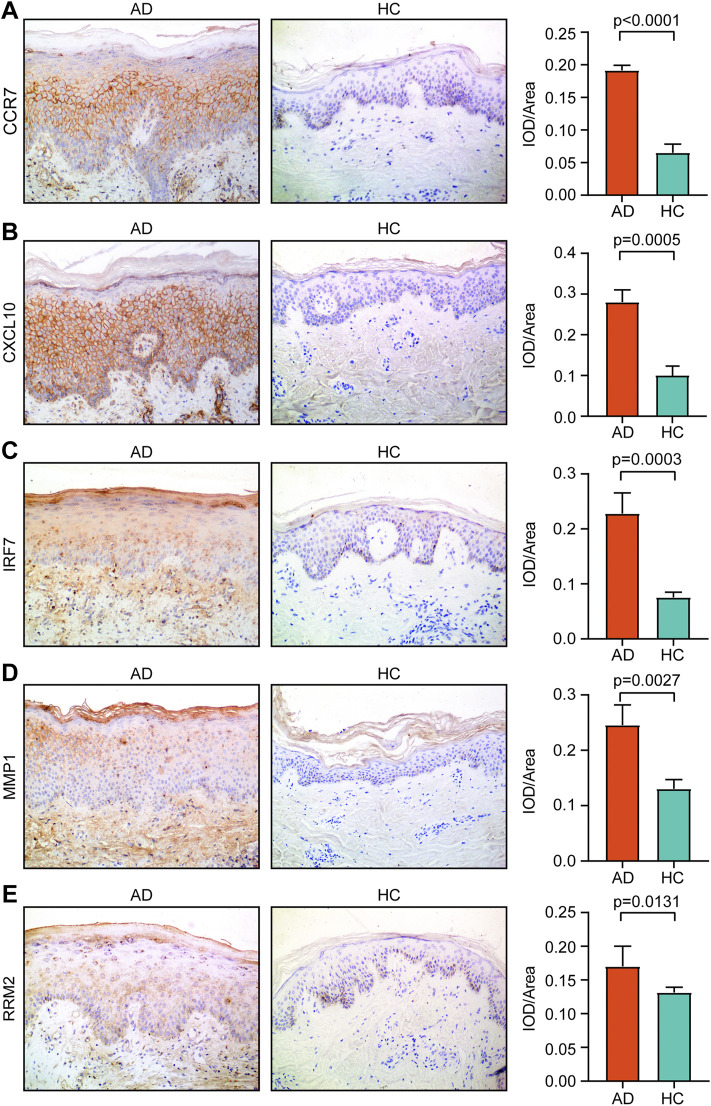
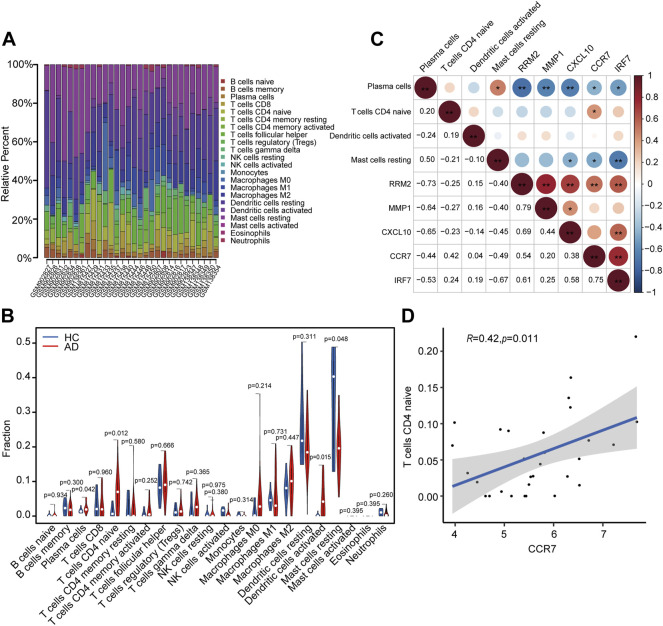
Background: Atopic dermatitis (AD) is a dermatological disorder characterized by symptoms such as chronically inflamed skin and frequently intolerable itching. The mechanism underlying AD development is still unclear. Our study aims to identify the diagnostic and therapeutic biomarkers for AD and provide insight into immune mechanisms at the molecular level through bioinformatics analysis. Methods: The GSE6012, GSE32924, and GSE36842 gene expression profiles were obtained for analysis from the Gene Expression Omnibus database. Differentially expressed genes (DEGs) were segregated using the "Batch correction" and "RobustRankAggreg" methods. Weighted gene co-expression network analysis (WGCNA) was performed to screen for module genes with AD traits. Then, common DEGs (co-DEGs) were screened out via combined differential expression analysis and WGCNA. Functional enrichment analysis was performed for these co-DEGs using Gene Ontology (GO) and the Kyoto Encyclopedia of Genes and Genomes (KEGG), followed by protein-protein interaction network analysis. Candidate hub genes were identified using the "cytoHubba" plugin in Cytoscape, and their value for AD diagnosis was validated using receiver operating characteristic curve analysis in the external database GSE120721. Immunohistochemical staining was performed for further validation. The CIBERSORT algorithm was used to evaluate skin samples obtained from healthy controls (HCs) and lesions of AD patients, to determine the extent of immune cell infiltration. The association between the identified hub genes and significant differential immune cells was analyzed using Pearson correlation analysis. Results: A total of 259 DEGs were acquired from the intersection of DEGs obtained by the two independent procedures, and 331 AD-trait module genes were separated out from the blue module via WGCNA analysis. Then, 169 co-DEGs arising from the intersection of the 259 DEGs and the 331 AD-trait module genes were obtained. We found that co-DEGs were significantly enhanced in the type I interferon and IL-17 signal transduction pathways. Thirteen potential hub genes were identified using Cytoscape. Five hub genes (CCR7, CXCL10, IRF7, MMP1, and RRM2) were identified after screening via external dataset validation and immunohistochemical analysis. We also identified four significant differential immune cells, i.e., activated dendritic cells, plasma cells, resting mast cells, and CD4+ naïve T cells, between AD patients and HCs. Moreover, the relationship between the identified hub genes and significant differential immune cells was analyzed. The results showed that the CCR7 expression level was positively correlated with the number of CD4+ naïve T cells (R = 0.42, p = 0.011). Conclusion: CCR7, CXCL10, IRF7, MMP1, and RRM2 could be potential diagnostic and therapeutic biomarkers for AD. CCR7 expression level was positively correlated with the number of CD4+ naïve T cells in AD. These findings need to be corroborated in future studies.
Keywords: atopic dermatitis; bioinformatics analysis; diagnostic biomarkers; immune cells infiltration; immunohistochemical verification.
Copyright © 2022 Li, Lu and Han.
Conflict of interest statement
The authors declare that the research was conducted in the absence of any commercial or financial relationships that could be construed as a potential conflict of interest.
Figures
References
-
- Basałygo M., Śliwińska J., Żbikowska-Gotz M., Lis K., Socha E., Bartuzi Z., et al. (2021). Assessment of Serum Concentrations of Matrix Metalloproteinase-1, Matrix Metalloproteinase 2 and Tissue Inhibitors of Metalloproteinases 1 in Atopic Dermatitis in Correlation with Disease Severity and Epidermal Barrier Parameters. pdia 38 (5), 773–779. 10.5114/ada.2021.110043 - DOI - PMC - PubMed
LinkOut - more resources
Full Text Sources
Research Materials
Miscellaneous