. 2022 Jul 22;4(4):fcac187.
doi: 10.1093/braincomms/fcac187. eCollection 2022.

Structural disconnection and functional reorganization in Fabry disease: a multimodal MRI study

Affiliations

Structural disconnection and functional reorganization in Fabry disease: a multimodal MRI study

Ilaria Gabusi et al. Brain Commun. .

Abstract

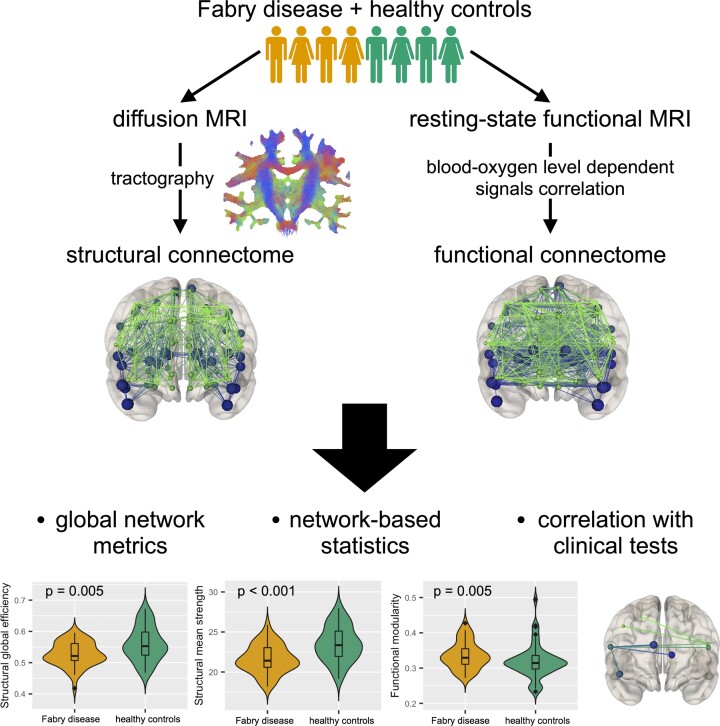
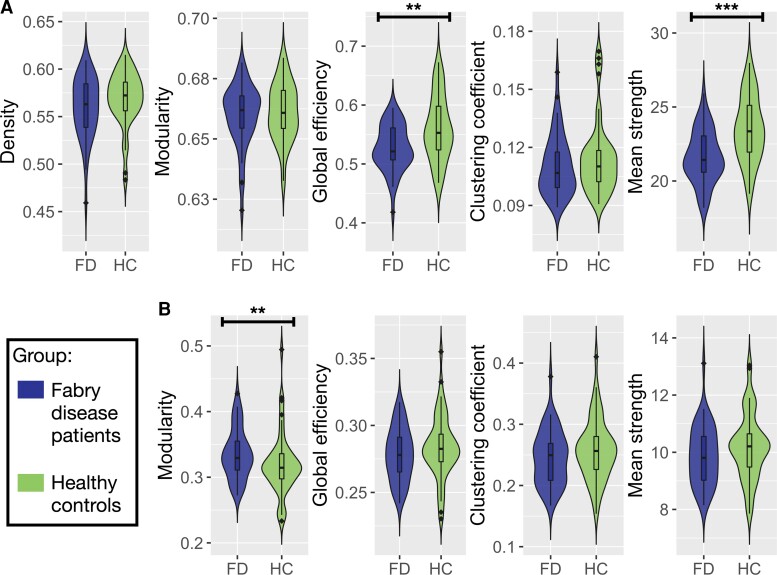
Central nervous system involvement in Fabry disease, a rare systemic X-linked lysosomal storage disorder, is characterized by the presence of heterogeneous but consistent functional and microstructural changes. Nevertheless, knowledge about the degree and extension of macro-scale brain connectivity modifications is to date missing. In this work, we performed connectomic analyses of diffusion and resting-state functional MRI to investigate changes of both structural and functional brain organization in Fabry disease, as well as to explore the relationship between the two and their clinical correlates. In this retrospective cross-sectional study, 46 patients with Fabry disease (28F, 42.2 ± 13.2years) and 49 healthy controls (21F, 42.3 ± 16.3years) were included. All subjects underwent an MRI examination including anatomical, diffusion and resting-state functional sequences. Images were processed to obtain quantitative structural and functional connectomes, where the connections between regions of interest were weighted by the total intra-axonal signal contribution of the corresponding bundle and by the correlation between blood-oxygen level-dependent time series, respectively. We explored between-group differences in terms of both global network properties, expressed with graph measures and specific connected subnetworks, identified using a network-based statistics approach. As exploratory analyses, we also investigated the possible association between cognitive performance and structural and functional connectome modifications at both global and subnetwork level in a subgroup of patients (n = 11). Compared with healthy controls, patients with Fabry disease showed a significantly reduced global efficiency (P = 0.005) and mean strength (P < 0.001) in structural connectomes, together with an increased modularity (P = 0.005) in functional networks. As for the network-based statistics analysis, a subnetwork with decreased structural connectivity in patients with Fabry disease compared with healthy controls emerged, with eight nodes mainly located at the level of frontal or deep grey-matter areas. When probing the relation between altered global network metrics and neuropsychological tests, correlations emerged between the structural and functional disruption with results at verbal and working memory tests, respectively. Furthermore, structural disruption at subnetwork level was associated with worse executive functioning, with a significant moderation effect of functional changes suggesting a compensation mechanism. Taken together, these results further expand the current knowledge about brain involvement in Fabry disease, showing widespread structural disconnection and functional reorganization, primarily sustained by loss in axonal integrity and correlating with cognitive performance.

Keywords: Fabry disease; brain connectivity; magnetic resonance imaging; microstructure informed tractography; multimodal study.


Figures

Graphical abstract
Graphical abstract
Figure 1
Figure 1
Flow chart summarizing the main steps of this study. Probabilistic tractography was performed and combined with the GM parcellation to identify the structural connectomes. Through COMMIT, they were quantified by exploiting the microstructure information included in the diffusion-weighted MRIs. In parallel, functional connectomes were obtained by analysing the correlation between BOLD signals of different regions of interest. From both types of networks (structural and functional), global graph metrics were extracted and evaluated as descriptors of brain connectivity. By means of NBS, a subnetwork associated with a significant between-group difference was extracted from the complete structural connectomes. Finally, possible associations between altered global network metrics and neuropsychological tests were investigated. dMRI, diffusion-weighted magnetic resonance imaging; FOD, fibre orientation distribution; COMMIT, Convex Optimization Modelling for Microstructure Informed Tractography; WM, white matter; fMRI, functional magnetic resonance imaging; BOLD, blood-oxygen level dependent; NBS, network-based statistics.
Figure 2
Figure 2
Violin plots of global network metrics extracted for the structural and functional connectomes. (A) Violin plots showing the differences in structural global network metrics (density, modularity, global efficiency, clustering coefficient and mean strength) between Fabry disease patients (FD, on the left) and healthy controls (HC, on the right). (B) Violin plots representing the distribution of the functional global network in the two groups of participants (FD and HC). Density is not reported because it was used to threshold the functional connectomes. Between-group differences between graph measures were tested with age and sex (and mean motion for functional connectome-related metrics) adjusted robust ANCOVA tests. Significance codes: ***0 ≤ P ≤ 0.001, **0.001 < P ≤ 0.01, *0.01 < P ≤ 0.05.
Figure 3
Figure 3
Network-based statistics results. Image shows coronal (A), axial (B) and sagittal (C) views of the subnetwork with decreased structural connectivity in Fabry disease patients (N = 46) compared with HCs (N = 49), emerging from the network-based statistics analysis with a primary threshold of t = 3.0. Its eight nodes, whose size reflects the number of their connections in the subnetwork (i.e. node’s degree), are: right superior frontal gyrus (SFGdor.R), right middle frontal gyrus (MFG.R), right inferior frontal gyrus—triangular part (IFGtriang.R), right inferior frontal gyrus—orbital part (ORBinf.R), right anterior cingulate and paracingulate gyri (ACG.R), left thalamus (THA.L), right inferior frontal gyrus—opercular part (IFGoperc.L) and left inferior frontal gyrus—triangular part (IFGtriang.L).
Figure 4
Figure 4
Executive functioning and the structure−function interaction. Plot shows the linear relationship between WCFST scores and structural connectivity disruption within the NBS-derived subnetwork at different levels of functional connectivity deviation (−0.21, 0.26 and 0.74, corresponding to −1 SD, mean and +1 SD of its distribution). Preserved functional connectivity tends to attenuate the impact of WM network disruption on executive functioning. The multiple linear regression model predicting WCFST scores was significant (R2 = 0.850, P = 0.04), with the following terms: constant (β = 16.364, 95% CI: 10.200, 22.528; SE = 2.395; P = 0.001); structural connectivity disruption (β = 15.809, 95% CI: 8.257, 23.360; SE = 2.934; P = 0.003); functional connectivity deviation (β = −10.793, 95% CI: −18.224, −3.361; SE = 2.887; P = 0.01); structural connectivity disruption*functional connectivity deviation (β = −28.636, 95% CI: −49.687, −7.584; SE = 8.178; P = 0.02); age (β = −0.070, 95% CI: −0.176, 0.037; SE = 0.041; P = 0.15); sex (β = −0.681, 95% CI: −4.099, 2.736; SE = 1.328; P = 0.63).

References

    1. Germain DP. Fabry disease. Orphanet J Rare Dis. 2010;5(1):30–49. 10.1186/1750-1172-5-30 - DOI - PMC - PubMed
    1. Satoh K. Globotriaosylceramide induces endothelial dysfunction in Fabry disease. Arterioscler Thromb Vasc Biol. 2014;34(1):2–4. 10.1161/ATVBAHA.113.302744 - DOI - PubMed
    1. Sims K, Politei J, Banikazemi M, Lee P. Stroke in Fabry disease frequently occurs before diagnosis and in the absence of other clinical events. Stroke 2009;40(3):788–794. 10.1161/STROKEAHA.108.526293 - DOI - PubMed
    1. Körver S, Vergouwe M, Hollak CEM, van Schaik IN, Langeveld M. Development and clinical consequences of white matter lesions in Fabry disease: a systematic review. Mol Genet Metab. 2018;125(3):205–216. 10.1016/j.ymgme.2018.08.014 - DOI - PubMed
    1. Stefaniak JD, Parkes LM, Parry-Jones AR, et al. . Enzyme replacement therapy and white matter hyperintensity progression in Fabry disease. Neurology 2018;91(15):e1413–e1422. 10.1212/WNL.0000000000006316 - DOI - PMC - PubMed

LinkOut - more resources