. 2022 Jul 13:12:875264.
doi: 10.3389/fonc.2022.875264. eCollection 2022.

Necroptosis-Related Genes Signatures Identified Molecular Subtypes and Underlying Mechanisms in Hepatocellular Carcinoma

Affiliations

Necroptosis-Related Genes Signatures Identified Molecular Subtypes and Underlying Mechanisms in Hepatocellular Carcinoma

Jianguo Wei et al. Front Oncol. .

Abstract

Background: Although emerging evidence supports the relationship between necroptosis (NEC) related genes and hepatocellular carcinoma (HCC), the contribution of these necroptosis-related genes to the development, prognosis, and immunotherapy of HCC is unclear.

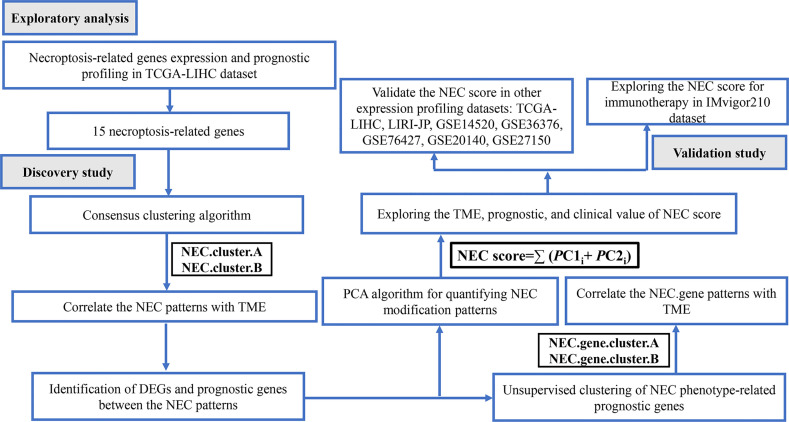
Methods: The expression of genes and relevant clinical information were downloaded from TCGA-LIHC, LIRI-JP, GSE14520/NCI, GSE36376, GSE76427, GSE20140, GSE27150, and IMvigor210 datasets. Next, we used an unsupervised clustering method to assign the samples into phenotype clusters base on 15 necroptosis-related genes. Subsequently, we constructed a NEC score based on NEC phenotype-related prognostic genes to quantify the necroptosis related subtypes of individual patients.

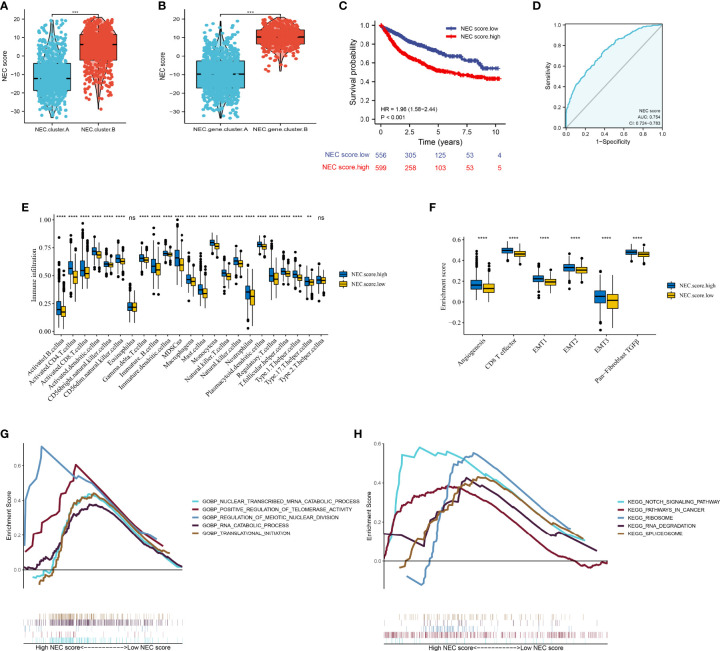
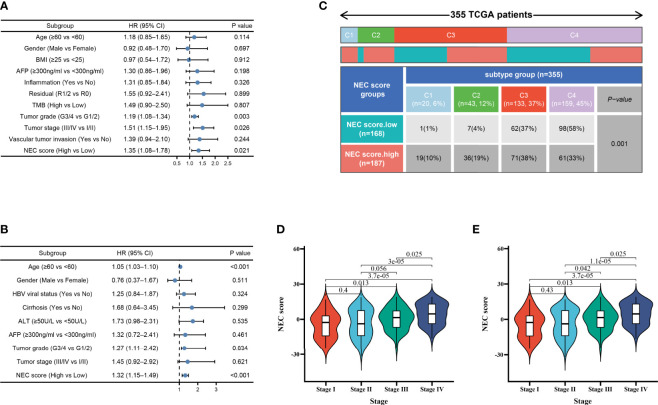
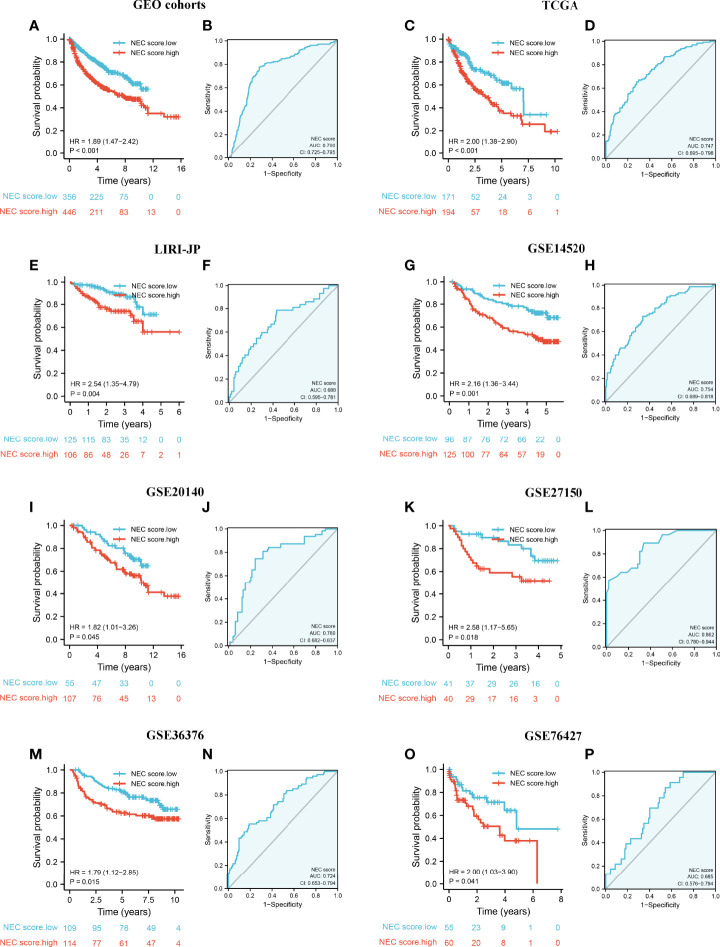
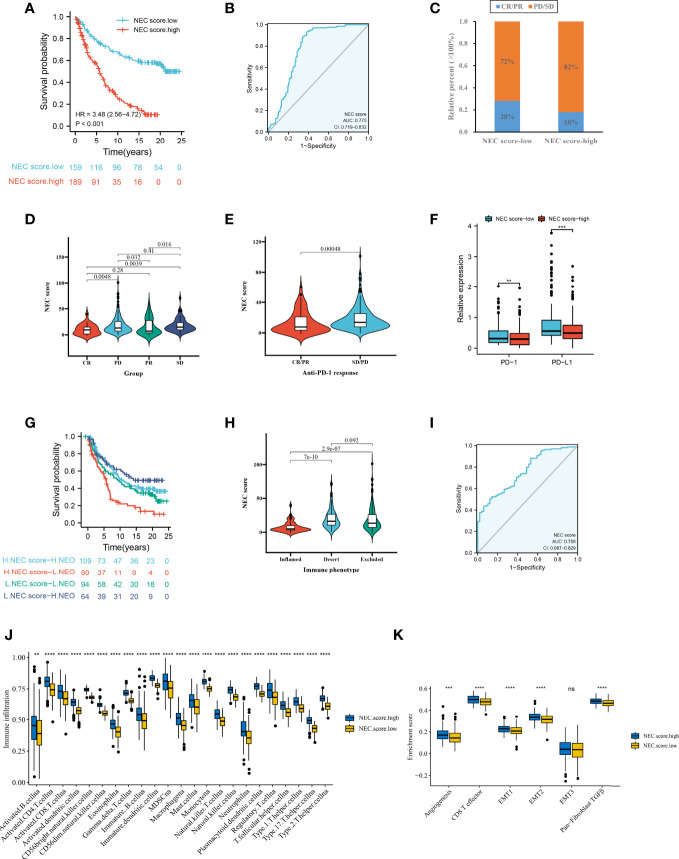
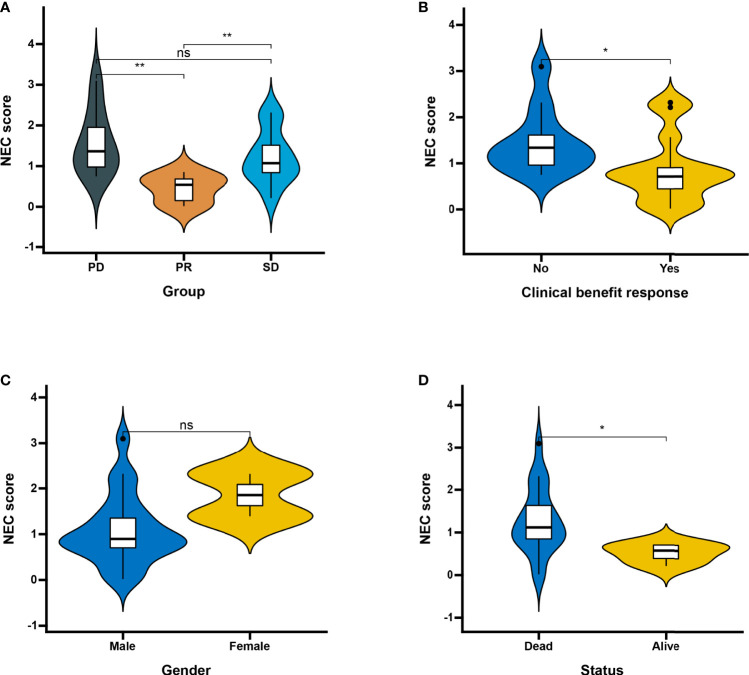
Results: We divided the samples into the high and low NEC score groups, and the high NEC score showed a poor prognosis. Simultaneously, NEC score is an effective and stable model and had a good performance in predicting the prognosis of HCC patients. A high NEC score was characterized by activation of the stroma and increased levels of immune infiltration. A high NEC score was also related to low expression of immune checkpoint molecules (PD-1/PD-L1). Importantly, the established NEC score would contribute to predicting the response to anti-PD-1/L1 immunotherapy.

Conclusions: Our study provide a comprehensive analysis of necroptosis-related genes in HCC. Stratification based on the NEC score may enable HCC patients to benefit more from immunotherapy and help identify new cancer treatment strategies.

Keywords: data mining; hepatocellular carcinoma; immunotherapy; necroptosis; tumor microenvironment.


Conflict of interest statement

The authors declare that the research was conducted in the absence of any commercial or financial relationships that could be construed as a potential conflict of interest.

Figures

Figure 1
Figure 1
Flow chart of the study.
Figure 2
Figure 2
Defining of the expression, prognostic, and genetic mutation landscape of necroptosis related genes in TCGA-LIHC cohort. (A) Venn diagram shown 15 differentially expressed necroptosis related genes that were correlated with OS. (B) The illustration shown the expression of 15 differentially expressed necroptosis related genes between paired normal (blue) and HCC (red) tissues (Student’s t test). The asterisks represented the statistical p-value (*P < 0.05; **P < 0.01; ***P < 0.001). (C) Forest plots shown the results of the univariate Cox regression between 15 differentially expressed necroptosis related genes and overall survival in HCC. (D) The mutation frequency of 15 necroptosis related genes in 365 patients with HCC from TCGA-LIHC cohort. Each column represented individual patients. The number on the left indicated the mutation frequency in each gene. (E) The CNV variation frequency of 15 necroptosis related genes in TCGA-LIHC cohort. The height of the column represented the alteration frequency. The blue dot represent loss frequency; The red dot represent gain frequency. (F) The location of CNV alteration of 15 necroptosis related genes on 23 chromosomes using TCGA-LIHC cohort. (G) The illustration shown the relationship between cancer related pathways and 15 necroptosis related genes. (H) The illustration shown the relationship between drug sensitivity and 15 necroptosis related genes in GDSC database.
Figure 3
Figure 3
Necroptosis subtypes and biological characteristics of two distinct subtypes of samples divided by consistent clustering. (A) Unsupervised consensus clustering for 1155 HCC patients in a meta cohort (TCGA-LIHC, LIRI-JP, GSE14520, GSE36376, and GSE76427). (B) Survival analyses for the two NEC.clusters based on 1155 patients with HCC from five cohorts (TCGA-LIHC, LIRI-JP, GSE14520, GSE36376, and GSE76427) including 615 cases in NEC.cluster.A (blue), and 540 cases in NEC.cluster.B (red). Kaplan-Meier curves with Log-rank p value < 0.001 showed a significant survival difference among two modification patterns. The NEC.cluster.A showed significantly better overall survival than the NEC.cluster.B. (C) The illustration shown the abundance of 23 immune infiltrating cell in NEC.cluster.A (blue) andNEC.cluster.B (yellow). The upper and lower ends of the boxes represented the interquartile range of values. The lines in the boxes represented median value, and black dots showed outliers (Student’s t test). The asterisks represented the statistical p-value (*P < 0.05; **P < 0.01; ***P < 0.001; ****P < 0.0001). (D) Differences in stroma-activated pathways including EMT, TGF beta, and angiogenesis pathways among two NEC clusters (Student’s t test). The asterisks represented the statistical p-value (*P < 0.05; **P < 0.01; ***P < 0.001; ****P < 0.0001). (E) GO enrichment analysis. (F) KEGG enrichment analysis. The illustration was used to visualize these biological processes, where red represented activated pathways and blue represented inhibited pathways.
Figure 4
Figure 4
Identification of DEGs and prognostic genes between the NEC patterns. (A) Unsupervised consensus clustering based on prognostic NEC-related differentially expressed genes to classify patients into two groups termed NEC.gene.cluster.A, NEC.gene.cluster.B. (B) Survival analyses for the two NEC.gene.clusters based on 1155 patients with HCC from five cohorts (TCGA-LIHC, LIRI-JP, GSE14520, GSE36376, and GSE76427) including 807 cases in NEC.gene.cluster.A (blue), and 348 cases in NEC.gene.cluster.B (yellow). Kaplan-Meier curves with Log-rank p value < 0.001 showed a significant survival difference among two NEC.gene.clusters. The NEC.gene.cluster.A showed significantly better overall survival than the NEC.cluster.B. (C) The illustration shown the abundance of 23 immune infiltrating cell in NEC.gene.cluster.A (blue) and NEC.gene.cluster.B (yellow). The upper and lower ends of the boxes represented the interquartile range of values. The lines in the boxes represented median value, and black dots showed outliers (Student’s t test). The asterisks represented the statistical p-value (*P < 0.05; **P < 0.01; ***P < 0.001; ****P < 0.0001). (D) The illustration shown the different between stroma-activated pathways including EMT, TGF beta, and angiogenesis pathways in NEC.gene.cluster.A (blue) and NEC.gene.cluster.B (yellow). The upper and lower ends of the boxes represented the interquartile range of values. The lines in the boxes represented median value, and black dots showed outliers (Student’s t test). The asterisks represented the statistical pvalue (*P < 0.05; **P < 0.01; ***P < 0.001; ****P < 0.0001). (E) The illustration shown the expression of 15 necroptosis related genes between NEC.gene.cluster.A (blue) and NEC.gene.cluster.B (yellow) (Student’s t test). The upper and lower ends of the boxes represented interquartile range of values. The lines in the boxes represented median value, and black dots showed outliers. The asterisks represented the statistical p-value (*P < 0.05; **P < 0.01; ***P < 0.001; ****P < 0.0001).
Figure 5
Figure 5
Construction of NEC score. (A) Differences in NEC score among two NEC.clusters in meta cohort (Student’s t test). (B) Differences in NEC score among two NEC.gene.clusters in meta cohort (Student’s t test). (C) Kaplan-Meier curves for high and low NEC score patient groups. (D) The predictive value of NEC score in meta cohort. (E) The abundance of each TME infiltrating cell in high and low NEC score groups (Student’s t test). The upper and lower ends of the boxes represented the interquartile range of values. (F) Differences in stroma-activated pathways including EMT, TGF beta, and angiogenesis pathways among high and low NEC score groups (Student’s t test). (G) GSEA GO identified high and low NEC score groups related signaling pathways in HCC. (H) GSEA KEGG identified high and low NEC score related signaling pathways in HCC.
Figure 6
Figure 6
Independent prognostic analysis of NEC score. (A) Multivariate Cox regression analysis for NEC score in TCGA cohort shown by the forest plot. (B) Multivariate Cox regression analysis for NEC score in GSE14520/NCI cohort shown by the forest plot. (C) Differences in NEC score between immune subtypes (C1: wound healing; C2: IFN-gamma dominant; C3: inflammatory; C4: lymphocyte depleted) (D) Differences in NEC score between different stage in TCGA cohort (Student’s t test). (E) Differences in NEC score between different stage in GSE14520/NCI cohort (Student’s t test).
Figure 7
Figure 7
External validation of NEC score model. (A) Kaplan-Meier curves for high and low NEC score patient groups in 5 GEO datasets (GSE14520/NCI, GSE36376, GSE76427, GSE20140, and GSE27150). (B) The predictive value of NEC score in 5 GEO dataset. (C) Kaplan-Meier curves for high and low NEC score patient groups in TCGA-LIHC. (D) The predictive value of NEC score in TCGA-LIHC. (E) Kaplan-Meier curves for high and low NEC score patient groups in LIRI-JP. (F) The predictive value of NEC score in LIRI-JP. (G) Kaplan-Meier curves for high and low NEC score patient groups in GSE14520/NCI. (H) The predictive value of NEC score in GSE14520/NCI. (I) Kaplan-Meier curves for high and low NEC score patient groups in GSE20140. (J) The predictive value of NEC score in GSE20140. (K) Kaplan-Meier curves for high and low NEC score patient groups in GSE27150. (L) The predictive value of NEC score in GSE27150. (M) Kaplan-Meier curves for high and low NEC score patient groups in GSE36376. (N) The predictive value of NEC score in GSE36376. (O) Kaplan-Meier curves for high and low NEC score patient groups in GSE76427. (P) The predictive value of NEC score in GSE76427.
Figure 8
Figure 8
NEC score in the role of anti-PD-1/L1 immunotherapy. (A) Survival analyses for low and high NEC score patient groups in the anti-PD-L1 immunotherapy cohort using Kaplan-Meier curves (IMvigor210 cohort). (B) The predictive value of NEC score in IMvigor210 cohort. (C) The proportion of patients with response to PD-L1 blockade immunotherapy in low or high NEC score groups. SD, stable disease; PD, progressive disease; CR, complete response; PR, partial response. (D) Differences in NEC score among distinct anti-PD-1 clinical response groups (Student’s t test). (E) Distribution of NEC score in distinct anti-PD-L1 clinical response groups (Student’s t test). (F) Differences in checkpoint expression between low and high NEC score groups (Student’s t test). The asterisks represented the statistical p-value (*P < 0.05; **P < 0.01; ***P < 0.001). (G) Survival analyses for patients receiving anti-PD-L1 immunotherapy stratified by both NEC score and neoantigen burden using Kaplan-Meier curves. (H) Differences in NEC score between immune subtypes (Student’s t test). (I) The predictive value of the quantification of NEC patterns in patients treated with anti-PD-1/L1 immunotherapy . (J) The abundance of each TME infiltrating cell in high and low NEC score groups (Student’s t test). (K) Differences in stromaactivated pathways and abundance of regulatory T cells (considered as immune suppression) between low and high NEC score groups in anti-PD-L1 immunotherpy cohort (Student’s t test).
Figure 9
Figure 9
Patient characteristics and NEC score of HCC treated with anti-PD-1 immmunotherapy. (A) Distribution of NEC score in distinct anti-PD-L1 clinical response groups. SD, stable disease; PD, progressive disease; PR, partial response (Student’s t test). The asterisks represented the statistical p-value (**P < 0.01). (B) Differences in NEC score between clinical response groups (Student’s t test). The asterisks represented the statistical p-value (*P < 0.05). (C) Differences in NEC score between gender groups (ns: not significant). (D) Differences in NEC score between status groups (Student’s t test). The asterisks represented the statistical p-value (*P < 0.05).
Figure 10
Figure 10
The expression of 15 necroptosis genes in HCC by IHC. (A) IHC staining of 15 necroptosis genes in HCC and normal tissues. (B) Statistic data of IHC analysis (N = 8). (*P < 0.05; **P < 0.01; ***P < 0.001).

Similar articles

Cited by

References

    1. Siegel RL, Miller KD, Fuchs HE, Jemal A. Cancer Statistic. CA Cancer J Clin (2021) 71(1):7–33. doi: 10.3322/caac.21654 - DOI - PubMed
    1. Yau T, Park JW, Finn RS, Cheng AL, Mathurin P, Edeline J, et al. . Nivolumab Versus Sorafenib in Advanced Hepatocellular Carcinoma (CheckMate 459): A Randomised, Multicentre, Open-Label, Phase 3 Trial. Lancet Oncol (2022) 23(1):77–90. doi: 10.1016/s1470-2045(21)00604-5 - DOI - PubMed
    1. Degterev A, Huang Z, Boyce M, Li Y, Jagtap P, Mizushima N, et al. . Chemical Inhibitor of Nonapoptotic Cell Death With Therapeutic Potential for Ischemic Brain Injury. Nat Chem Biol (2005) 1(2):112–9. doi: 10.1038/nchembio711 - DOI - PubMed
    1. Grootjans S, Vanden Berghe T, Vandenabeele P. Initiation and Execution Mechanisms of Necroptosis: An Overview. Cell Death Differ (2017) 24(7):1184–95. doi: 10.1038/cdd.2017.65 - DOI - PMC - PubMed
    1. Takemura R, Takaki H, Okada S, Shime H, Akazawa T, Oshiumi H, et al. . PolyI:C-Induced, TLR3/RIP3-Dependent Necroptosis Backs Up Immune Effector-Mediated Tumor Elimination In Vivo . Cancer Immunol Res (2015) 3(8):902–14. doi: 10.1158/2326-6066.Cir-14-0219 - DOI - PubMed