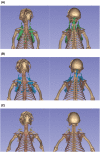
Xenon-enhanced computed tomography assessment of brown adipose tissue distribution and perfusion in lean, obese, and diabetic primates
- PMID: 35912825
- PMCID: PMC9420818
- DOI: 10.1002/oby.23519
Xenon-enhanced computed tomography assessment of brown adipose tissue distribution and perfusion in lean, obese, and diabetic primates
Abstract
Objective: This study aimed to validate xenon-enhanced computed tomography (XECT) for the detection of brown adipose tissue (BAT) and to use XECT to assess differences in BAT distribution and perfusion between lean, obese, and diabetic nonhuman primates (NHPs).
Methods: Whole-body XECT imaging was performed in anesthetized rhesus and vervet monkeys during adrenergic stimulation of BAT thermogenesis. In XECT images, BAT was identified as fat tissue that, during xenon inhalation, underwent significant radiodensity enhancement compared with subcutaneous fat. To measure BAT blood flow, BAT radiodensity enhancement was measured over time on the six computed tomography scans acquired during xenon inhalation. Postmortem immunohistochemical staining was used to confirm imaging findings.
Results: XECT was able to correctly identify all BAT depots that were confirmed at necropsy, enabling construction of the first comprehensive anatomical map of BAT in NHPs. A significant decrease in BAT perfusion was found in diabetic animals compared with obese animals and healthy animals, as well as absence of axillary BAT and significant reduction of supraclavicular BAT in diabetic animals compared with obese and lean animals.
Conclusions: The use of XECT in NHP models of obesity and diabetes allows the analysis of the impact of metabolic status on BAT mass and perfusion.
© 2022 The Authors. Obesity published by Wiley Periodicals LLC on behalf of The Obesity Society (TOS).
Conflict of interest statement
The authors declared no conflict of interest.
Figures


Similar articles
-
Ablation of FAM210A in Brown Adipocytes of Mice Exacerbates High-Fat Diet-Induced Metabolic Dysfunction.Diabetes. 2025 Mar 1;74(3):282-294. doi: 10.2337/db24-0294. Diabetes. 2025. PMID: 39602358
-
Physical exercise training interventions for children and young adults during and after treatment for childhood cancer.Cochrane Database Syst Rev. 2013 Apr 30;(4):CD008796. doi: 10.1002/14651858.CD008796.pub2. Cochrane Database Syst Rev. 2013. Update in: Cochrane Database Syst Rev. 2016 Mar 31;3:CD008796. doi: 10.1002/14651858.CD008796.pub3. PMID: 23633361 Updated.
-
Preexisting Diabetes and Pregnancy: An Endocrine Society and European Society of Endocrinology Joint Clinical Practice Guideline.Eur J Endocrinol. 2025 Jun 30;193(1):G1-G48. doi: 10.1093/ejendo/lvaf116. Eur J Endocrinol. 2025. PMID: 40652450
-
Supraglottic airway devices versus tracheal intubation for airway management during general anaesthesia in obese patients.Cochrane Database Syst Rev. 2013 Sep 9;2013(9):CD010105. doi: 10.1002/14651858.CD010105.pub2. Cochrane Database Syst Rev. 2013. PMID: 24014230 Free PMC article.
-
Regional cerebral blood flow single photon emission computed tomography for detection of Frontotemporal dementia in people with suspected dementia.Cochrane Database Syst Rev. 2015 Jun 23;2015(6):CD010896. doi: 10.1002/14651858.CD010896.pub2. Cochrane Database Syst Rev. 2015. PMID: 26102272 Free PMC article.
Cited by
-
Brief Communication: Histological Assessment of Nonhuman Primate Brown Adipose Tissue Highlights the Importance of Sympathetic Innervation.J Obes. 2023 Jan 19;2023:5651084. doi: 10.1155/2023/5651084. eCollection 2023. J Obes. 2023. PMID: 36714241 Free PMC article.
-
Absolute thermometry of human brown adipose tissue by magnetic resonance with laser polarized 129Xe.Commun Med (Lond). 2023 Oct 17;3(1):147. doi: 10.1038/s43856-023-00374-x. Commun Med (Lond). 2023. PMID: 37848608 Free PMC article.
-
Adipose tissue as a linchpin of organismal ageing.Nat Metab. 2024 May;6(5):793-807. doi: 10.1038/s42255-024-01046-3. Epub 2024 May 23. Nat Metab. 2024. PMID: 38783156 Free PMC article. Review.
-
In-vivo detection of white adipose tissue browning: a multimodality imaging approach.Sci Rep. 2023 Sep 19;13(1):15485. doi: 10.1038/s41598-023-42537-9. Sci Rep. 2023. PMID: 37726379 Free PMC article.
References
-
- Jastroch M, Wuertz S, Kloas W, Klingenspor M. Uncoupling protein 1 in fish uncovers an ancient evolutionary history of mammalian nonshivering thermogenesis. Physiol Genomics. 2005;22:150‐156. - PubMed
-
- Cannon B, Nedergaard J. The biochemistry of an inefficient tissue: brown adipose tissue. Essays Biochem. 1985;20:110‐164. - PubMed
-
- Cannon B, Nedergaard J. Brown adipose tissue: function and physiological significance. Physiol Rev. 2004;84:277‐359. - PubMed
-
- Krauss S, Zhang CY, Lowell BB. The mitochondrial uncoupling‐protein homologues. Nat Rev Mol Cell Biol. 2005;6:248‐261. - PubMed
Publication types
MeSH terms
Substances
Grants and funding
LinkOut - more resources
Full Text Sources
Medical

