Ex vivo reconstitution of fetal oocyte development in humans and cynomolgus monkeys
- PMID: 35912849
- PMCID: PMC9475534
- DOI: 10.15252/embj.2022110815
Ex vivo reconstitution of fetal oocyte development in humans and cynomolgus monkeys
Abstract
In vitro oogenesis is key to elucidating the mechanism of human female germ-cell development and its anomalies. Accordingly, pluripotent stem cells have been induced into primordial germ cell-like cells and into oogonia with epigenetic reprogramming, yet further reconstitutions remain a challenge. Here, we demonstrate ex vivo reconstitution of fetal oocyte development in both humans and cynomolgus monkeys (Macaca fascicularis). With an optimized culture of fetal ovary reaggregates over three months, human and monkey oogonia enter and complete the first meiotic prophase to differentiate into diplotene oocytes that form primordial follicles, the source for oogenesis in adults. The cytological and transcriptomic progressions of fetal oocyte development in vitro closely recapitulate those in vivo. A comparison of single-cell transcriptomes among humans, monkeys, and mice unravels primate-specific and conserved programs driving fetal oocyte development, the former including a distinct transcriptomic transformation upon oogonia-to-oocyte transition and the latter including two active X chromosomes with little X-chromosome upregulation. Our study provides a critical step forward for realizing human in vitro oogenesis and uncovers salient characteristics of fetal oocyte development in primates.
Keywords: ex vivo culture; fetal oocytes; humans; meiotic prophase; monkeys.
© 2022 The Authors.
Figures

- A
Scheme of female germ‐cell development in cynomolgus monkeys. Wpf, weeks post‐fertilization; PGCs, primordial germ cells.
- B
Gross appearances of developing cy ovaries at 8–18 wpf. Scale bar = 1 mm.
- C
Hematoxylin and eosin (H&E) staining of a cy fetal ovary at 8 wpf. Arrows indicate oogonia. M, mesonephros. Scale bars = 100 μm (top), 40 μm (bottom).
- D
H&E staining of the ovarian cortex in cy fetuses at 10–18 wpf. The ovarian cortex was divided into the outer and inner cortex at the line bisecting the ovarian cortex. Black arrows, oocytes bearing a large nucleus with condensed, thread‐like chromatin; white arrows, primordial follicles. Scale bar = 50 μm.
- E
Immunofluorescence (IF) analysis for oogonia (POU5F1 and TFAP2C), RA responsive (ZGLP1 and STRA8), meiotic (γH2AX and SYCP1), and oogenic (ZP3 and TP63) markers during cy fetal ovary development. Representative images for each marker are shown. Germ cells were marked with DDX4 (magenta). Nuclear DAPI staining is shown in white. The upper‐right magnified images of each panel show the expression of key markers (green) co‐stained with DDX4 (magenta). The lower‐right magnified images of each panel show DDX4 expression (magenta) co‐stained with DAPI (white). The numbers written in the upper‐left corner indicate the stage (wpf) of the fetus. Scale bar = 20 μm.
- F
Representative images of germ cells immunostained for SYCP3 (green), DMC1 (red), and DDX4 (magenta) at each meiotic substage. Nuclear DAPI staining is shown in white. The substages of meiosis were defined based on the staining patterns of SYCP3, DMC1, and DAPI as described in Materials and Methods. Scale bar = 10 μm.
- G
Percentages of germ cells at each meiotic substage as defined in Fig 1F. The average percentages in the outer or inner ovarian cortex on each meiotic substage were calculated from at least three fetal ovaries [8 wpf (n = 4), 10/12/14/16/18 wpf (n = 3)]. The color‐coding is as indicated.
- A
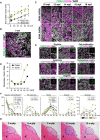
Size of developing cy fetuses and ovaries at 8–18 wpf [8/10/12/14/16/18 wpf (n = 26/3/3/5/4/3)]. Lines indicate LOESS curves fitted to the sample populations.
- B, C
IF of a cy fetal gonad at 8 wpf (B) and ovarian cortexes in cy fetuses at 10–18 wpf (C). The results of staining with FOXL2 (granulosa‐cell marker, green), DDX4 (germ‐cell marker, magenta), and DAPI (nucleus, white) are shown. The ovarian cortexes at 10–18 wpf were divided into an outer and inner cortex at the line bisecting the ovarian cortex. Scale bars = 40 μm (B) and 50 μm (C).
- D
The granulosa/germ cell ratios at each developmental stage assessed from the IF data are shown [8–18 wpf (n = 1)].
- E
IF for oogonia (NANOG and PDPN), cell proliferation (Ki67), apoptosis (cleaved PARP and cleaved CASPASE 3), extracellular matrix (LAMININ), and oogenic (FIGLA, NOBOX, and NLRP5) markers during cy fetal ovary development. Representative images for each marker are shown. Germ cells were marked with DDX4 (magenta). Nuclear DAPI staining is shown in white. The upper‐right magnified images of each panel show the expression of key markers (green) co‐stained with DDX4 (magenta) except for NLRP5. The lower‐right magnified images of each panel show DDX4 expression (magenta) co‐stained with DAPI (white). The numbers written in the upper‐left corner indicate the stage (wpf) of the fetus. Scale bar = 20 μm.
- F
Percentages of cells positive for individual markers among DDX4+ germ cells from the IF of the cy fetal ovarian outer/inner cortex at 8–18 wpf. The mean values from more than three biological replicates are shown [8 wpf (n = 4), 10/12/14/16/18 wpf (n = 3)].
- G
H&E staining of transplanted cy rOvaries at 3‐/6‐/9‐/12‐/15‐week post‐transplantation (w‐ptp). Dashed lines indicate the transplanted cy rOvaries beneath the kidney capsule of KSN/Slc mice. K, mouse kidney. Scale bar = 200 μm.
- A
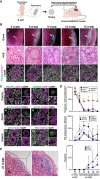
Scheme of the xenotransplantation experiment. The cy rOvaries generated from in vivo ovarian cells at 8 wpf were transplanted beneath the kidney capsule of immunodeficient KSN/Slc mice (see Materials and Methods).
- B
Gross appearances (a), H&E staining (b), and IF for FOXL2/DDX4/DAPI (c) of transplanted cy rOvaries at 3‐/6‐/9‐/12‐/15‐week posttransplantation (w‐ptp). The primordial follicle‐like complexes surrounded with FOXL2+ granulosa cells were observed inside the rOvaries at 12‐ and 15‐w ptp. Arrows indicate the rOvaries. FOXL2, granulosa cell marker; DDX4, germ cell marker. Scale bars = 1 mm (a), 40 μm (b and c).
- C
IF for oogonia (POU5F1 and TFAP2C), meiotic (SYCP3 and SYCP1), and oogenic (ZP3, TP63) markers in the transplanted cy rOvaries. Germ cells and nuclei were marked with DDX4 (magenta) and DAPI (white), respectively. The upper‐right magnified images of each panel show the expression of each marker (green) co‐stained with DDX4 (magenta). The lower‐right magnified images of each panel show DDX4 expression (magenta) co‐stained with DAPI (white). The numbers written in the upper‐left corner indicate weeks after transplantation (w‐ptp). Scale bar = 20 μm.
- D
Percentages of cells positive for individual markers among DDX4+ germ cells from the IF of cy rOvaries at 3–15 w‐ptp [3 w‐ptp (n = 3), 6/9/12 w‐ptp (n = 4), 15 w‐ptp (n = 6)]. The average values with SDs are shown.
- E
H&E staining of transplanted cy rOvaries at 21‐w ptp. Dashed lines indicate the transplanted cy rOvaries beneath the kidney capsule of KSN/Slc mice. K, mouse kidney. Scale bars = 200 μm (left) and 100 μm (right).
- A
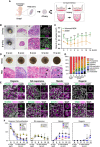
Scheme of the in vitro culture system for inducing cy ovarian follicles. The cy rOvaries generated from fetal gonadal cells at 8 wpf were cultured in either an air–liquid interface or a floating condition (see Materials and Methods).
- B
Gross appearance (a), H&E staining (b and c), and IF for FOXL2/DAZL/DAPI (d) of cy rOvaries cultured in the air–liquid interface condition at 3 and 6 weeks of in vitro culture (w‐ivc). FOXL2, granulosa‐cell marker; DAZL, germ‐cell marker; DAPI, nucleus. Scale bars = 200 μm (a), 100 μm (b), and 40 μm (c and d).
- C
Quantitative analysis for the size of cy rOvaries cultured in Advanced MEM or αMEM as the basal media of P‐IVD medium. The mean values from more than three biological replicates are shown with SDs except for the rOvary in αMEM at 15 w‐ivc [0/1/2/3/6/9/12/15 w‐ivc (αMEM, n = 26/23/14/23/20/9/4/1; Advanced MEM, n = 14/14/14/14/9/8/7/4)]. **P < 0.01, Welch's T‐test.
- D
Gross appearance (a) and H&E staining (b) images of cy rOvaries cultured with the P‐IVD medium at 3/6/9/12/15 w‐ivc. Arrowheads indicate primordial follicle‐like structures. Scale bars = 200 μm (a) and 40 μm (b).
- E
IF analyses of key markers as described in Fig 1E in the cultured cy rOvaries. Germ cells and nuclei were marked with DDX4 (magenta) and DAPI (white), respectively. The upper‐right magnified images of each panel show the expression of key markers (green) co‐stained with DDX4 (magenta). The lower‐right magnified images of each panel show DDX4 expression (magenta) co‐stained with DAPI (white). The numbers written in the upper‐left corner indicate the period of IVC (w‐ivc). Scale bar = 20 μm.
- F
Percentages of cells positive for individual markers among DDX4+ germ cells from the IF of cy rOvaries at 3–15 w‐ivc [3/6/9/12 w‐ivc (n = 3), 15 w‐ivc (n = 3 or 4)]. The average values with SDs are shown.
- G
Percentages of germ cells at each meiotic substage as defined in Fig 1F (see also Materials and Methods). The average percentages of each meiotic substage were determined from at least three cy rOvaries [3/6/9/12 w‐ivc (n = 3), 15 w‐ivc (n = 4)].
- A
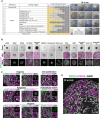
(Left) Summary table of coating conditions tested for cy rOvaries. (Right) Representative images of cy rOvaries cultured on membranes at 12 w‐ivc. Dotted circles show the edge of cy rOvaries at the starting point of air–liquid interface culture. Scale bar = 500 μm.
- B
Gross appearances (a), H&E staining (b), and IF for FOXL2/DDX4/DAPI (c) of cy rOvaries cultured in 13 different basal media at 6 w‐ivc. The rOvary cultured in Advanced MEM maintained its size, and DDX4+ germ and FOXL2+ granulosa cells were found within the rOvaries. Scale bars = 500 μm (a) and 40 μm (b and c).
- C
IF analyses of key markers as described in Fig EV1E in the cultured cy rOvaries. Germ cells and nuclei were marked with DDX4 (magenta) and DAPI (white), respectively. The upper‐right magnified images of each panel show the expression of key markers (green) co‐stained with DDX4 (magenta) except for NLRP5. The lower‐right magnified images of each panel show DDX4 expression (magenta) co‐stained with DAPI (white). The numbers written in the upper‐left corner indicate the period of IVC (w‐ivc). Scale bar = 20 μm.
- D
IF analysis for FOXL2 (granulosa cells)/DDX4 (germ cells) stained with DAPI (nucleus) in the cultured cy rOvary at 9 w‐ivc. Scale bar = 40 μm.
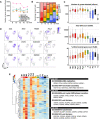
- A
The average number of genes detected in five major cell types in cy in vivo fetal ovaries at 8–18 wpf.
- B
Percentages of germ cells at the indicated meiotic prophase substages defined in Fig 4D. The color‐coding is as indicated. M, mitotic; PL, pre‐leptotene; L, leptotene; Z, zygotene; P, pachytene; D, diplotene.
- C
The detected gene number, UMI count, and percentage of mitochondrial genes in each germ‐cell cluster. The number of genes and UMI counts were significantly low in the “unclassified (U)” compared to any other germ‐cell cluster. **P < 0.01, Tukey–Kramer tests. In the boxplots, the central bands represent the median values; the lower/upper hinges represent the 25th/75th percentiles, respectively; the upper limits of the whiskers represent the largest values no further than 1.5 IQR (interquartile range) from the upper hinges; the lower limits of the whiskers represent the smallest values no further than 1.5 IQR from the lower hinges; the dots represent the outliers. The numbers of the cells used are 431/271/135/59/252/253/261/101/183/74/8/90 from 7 fetuses for M1/M2/M3/PL1/PL2/PL3/L/Z/P1/P2/D/U, respectively.
- D
Feature plots of key marker genes for oocyte development on the UMAP plot shown in Fig 4D.
- E
(Left) Heatmap of the standardized expression of HVGs listed in the gene cluster #2 in Fig 4H (Dataset EV3). Three gene clusters (Cluster #2–1/−2/−3) were defined according to the UHC dendrogram. (Right) Representative genes and key GO enrichments are shown.

- A–J
Analyses for cy germ cells by 10X scRNA‐seq. (A) Uniform manifold approximation and projection (UMAP) plot of cy fetal ovarian cells in vivo, colored by five computationally assigned major clusters based on the expression of cell‐type‐specific markers. The color‐coding is as indicated. (B) UMAP plot shown in Fig 4A, highlighting the cells for each fetal stage. (C) Feature plots for the expression of key marker genes for cy in vivo germ cells (DDX4), granulosa cells (WT1), stromal cells (TCF21), endothelial cells (PECAM1), and blood cells (TYROBP) overlaid on the UMAP plot in Fig 4A. (D) UMAP plot of cy in vivo germ cells shown with the clustering of meiotic substages. The color‐coding is as indicated. M, mitotic; PL, pre‐leptotene; L, leptotene; Z, zygotene; P, pachytene; D, diplotene; U, unclassified. (E) UMAP plot of cy in vivo germ cells colored by the fetal stage. The color‐coding is as indicated. (F) Feature plots for oogonia (POU5F1 and TFAP2C), RA‐responsive (ZGLP1 and STRA8), meiotic (SYCP3 and SYCP1), oogenic (ZP3), and germ‐cell (DDX4) markers during cy in vivo germ‐cell development. (G) UMAP plot of cy in vivo germ cells with the trajectory graph (red lines). Cells were colored by pseudotime. (H) (Left) Heatmap of the standardized expression of highly variable genes (HVGs, 1,481 genes) among in vivo cy germ‐cell clusters ordered by unsupervised hierarchical clustering (UHC); eight gene clusters were defined according to the UHC dendrogram. Key genes for female germ‐cell development are shown in black, and 10 genes transiently upregulated in the PL cluster are shown in orange. (Right) Representative genes and key gene ontology (GO) enrichments are shown. (I) Heatmap of the Pearson's correlation coefficients of the average expression levels of the 1,481 HVGs among the meiotic substages in cy in vivo germ cells. The asterisk indicates an unclassified cluster. The color‐coding is as indicated. (J) (a) UMAP plot for germ cells from cy in vivo fetal ovaries and in vitro cultured cy rOvaries, shown with the meiotic substages. The color‐coding is as indicated. (b) UMAP plot highlighting cells from in vitro cultured cy rOvaries at 12 and 15 w‐ivc. (c) UMAP plot with the trajectory graph (red lines). Cells were colored by pseudotime.
- K, L
Analyses for cy germ cells by SC3‐seq. (K) UHC for cy germ cells in vivo and in rOvaries with all expressed genes (19,747 genes) and a heatmap of the expression levels of selected markers that differentially label mitotic, RA‐responsive, meiotic, and oogenic cells. Color bars under the dendrogram show the in vivo stage (1st bar), the period of xenotransplantation (2nd bar), the period of IVC (3rd bar), and the cell type (4th bar). The heatmap color‐coding is as indicated. The color‐coding of bars is as indicated in Fig 4L. (L) Principal component analysis (PCA) of cy germ cells in vivo and in rOvaries performed by SC3‐seq. The cells were plotted in the two‐dimensional plane defined by PC1 and PC2 values. The color‐coding is as indicated.
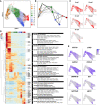
- A, B
UMAP plot with RNA velocity (A) and PAGA graph (B) of cy in vivo granulosa cells as defined in Fig 4A. Granulosa cells were divided into 12 subclusters by Louvain clustering. The color‐coding is as indicated.
- C
UMAP plot shown in Fig EV4A, highlighting the cells for each fetal stage.
- D
(Left) Heatmap of the standardized expression of HVGs (712 genes) among in vivo cy granulosa‐cell subclusters ordered by UHC; eight gene clusters were defined according to the UHC dendrogram. (Right) Representative genes and key GO enrichments are shown.
- E
Feature plots of key marker genes for cy granulosa‐cell development on the UMAP plot shown in Fig EV4A.
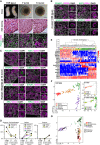
- A
Gross appearance (a), H&E staining (b), and IF (c) for FOXL2/DDX4/DAPI of the human in vivo female gonads (11 W, left column) and the cultured rOvaries at 7 and 14 w‐ivc. FOXL2, granulosa‐cell marker; DDX4, germ‐cell marker; DAPI, nucleus. Scale bars = 1 mm (a, left), 200 μm (a, middle/right), 50 μm (b), and 20 μm (c). g.a., gestational age.
- B, C
IF for oogonia (POU5F1), cell proliferation (Ki67), meiotic (SYCP3, DMC1, γH2AX, and SYCP1), and oogenic (ZP3 and TP63) markers for human in vivo female gonad (11 W, B) and human in vitro cultured rOvaries at 14 w‐ivc (C). Germ cells and nuclei were marked with DDX4 (magenta) and DAPI (white), respectively. The upper‐right magnified images of each panel show the expression of key markers (green) co‐stained with DDX4 (magenta). The lower‐right magnified images of each panel show DDX4 expression (magenta) co‐stained with DAPI (white). Scale bars = 20 μm.
- D
Percentages of cells positive for individual markers among DDX4+ germ cells from the IF of human in vivo female gonads (11 W) and human cultured rOvaries at 7 and 14 w‐ivc. The mean values from two biological replicates are shown.
- E, F
Analyses for human germ cells by SC3‐seq. (E) UHC for human germ cells in vivo and in rOvaries with all expressed genes (20,048 genes) and a heatmap of the expression levels of selected marker genes. Color bars under the dendrogram show the in vivo stage (1st bar), the period of IVC (2nd bar), and the cell type (3rd bar). The heatmap color‐coding is as indicated. The color coding in bars is as indicated in Fig 5F. (F) PCA of human germ cells in vivo and in rOvaries performed by SC3‐seq. The cells are plotted in the two‐dimensional plane defined by PC1 and PC2 values. The color‐coding is as indicated.
- G
PCA plot of all cy and human SC3‐seq data merged by canonical correlation analysis (CCA). Cell types were defined after CCA followed by Louvain clustering. The color and shape coding are as indicated.

- A–F
Analyses performed by 10X scRNA‐seq. (A) UMAP plot of germ cells from six 10X scRNA‐seq datasets (two for humans [this study and (Chitiashvili et al, 2020)], one for monkeys [this study], and three for mice [(Niu & Spradling, , Zhao et al, , Ge et al, 2021)]) integrated by CCA. Meiotic substages were defined after CCA followed by Louvain clustering. Colors indicate the computationally assigned meiotic substages defined by the expression levels of key meiotic markers conserved in all three species (see Materials and Methods). The color‐coding is as indicated. M, mitotic; PL, pre‐leptotene; L, leptotene; Z, zygotene; P, pachytene; D, diplotene. (B) The UMAP plot highlighting cells from each dataset. The color‐coding for each developmental stage is as indicated. (C) Percentages of germ cells belonging to each meiotic substage. The color‐coding for the germ‐cell stage is as indicated in Fig 6A. (D) Distribution of germ cells along the individually calculated species‐specific pseudotime trajectories (Monocle 3). The color‐coding for the germ‐cell stage is as indicated in Fig 6A. (E) Heatmap of the Pearson's correlation coefficients of the average expression levels of 237 HVGs (1–1–1 orthologues) among the meiotic substages in humans, monkeys, and mice (see Materials and Methods). The color‐coding for the germ‐cell stage is as indicated. (F) Heatmap of the standardized expression levels of selected genes using 10X scRNA‐seq data in all three species. Genes showing specific expression changes in humans and monkeys, but not in mice, during female germ‐cell development were manually selected from the list of DEGs acquired from the SC3‐seq analysis for cy/human in vitro cultured rOvaries (Dataset EV6). The heatmap color‐coding is as indicated. The color‐coding for the germ‐cell cluster is as indicated in Fig 6E.
- G, H
If analyses of PAX6 and CLGN with TFAP2C (oogonia marker) and DDX4 (germ‐cell marker) in cy in vivo fetal ovaries at 12 wpf (G) and human cultured rOvaries at 7 w‐ivc (H). Nuclear DAPI staining is shown in white. Scale bars = 20 μm.
- I
If analyses of CLGN with TP63 (oogenic marker) and DDX4 (germ‐cell marker) in a 13‐year‐old human oocyte of a primordial follicle. Nuclear DAPI staining is shown in white. Scale bar = 20 μm.
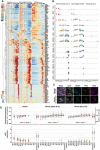
- A
Heatmap of the standardized expression levels of selected genes in all three species analyzed by 10X scRNA‐seq. Genes showing a conserved expression pattern in all three animal species during female germ‐cell development were manually selected from the list of DEGs acquired from the SC3‐seq analysis for cy/human in vitro cultured rOvaries (Dataset EV6). The color‐coding is as indicated.
- B
Box plots for the gene expression levels of selected markers showing primate‐specific expression dynamics during fetal germ‐cell development (see also Fig 6F). In the boxplots, the central bands represent the median values; the lower/upper hinges represent the 25th/75th percentiles, respectively; the upper limits of the whiskers represent the largest values no further than 1.5 IQR (interquartile range) from the upper hinges; the lower limits of the whiskers represent the smallest values no further than 1.5 IQR from the lower hinges; the dots represent the outliers. The numbers of the cells used are 0/606/0/117/133/76/6/72/68/2/12/14/45/16/47 from 4 fetuses for humans (Chitiashvili et al, 2020), 0/761/2/136/286/200/14/145/158/0/44/68/143/48/23 from 7 fetuses for cynomolgus monkeys (this study), and 26/261/21/232/259/149/209/450/422/134/232/163/339/630/298 for mice (Niu & Spradling, 2020) for M1/M2/M3/M4/PL1/PL2/PL3/L1/L2/L3/Z1/Z2/P1/P2/D, respectively. Cell clusters with more than two cells were analyzed.
- C
IF analyses of LEIOMODIN‐3 (LMOD3) with TP63 (oogenic marker) and DDX4 (germ‐cell marker) in cy in vivo fetal oocytes at 18 wpf (top) and 13‐year‐old human oocytes in primordial follicles (bottom). Nuclear DAPI staining is shown in white. Scale bar = 20 μm.
- D
The autosome:A and X:A ratios (top) and XIST/Xist expression transitions (bottom) during female germ‐cell development in vivo in humans (this study) and mice (Zhao et al, ; Ge et al, 2021) analyzed by 10X scRNA‐seq. In the boxplots, the central bands represent the median values; the lower/upper hinges represent the 25th/75th percentiles, respectively; the upper limits of the whiskers represent the largest values no further than 1.5 IQR (interquartile range) from the upper hinges; the lower limits of the whiskers represent the smallest values no further than 1.5 IQR from the lower hinges; the dots represent the outliers. The numbers of the cells used are 0/275/0/40/81/40/5/20/31/0/6/1/1/2/2/3164/520 cells from 1 fetus for humans (this study), 643/1991/369/1819/306/179/490/1505/2051/523/1733/2529/2069/2863/102/0/0 for mice (Zhao et al, 2020), and 66/605/85/547/298/167/330/463/467/144/320/196/137/17/0/14962/5416 for mice (Ge et al, 2021) for M1/M2/M3/M4/PL1/PL2/PL3/L1/L2/L3/Z1/Z2/P1/P2/D/granulosa/stroma, respectively. Cell clusters with more than two cells were analyzed.
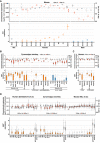
- A
The Chr.3:A and X:A ratios (top), and Xist expression (bottom) in mouse fetal/neonatal gonadal cells analyzed by bulk RNA‐seq. Dot, each datum; bar, mean. Samples at E9.5/10.5 include germ cells from male and female embryos (mix). E, embryonic day; P, postnatal day; Soma, gonadal somatic cells.
- B
The Chr.15:A and X:A ratios (top), and XIST expression (bottom) in cy female germ cells in vivo and in cultured/transplanted rOvaries analyzed by SC3‐seq. The Chr.15:A/X:A ratio transitions in the embryonic and hypoblast lineages reported in (Okamoto et al, 2021) are also shown. ESC, embryonic stem cell; ICM, inner cell mass; Pre_EPI, preimplantation epiblast; PostE_EPI, post‐implantation early epiblast; PostL_EPI, post‐implantation late epiblast; Gast, gastrulating cells; ePGC, early primordial germ cells. Data with small sample size (n ≦ 3) are indicated with dots (each datum) and bars (mean).
- C
The Chr.10:A and X:A ratios (top), and XIST expression (bottom) in human female germ cells in vivo and in cultured rOvaries analyzed by SC3‐seq.
- D
The autosome:A and X:A ratios (top), and XIST/Xist expression transitions (bottom) during female germ‐cell development in vivo in all three species analyzed by 10X scRNA‐seq.
Similar articles
-
Induction of fetal meiotic oocytes from embryonic stem cells in cynomolgus monkeys.EMBO J. 2023 May 2;42(9):e112962. doi: 10.15252/embj.2022112962. Epub 2023 Mar 16. EMBO J. 2023. PMID: 36929479 Free PMC article.
-
Key mechanisms and in vitro reconstitution of fetal oocyte development in mammals.Curr Opin Genet Dev. 2023 Oct;82:102091. doi: 10.1016/j.gde.2023.102091. Epub 2023 Aug 7. Curr Opin Genet Dev. 2023. PMID: 37556984 Review.
-
Establishment of oocyte population in the fetal ovary: primordial germ cell proliferation and oocyte programmed cell death.Reprod Biomed Online. 2005 Feb;10(2):182-91. doi: 10.1016/s1472-6483(10)60939-x. Reprod Biomed Online. 2005. PMID: 15823221 Review.
-
Arrest at the diplotene stage of meiotic prophase I is delayed by progesterone but is not required for primordial follicle formation in mice.Reprod Biol Endocrinol. 2016 Dec 5;14(1):82. doi: 10.1186/s12958-016-0218-1. Reprod Biol Endocrinol. 2016. PMID: 27919266 Free PMC article.
-
Human and non-human primate female in vitro gametogenesis toward meiotic entry: a systematic review.Fertil Steril. 2025 Jul;124(1):6-21. doi: 10.1016/j.fertnstert.2025.04.040. Epub 2025 May 5. Fertil Steril. 2025. PMID: 40334729
Cited by
-
Cell cycle regulation for meiosis in mammalian germ cells.J Reprod Dev. 2023 Jun 6;69(3):139-146. doi: 10.1262/jrd.2023-010. Epub 2023 Mar 17. J Reprod Dev. 2023. PMID: 36927827 Free PMC article. Review.
-
The spatiotemporal pattern of glypican coordinates primordial germ cell differentiation with ovary development.iScience. 2023 Dec 12;27(1):108710. doi: 10.1016/j.isci.2023.108710. eCollection 2024 Jan 19. iScience. 2023. PMID: 38205252 Free PMC article.
-
Induction of fetal meiotic oocytes from embryonic stem cells in cynomolgus monkeys.EMBO J. 2023 May 2;42(9):e112962. doi: 10.15252/embj.2022112962. Epub 2023 Mar 16. EMBO J. 2023. PMID: 36929479 Free PMC article.
-
The mitotic STAG3-cohesin complex shapes male germline nucleome.Nat Struct Mol Biol. 2025 Aug 25. doi: 10.1038/s41594-025-01647-w. Online ahead of print. Nat Struct Mol Biol. 2025. PMID: 40855131
-
Efficient derivation of embryonic stem cells and primordial germ cell-like cells in cattle.J Reprod Dev. 2024 Apr 4;70(2):82-95. doi: 10.1262/jrd.2023-087. Epub 2024 Feb 15. J Reprod Dev. 2024. PMID: 38355134 Free PMC article.
References
-
- Baker TG (1963) A quantitative and cytological study of germ cells in human ovaries. Proc R Soc Lond B Biol Sci 158: 417–433 - PubMed
-
- Baltus AE, Menke DB, Hu YC, Goodheart ML, Carpenter AE, de Rooij DG, Page DC (2006) In germ cells of mouse embryonic ovaries, the decision to enter meiosis precedes premeiotic DNA replication. Nat Genet 38: 1430–1434 - PubMed
-
- Bergen V, Lange M, Peidli S, Wolf FA, Theis FJ (2020) Generalizing RNA velocity to transient cell states through dynamical modeling. Nat Biotechnol 38: 1408–1414 - PubMed
-
- Bishop DK, Park D, Xu L, Kleckner N (1992) DMC1: A meiosis‐specific yeast homolog of E. coli recA required for recombination, synaptonemal complex formation, and cell cycle progression. Cell 69: 439–456 - PubMed
Publication types
MeSH terms
Associated data
- Actions
LinkOut - more resources
Full Text Sources
Other Literature Sources
Molecular Biology Databases

