. 2022 Aug 1;132(15):e157678.
doi: 10.1172/JCI157678.

Neuroprotection against ischemic stroke requires a specific class of early responder T cells in mice

Affiliations

Neuroprotection against ischemic stroke requires a specific class of early responder T cells in mice

Wei Cai et al. J Clin Invest. .

Abstract

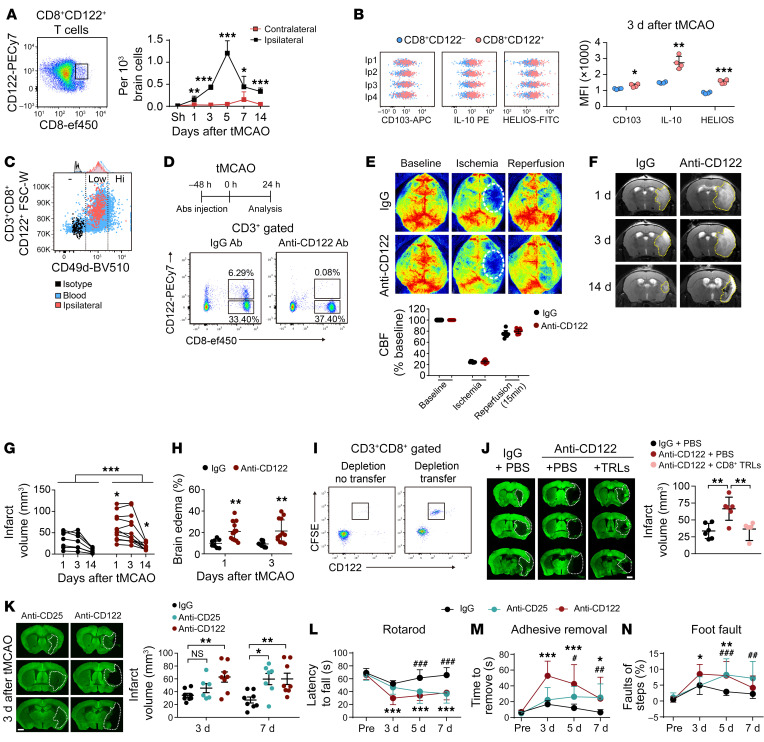
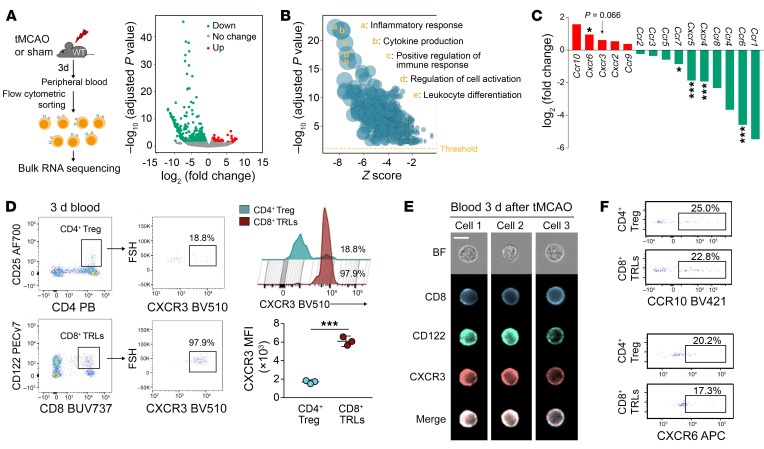
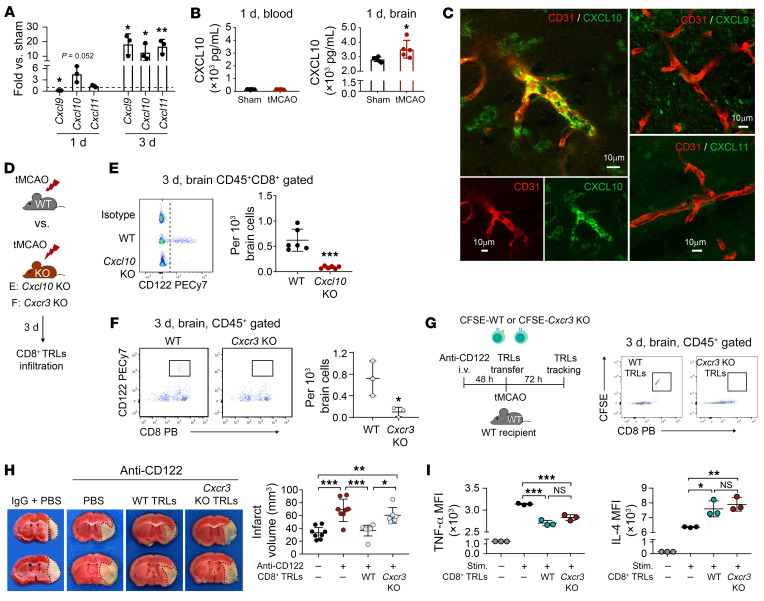
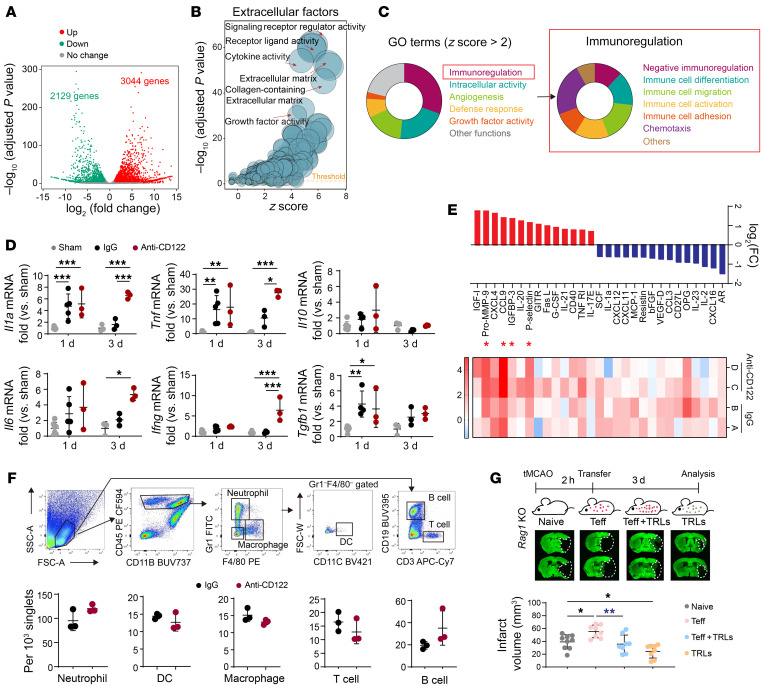
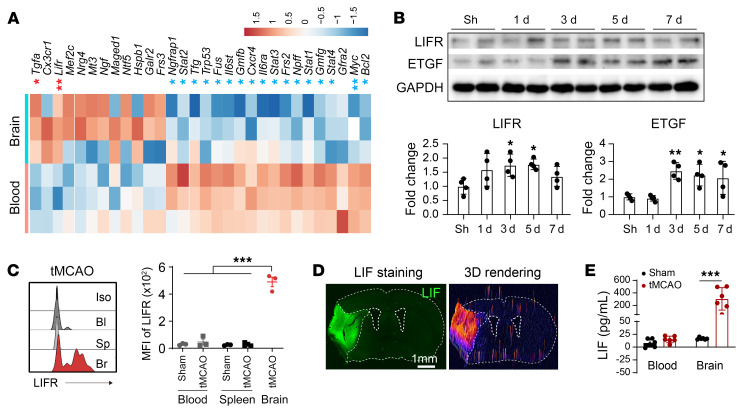
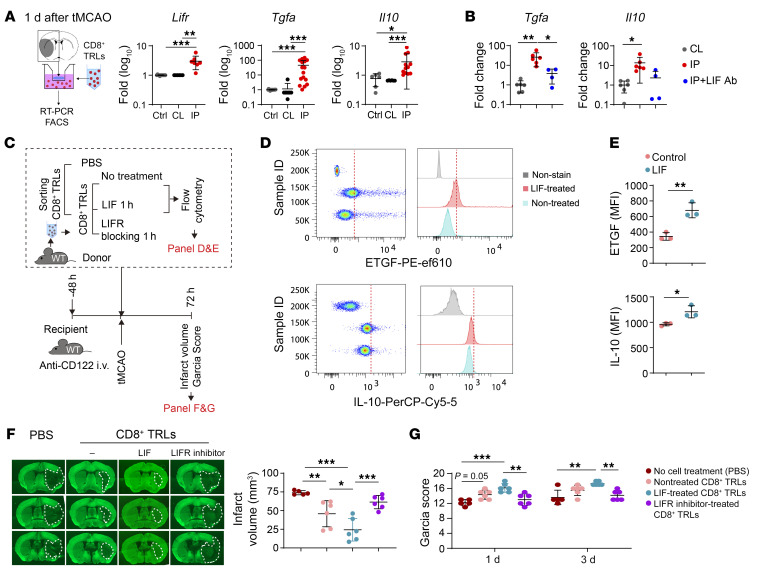
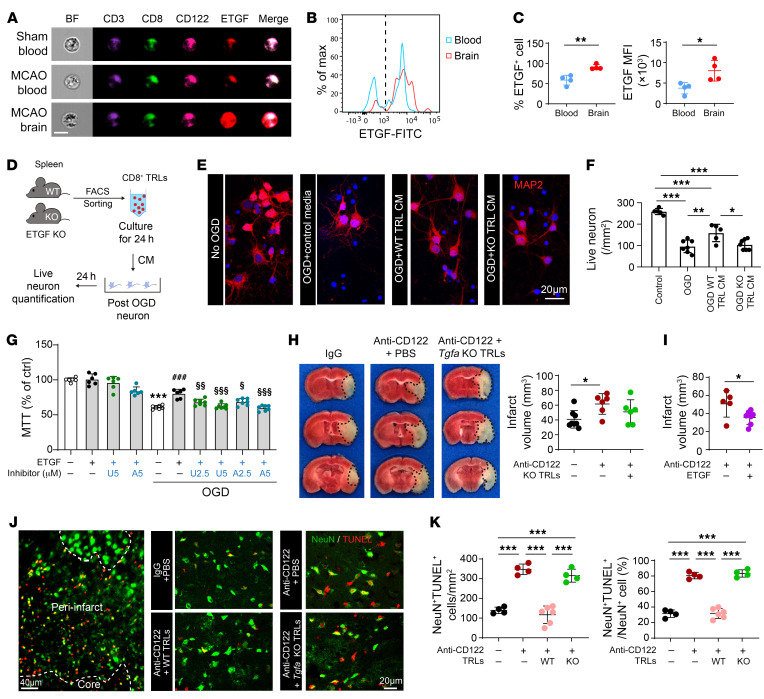
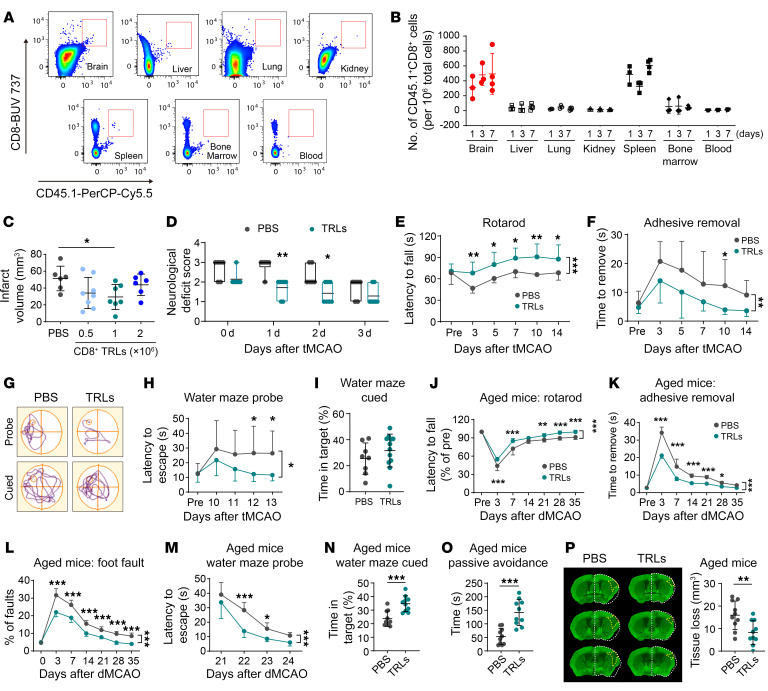
Immunomodulation holds therapeutic promise against brain injuries, but leveraging this approach requires a precise understanding of mechanisms. We report that CD8+CD122+CD49dlo T regulatory-like cells (CD8+ TRLs) are among the earliest lymphocytes to infiltrate mouse brains after ischemic stroke and temper inflammation; they also confer neuroprotection. TRL depletion worsened stroke outcomes, an effect reversed by CD8+ TRL reconstitution. The CXCR3/CXCL10 axis served as the brain-homing mechanism for CD8+ TRLs. Upon brain entry, CD8+ TRLs were reprogrammed to upregulate leukemia inhibitory factor (LIF) receptor, epidermal growth factor-like transforming growth factor (ETGF), and interleukin 10 (IL-10). LIF/LIF receptor interactions induced ETGF and IL-10 production in CD8+ TRLs. While IL-10 induction was important for the antiinflammatory effects of CD8+ TRLs, ETGF provided direct neuroprotection. Poststroke intravenous transfer of CD8+ TRLs reduced infarction, promoting long-term neurological recovery in young males or aged mice of both sexes. Thus, these unique CD8+ TRLs serve as early responders to rally defenses against stroke, offering fresh perspectives for clinical translation.

Keywords: Immunotherapy; Inflammation; Neuroscience; Stroke; T cells.


Figures

Figure 1
Figure 1. Early infiltration of CD8+ TRLs provides protection against cerebral ischemia.
(A) CD8+CD122+ T cell infiltration in the ipsilateral and contralateral brains at indicated time points after 60-minute tMCAO. n = 4–7/group. Two-tailed Student’s t test. (B) Expression of CD103, IL-10, and HELIOS in brain-infiltrating CD8+CD122+ T cells and CD8+CD122 T cells 3 days after tMCAO. n = 4/group. Two-tailed Student’s t test. (C) Most of the infiltrating CD8+CD122+ T cells are CD49dlo TRLs. (DH) Mice were treated with isotype IgG (100 μg) or anti-CD122 mAb (100 μg) 2 days prior to 60-minute tMCAO. n = 8–12/group. (D) Anti-CD122 mAb treatment depleted CD8+CD122+ T cells in blood 1 day after stroke. (E) Quantitative measurements of cortical CBF before MCAO (baseline), during MCAO, and 15 minutes after reperfusion. (F) Representative images of T2 MRI scans 1, 3, and 14 days after tMCAO. The yellow dotted lines depict the infarct areas. Quantification of brain infarcts (G) and brain edema (H). In G, black symbols indicate IgG treatment, red symbols indicate anti-CD122 treatment, and P = 0.06 for anti-CD122 versus IgG at 3 days after tMCAO. Two-way (E and H) or mixed-effects (G) repeated measures ANOVA and post hoc Bonferroni’s test. (I) FACS-isolated CD8+ TRLs were labeled with CFSE and adoptively transferred (1 million cells, i.v.) to recipient mice 48 hours after anti-CD122 mAb injection. CD8+CD122+CFSE+ cells were detected in blood 24 hours after cell transfer. (J) Adoptive transfer of CD8+ TRLs 2 hours after tMCAO reversed the detrimental effects of anti-CD122 mAb on brain infarction 3 days after tMCAO as shown by MAP2 staining. n = 6/group. One-way ANOVA and post hoc Dunnett’s test. Scale bar: 1 mm. (K) Quantification of infarct volumes 3 and 7 days after tMCAO in mice treated with IgG, anti-CD122 mAb, or anti-CD25 mAb (100 μg). n = 7–8/group. One-way ANOVA and post hoc Dunnett’s test. (LN) Sensorimotor function was analyzed with the rotarod test (L), adhesive removal test (M), and foot-fault test (N). n = 8–10/group. Two-way repeated measures ANOVA and post hoc Dunnett’s test. *P < 0.05, **P < 0.01, ***P < 0.001 for anti-CD122 vs. IgG. #P < 0.05, ##P < 0.01, ###P < 0.001 for anti-CD25 vs. IgG.
Figure 2
Figure 2. CXCR3 is upregulated in circulating CD8+ TRLs after stroke.
(A) CD8+ TRLs were sorted from mouse blood 3 days after tMCAO or sham operation for RNA-seq analysis. Red and green dots in the volcano plot represent transcripts expressed at higher or lower levels in stroke blood versus sham blood CD8+ TRLs, respectively (adjusted P < 0.05, |fold change| > 2). (B) Gene Ontology analysis of the differentially expressed genes (DEGs). (C) The expression of several chemokine receptors on CD8+ TRLs from stroke blood compared to sham blood. (D) Flow cytometric analysis of CXCR3+ cells among CD8+ TRLs and CD4+ Tregs in the blood 3 days after tMCAO. The mean fluorescence intensity (MFI) of CXCR3 among CD8+ TRLs and CD4+ Tregs in the ischemic brain was quantified. n = 3/group. Two-tailed Student’s t test. (E) Representative ImageStream images show expression of CXCR3, CD8, and CD122 in 3 blood cells collected 3 days after tMCAO. Scale bar: 10 μm. (F) Flow cytometric analysis of CCR10 and CXCR6 in CD8+ TRLs and CD4+ Tregs in blood 3 days after tMCAO. The plots represent 2 independent experiments. *P < 0.05; ***P < 0.001.
Figure 3
Figure 3. CXCR3/CXCL10-mediated brain infiltration is important for the neuroprotective effect of CD8+ TRLs.
(A) RT-qPCR of CXCR3 ligand (Cxcl9, Cxcl10, and Cxcl11) expression in brain 1 and 3 days after tMCAO versus sham. n = 3/group. Two-tailed Student’s t test. (B) Expression of CXCL10 was assessed in the blood (left) and in the ischemic brain (right) by ELISA 1 day after tMCAO. n = 5–6/group. Two-tailed Student’s t test. (C) Expression of CXCL10, CXCL11, and CXCL9 was assessed in the CD31+ endothelium of the ischemic brain 3 days after stroke. Scale bars: 10 μm. (DF) Sixty-minute tMCAO was induced in WT, Cxcl10-KO, or Cxcr3-KO mice (D). Brain infiltration by CD8+CD122+ TRLs was detected by flow cytometry in Cxcl10-KO (E, n = 6) or Cxcr3-KO (F, n = 3) mice 1 day after stroke. PB=pacific blue. Two-tailed Student’s t test. (G and H) CD8+ TRLs were sorted from the spleen of WT or Cxcr3–/– mice and labeled with CFSE (1 μM). Labeled cells were injected (1 × 10⁶/mouse, i.v.) into anti-CD122 mAb–pretreated mice at 2 hours after 60-minute tMCAO. (G) Flow cytometry showed reduced brain infiltration by Cxcr3–/– CFSE+CD8+ TRLs 3 days after stroke. The plots are representative of 3 animals in each group. (H) Infarct volumes 3 days after tMCAO. n = 6–8/group. One-way ANOVA and post hoc Bonferroni’s test. (I) The immunomodulatory effect of Cxcr3–/– CD8+ TRLs was intact compared with WT CD8+ TRLs. CD3+CD25CD122 Teffs were sorted from the spleen of healthy donor mice and cocultured in vitro with CFSE-labeled Cxcr3–/– or WT CD8+ TRLs. Cells were stimulated with PMA (80 nM) and ionomycin (1 μM) for 5 hours. The production of TNF-α and IL-4 in CFSECD3+ Teff cells was detected by flow cytometry. n = 3/group. One-way ANOVA and post hoc Bonferroni’s test. *P < 0.05; **P < 0.01; ***P < 0.001.
Figure 4
Figure 4. CD8+ TRLs confer neuroprotection after tMCAO through a combination of antiinflammatory and inflammation-independent mechanisms.
(AC) Single-cell suspensions were prepared from mouse blood and brain 3 days after sham or tMCAO. Sorted CD8+ TRLs were analyzed by RNA-seq. n = 2 in each group. (A) Volcano plot showing differentially expressed genes (DEGs) between brain-infiltrating TRLs and blood TRLs (adjusted P < 0.05, |fold change| > 2). (B) Gene Ontology (GO) analyses of DEGs encoding extracellular factors. (C) GO analyses showing the immunoregulatory function of brain-infiltrating CD8+ TRLs. (DF) Mice were treated with isotype IgG (100 μg) or anti-CD122 mAb (100 μg) 2 days prior to 60-minute tMCAO. (D) Quantitative RT-PCR analysis for Il1a, Tnf, Ifng, Il6, Il10, and Tgfb1 mRNA expression at 1 or 3 days after tMCAO. n = 3–7/group. Two-way ANOVA and post hoc Bonferroni’s test. (E) Protein array analysis 3 days after tMCAO. Heatmap and bar graphs demonstrating proteins with greater than 2-fold changes (red, upregulated; blue, downregulated) in anti-CD122–treated mice versus IgG-treated mice after stroke. n = 3–5/group. Red asterisks indicate proteins that were significantly upregulated with a false discovery rate (FDR) < 0.2. (F) Infiltration by Gr1+ neutrophils, CD11c+ DCs, F4/80+ macrophages, CD3+ T lymphocytes, and CD19+ B lymphocytes into the ischemic brain was quantified by flow cytometry 3 days after tMCAO. n = 3/group. Two-tailed Student’s t test. (G) CD3+CD122CD25 Teff cells (1 million) or PBS were transferred into Rag1–/– mice 2 hours after tMCAO, which was followed by i.v. infusion of PBS or CD8+ TRLs (0.5 million). Brain infarcts were quantified on MAP2-stained brain sections collected 3 days after tMCAO. n = 8–9/group. One-way ANOVA and post hoc Bonferroni’s test. *P < 0.05; **P < 0.01; ***P < 0.001.
Figure 5
Figure 5. LIFR and ETGF are upregulated in CD8+ TRLs after stroke.
(A) CD8+ TRLs from ischemic brain 3 days after tMCAO and from blood after sham operation were subjected to quantitative PCR array. The gene expression was normalized to the corresponding blood level. Heatmap showing the log2(fold change) for genes with >2-fold changes. n = 3/group. *FDR < 0.2, **FDR < 0.1 for genes upregulated (red) or downregulated (blue) in brain-infiltrating CD8+ TRLs. (B) Western blot analysis of LIFR and ETGF expression in the brain lysates collected from sham mice and 1, 3, 5, and 7 days after stroke. n = 4/group. One-way ANOVA and post hoc Dunnett’s test. (C) MFI of LIFR in CD8+CD122+ TRLs in the blood (Bl), spleen (Sp), and ipsilateral brains (Br) 3 days after tMCAO or sham operation. One-way ANOVA and post hoc Dunnett’s test. Iso, isotype control. (D) Immunostaining of LIF 3 days after stroke. Images are representative of 4 animals in each group. (E) Expression of LIF was assessed by ELISA 3 days after tMCAO. n = 6/group. One-way ANOVA and post hoc Bonferroni’s test. *P < 0.05; **P < 0.01; ***P < 0.001.
Figure 6
Figure 6. LIFR mediates the beneficial effects of CD8+ TRLs after stroke.
(A) Transwell coculture system of brain slices collected 1 day after stroke and CD8+ TRLs from healthy spleens. RT-PCR analysis of Lifr, Tgfa, and Il10 24 hours after coculture. Kruskal-Wallis test and post hoc Dunn’s test. n = 6–16/group. (B) Anti-LIF antibody (60 ng/mL) was added to the CD8+ TRL–brain slice coculture system (as in A). The expression of Tgfa and Il10 was measured by RT-PCR 24 hours after coculture. n = 4–6/group. One-way ANOVA and post hoc Bonferroni’s test. CL, contralateral brain; IP, ipsilateral brain. (CG) Spleen-derived CD8+ TRLs were pretreated with LIF (100 ng/mL), LIFR inhibitor (EC359, 100 nM), or PBS for 1 hour and then injected (i.v., 1 × 10⁶ cells) into recipient mice 2 hours after tMCAO. (D and E) LIF treatment enhanced ETGF and IL-10 expression in CD8+ TRLs. n = 3/group. Two-tailed Student’s t test. (F) Quantification of MAP2 staining and (G) Garcia score. n = 5–6/group. One-way ANOVA and post hoc Bonferroni’s test. *P < 0.05; **P < 0.01; ***P < 0.001.
Figure 7
Figure 7. ETGF is essential for CD8+ TRL–afforded direct neuroprotection.
(A) ImageStream shows expression of ETGF in CD3+CD8+CD122+ TRLs 3 days after stroke. Scale bar: 10 μm. (B and C) Quantification of the percentage of ETGF+ cells and the mean fluorescence intensity (MFI) of ETGF by flow cytometry 3 days after stroke. n = 4/group. Two-tailed Student’s t test. (DF) Conditioned media (CM) from CD8+ TRLs protected neurons against 90-minute oxygen-glucose deprivation (OGD). (D) Experimental design. (E) MAP2 (red) and DAPI (blue) staining. Scale bar: 20 μm. (F) Numbers of MAP2+ live cells were quantified. n = 5–7/group. One-way ANOVA and post hoc Bonferroni’s test. (G) ETGF (40 ng/mL) protected primary neurons against 90-minute OGD in an AKT- and ERK1/2-dependent manner. AKT inhibitor VIII (A) or ERK inhibitor U0126 (U) was added at indicated concentrations together with ETGF. Cell death was quantified by MTT assay 24 hours after OGD. n = 6–7/group. One-way ANOVA and post hoc Bonferroni’s test. ***P < 0.001 vs. non-OGD control. ###P < 0.001 vs. OGD. §P < 0.05, §§P < 0.01, §§§P < 0.001 vs. OGD + ETGF. (H) Mice were treated with anti-CD122 mAb (100 μg) 2 days prior to 60-minute tMCAO. CD8+ TRLs prepared from WT or Tgfa-KO mice were transferred (1 × 10⁶ cells, i.v.) into CD8+ TRL–depleted mice 2 hours after stroke. Infarct volumes were quantified by TTC staining 3 days after stroke. n = 6–8/group. One-way ANOVA and post hoc Bonferroni’s test. (I) ETGF (100 ng in 10 μL PBS) or an equal volume of PBS was injected intracerebroventricularly 5 minutes after reperfusion. Infarct volumes were quantified 3 days after tMCAO. n = 5–7/group. Two-tailed Student’s t test. (J) Representative images demonstrating TUNEL (red) colabeling with the neuronal marker NeuN (green) in peri-infarct areas. Scale bar: 20 μm. (K) Quantification of NeuN+TUNEL+ neurons and the percentages of NeuN+TUNEL+ neurons among all NeuN+ cells in the peri-infarct area. n = 4–6/group. One-way ANOVA and post hoc Bonferroni’s test. *P < 0.05; **P < 0.01, ***P < 0.001.
Figure 8
Figure 8. Adoptive transfer of CD8+ TRLs ameliorates brain infarction and improves long-term functional outcomes after stroke.
CD8+ TRLs were isolated by FACS from the spleens of healthy young mice. (AI) Young male stroke mice were treated intravenously with CD8+ TRLs or PBS 2 hours after tMCAO. (A) Flow cytometry to detect adoptively transferred CD45.1+CD8+ TRLs in CD45.2 congenic mice. (B) Quantification of CD45.1+CD8+ TRLs in various tissues 1, 3, and 7 days after tMCAO. n = 3–4/group. (C) Quantification of MAP2 staining 3 days after tMCAO in 0, 0.5 × 10⁶, 1 × 10⁶, or 2 × 10⁶ CD8+ TRL–treated mice. n = 6–8/group. (D) Neurological deficit score. n = 6–7/group. Sensorimotor dysfunction was assessed by the rotarod (E) and adhesive removal (F) tests up to 14 days after tMCAO. n = 8–12/group. (GI) Morris water maze 10–14 days after tMCAO. (G) Representative swim paths. (H) Time needed to reach the hidden platform (probe phase). (I) Time spent in the quadrant where the platform had previously been placed was measured 14 days after tMCAO (cued phase). n = 8–12/group. (JP) Aged (20-month-old) male mice were treated intravenously with 1 × 10⁶ FACS-isolated CD8+ TRLs or PBS 24 hours after distal MCAO (dMCAO). n = 10/group. Sensorimotor dysfunction was assessed by the rotarod (J), adhesive removal (K), and foot-fault tests (L) up to 35 days after dMCAO. (M and N) The Morris water maze test at 21–25 days after dMCAO. (O) Nonspatial memory was assessed 35 days after dMCAO using the passive avoidance test. Latency until entry into the dark room from the light room was recorded. (P) Quantification of MAP2 staining 35 days after dMCAO. The areas of contralesional hemisphere are reflected on the ipsilesional hemisphere (dashed white outlines). Yellow dashed line indicates the areas of tissue loss. *P < 0.05; **P < 0.01; ***P < 0.001. Two-tailed Student’s t test (I and NP), Mann-Whitney test (D), 1-way (C) or 2-way ANOVA (E, F, H, and JM) and post hoc Bonferroni’s test.

Comment in

References

    1. An C, et al. Molecular dialogs between the ischemic brain and the peripheral immune system: dualistic roles in injury and repair. Prog Neurobiol. 2014;115:6–24. doi: 10.1016/j.pneurobio.2013.12.002. - DOI - PMC - PubMed
    1. Liesz A, et al. Regulatory T cells are key cerebroprotective immunomodulators in acute experimental stroke. Nat Med. 2009;15(2):192–199. doi: 10.1038/nm.1927. - DOI - PubMed
    1. Li P, et al. Adoptive regulatory T-cell therapy protects against cerebral ischemia. Ann Neurol. 2013;74(3):458–471. doi: 10.1002/ana.23815. - DOI - PMC - PubMed
    1. Ren X, et al. Regulatory B cells limit CNS inflammation and neurologic deficits in murine experimental stroke. J Neurosci. 2011;31(23):8556–8563. doi: 10.1523/JNEUROSCI.1623-11.2011. - DOI - PMC - PubMed
    1. Shi L, et al. Treg cell-derived osteopontin promotes microglia-mediated white matter repair after ischemic stroke. Immunity. 2021;54(7):1527–1542. doi: 10.1016/j.immuni.2021.04.022. - DOI - PMC - PubMed

Publication types