

Dipeptidyl peptidase 9 triggers BRCA2 degradation and promotes DNA damage repair
- PMID: 35912982
- PMCID: PMC9535758
- DOI: 10.15252/embr.202154136
Dipeptidyl peptidase 9 triggers BRCA2 degradation and promotes DNA damage repair
Abstract
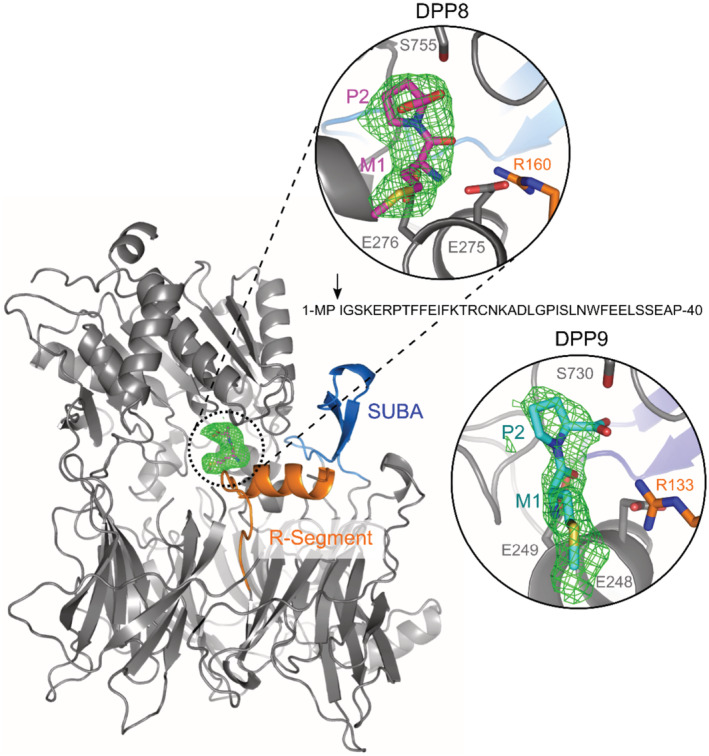
N-terminal sequences are important sites for post-translational modifications that alter protein localization, activity, and stability. Dipeptidyl peptidase 9 (DPP9) is a serine aminopeptidase with the rare ability to cleave off N-terminal dipeptides with imino acid proline in the second position. Here, we identify the tumor-suppressor BRCA2 as a DPP9 substrate and show this interaction to be induced by DNA damage. We present crystallographic structures documenting intracrystalline enzymatic activity of DPP9, with the N-terminal Met1-Pro2 of a BRCA21-40 peptide captured in its active site. Intriguingly, DPP9-depleted cells are hypersensitive to genotoxic agents and are impaired in the repair of DNA double-strand breaks by homologous recombination. Mechanistically, DPP9 targets BRCA2 for degradation and promotes the formation of RAD51 foci, the downstream function of BRCA2. N-terminal truncation mutants of BRCA2 that mimic a DPP9 product phenocopy reduced BRCA2 stability and rescue RAD51 foci formation in DPP9-deficient cells. Taken together, we present DPP9 as a regulator of BRCA2 stability and propose that by fine-tuning the cellular concentrations of BRCA2, DPP9 alters the BRCA2 interactome, providing a possible explanation for DPP9's role in cancer.
Keywords: BRCA2; DNA repair; DPP9; N-degron; proteolysis.
© 2022 The Authors. Published under the terms of the CC BY NC ND 4.0 license.
Figures
- A
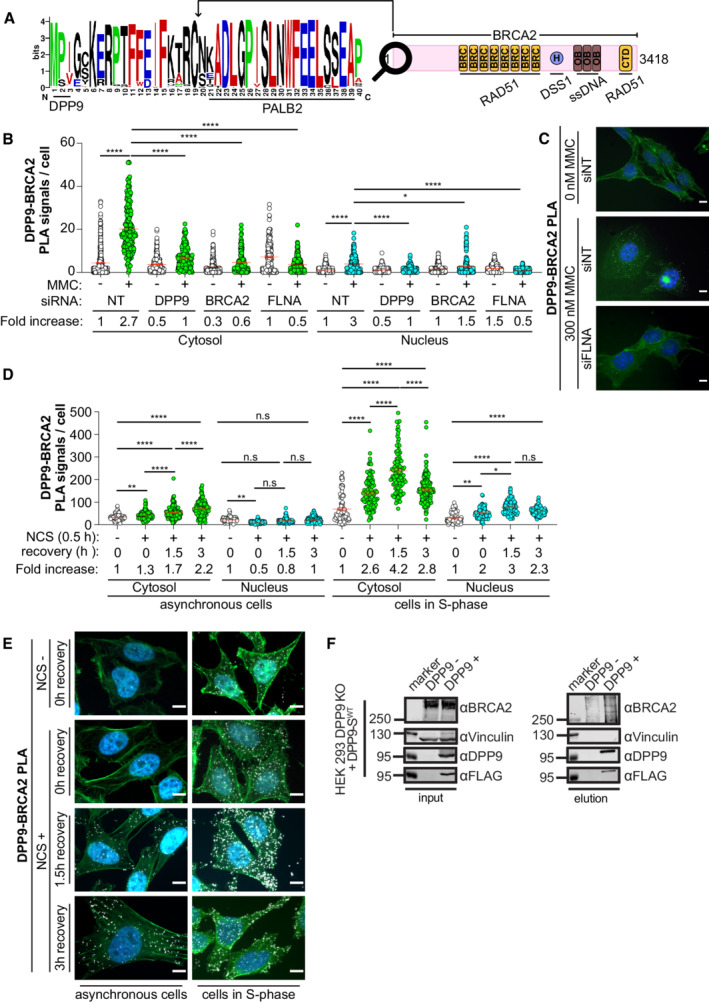
Sequence alignment of BRCA2 homologs from 108 placental mammals (Logo plot) shows conservation of the cleavage site for DPP9 at the BRCA2 N‐terminus. The cartoon depicts the full‐length BRCA2 and its conserved domains with the corresponding interaction partners.
- B
Quantification of PLAs between BRCA2 and DPP9 in control HeLa WT cells treated with nontargeting siRNA (siNT) or silenced with the indicated oligos. 300 ng/ml MMC was added for 24 h. Each dot represents the number of PLA events in a single cell, from two to seven biological replicates (siNT‐MMC (n = 6), siNT+MMC (n = 7), siDPP9‐MMC (n = 4), siDPP9+MMC (n = 5), siBRCA2‐MMC (n = 2), siBRCA2+MMC (n = 3), siFLNA‐MMC (n = 5), siFLNA+MMC (n = 6), NgtCntrl‐MMC (n = 3), NgtCntrl+MMC (n = 6)). The number of foci are shown based on their cellular localisation. Data were analyzed by a two‐way ANOVA, with the Tukey's multiple comparison test. Shown are mean ± SEM (*P ≤ 0.05, ****P ≤ 0.0001).
- C
Representative PLA images showing close proximity between endogenous DPP9 and endogenous BRCA2 in HeLa WT cells. Exposure of cells to MMC triggers more PLA events (white). Phalloidin (green) stains actin filaments and DAPI (blue) stains the nucleus. Scale bar 10 μm. Anti‐BRCA2: RRID:AB_2259370, anti‐DPP9: RRID:AB_2889071 (these images, along with the corresponding controls can be found in Appendix Fig S1A and B).
- D
Quantification of PLAs between BRCA2 and DPP9 in asynchronous HeLa WT cells or in cells in S‐Phase. Each dot represents the number of PLA events in a single cell, from three biological replicates. Cells were synchronized with a double thymidine block and released for 3 h before the addition of NCS (250 ng / mL for 30 min). Cells were sampled prior to NCS treatment, after NCS treatment, and with 1.5 and 3 h of recovery after NCS treatment. The number of foci is shown based on their cellular localisation. Data were analyzed by a two‐way ANOVA, with the Tukey's multiple comparison test. Shown are mean ± SEM (*P ≤ 0.05, **P ≤ 0.01, ****P ≤ 0.0001).
- E
Representative PLA images showing close proximity between endogenous DPP9 and endogenous BRCA2 in HeLa cells. Exposure of cells to NCS triggers more PLA events (white), which increase in time. Cells in S‐Phase show a greater fold increase in the number of PLA events in comparison with asynchronous cells. Phalloidin (green) stains actin filaments and DAPI (blue) stains the nucleus. Scale bar 10 μm. Antibodies as in (C).
- F
Co‐immunoprecipitation assays showing binding of BRCA2 and DPP9‐SWT. HEK293 DPP9 KO+DPP9WT cells, were treated with 1 μg/ml Dox (24 h) to induce the expression of DPP9‐FLAG. DNA damage was induced with 300 nM MMC treatment for 24 h. Control cells do not express DPP9 (− Dox). Bound proteins were eluted with a FLAG peptide and analyzed by western blotting (anti‐BRCA2: RRID:AB_2259370, anti‐DPP9: RRID:AB_731947, anti‐FLAG RRID:AB_262044).
- A
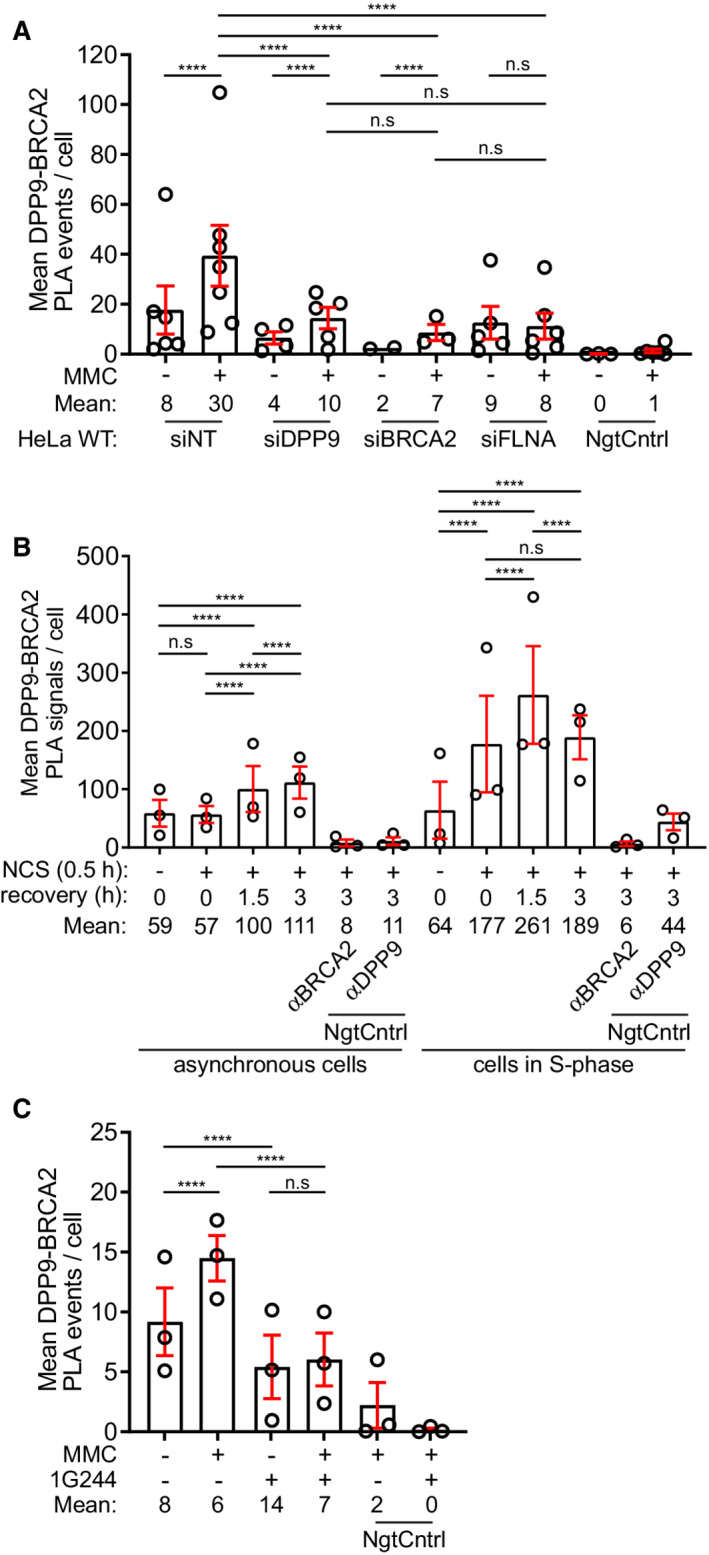
Summary of PLAs between BRCA2 and DPP9 in control HeLa WT cells treated with nontargeting siRNA (siNT) or silenced with the indicated oligos (Fig 1B). Each dot represents the mean number of PLA events in a single repetition, from two to seven biological replicates. More than 100 cells were quantified per condition in each experiment. Data from the summary of all PLA events per cell were analyzed by a two‐way ANOVA, with the Tukey's multiple comparison test. Shown are mean ± SEM (***P ≤ 0.001, ****P ≤ 0.0001).
- B
Summary of PLAs between BRCA2 and DPP9 in asynchronous HeLa WT cells and HeLa WT cells synchronized to S‐phase. DNA damage was induced by NCS (250 ng/ml for 30 min). Each dot represents the mean number of PLA events in a single repetition. More than 100 cells were quantified per condition in each experiment, from three biological replicates. Data from the summary of all PLA events per cell were analyzed by a two‐way ANOVA, with the Tukey's multiple comparison test. Shown are mean ± SEM (****P ≤ 0.0001).
- C
Summary of PLAs between BRCA2 and DPP9 in HeLa WT cells treated with 1G244 (Fig 2C). DNA damage was induced by MMC (300 ng/ml for 24 h). Each dot represents the mean number of PLA events in a single repetition, from three biological replicates. More than 100 cells were quantified per condition in each experiment. Data from the summary of all PLA events per cell were analyzed by a two‐way ANOVA, with the Tukey's multiple comparison test. Shown are mean ± SEM (****P ≤ 0.0001).
- A
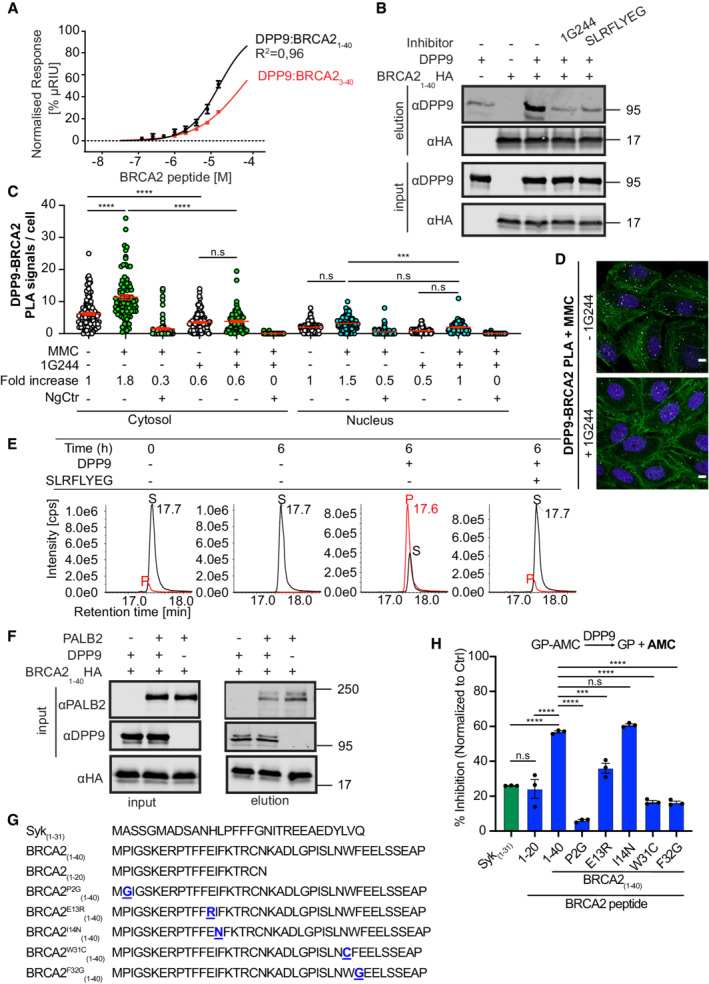
Surface Plasmon Resonance (SPR) data showing a direct interaction of purified DPP9 with a BRCA21‐40 peptide and a truncated BRCA23‐40 peptide, which lacks the N‐terminal dipeptide Met‐Pro. A serial dilution of BRCA2‐derived peptides was injected over a surface covered with DPP9. Equilibrium binding isotherms obtained for interactions measured between DPP9 and BRCA21‐40 (black line) and BRCA23‐40 (red line). Data were fitted to a sigmoidal dose–response curve fit. Mean ± SEM of technical triplicates of a representative experiment out of 3.
- B
Pull‐down assay showing direct binding of purified recombinant DPP9 to a BRCA2 N‐terminal1‐40 fragment immobilized on HA beads. The DPP9 inhibitors 1G244 or SLRFLYEG compete with BRCA21‐40HA for interaction with DPP9. Representative data of three technical replicates are shown. Anti‐HA: RRID:AB_2565334, anti‐DPP9: RRID:AB_2889071.
- C
Quantification of PLAs showing fewer MMC‐induced DPP9‐BRCA2 PLA events in HeLa cells treated with 10 μM 1G244. Each dot represents the number of PLA events in a single cell, from three biological replicates. The number of foci is shown based on their cellular localisation. Data were analyzed by a two‐way ANOVA, with the Tukey's multiple comparison test. Shown are mean ± SEM (***P ≤ 0.001, ****P ≤ 0.0001).
- D
Representative images of DPP9‐BRCA2 PLA in the presence of 1G244—a competitive inhibitor of DPP9. Control cells were mock treated with DMSO. Phalloidin (green) stains actin filaments and DAPI (blue) stains the nucleus. Scale bar 10 μm. Anti‐BRCA2: RRID:AB_2259370, anti‐DPP9: RRID:AB_2889071 (these images, along with the corresponding controls can be found in Appendix Fig S1C).
- E
In vitro processing of BRCA21‐40 synthetic peptide by purified recombinant DPP9. Samples were analyzed by high‐resolution liquid chromatography/tandem mass spectrometry, in quadruplicate. The panels show extracted MS1 ion chromatograms for both substrate BRCA21‐40 peptide (MPIGSKERPT…) (labeled S, [M+5H]5+ m/z 917.8637; retention time 17.7 min) and product BRCA23‐40 peptide (IGSKERPT…) (labeled P, [M+5H]5+ m/z 872.2451; retention time 17.6 min). The identity of the product peak was established both by accurate mass measurement to within 5 ppm and by product ion spectra.
- F
Pull‐down assay showing a competition between DPP9 and PALB2 for binding to the BRCA2 N‐terminus. While each protein can bind to the BRCA2 N‐terminal peptide, in the presence of DPP9, the PALB2‐BRCA2 binding is negatively affected. Representative data of three technical replicates are shown. Anti‐PALB2: RRID:AB_890607, anti‐HA: RRID:AB_2565334, anti‐DPP9: RRID:AB_2889071.
- G
Peptide sequences used in the DPP9 competition assays shown in (H).
- H
DPP9 activity assays showing different competitive effects of BRCA2 peptides (G), hydrolysis of GP‐AMC is used as read out. Shown is % of inhibition in GP‐AMC processing normalized to the control reactions (DPP9 without competing peptides). Syk1‐31 was used as a positive control. n = 3 independent experiments. Data were analyzed by a one‐way ANOVA, with the Tukey's multiple comparison test. Shown are mean ± SEM (***P ≤ 0.001, ****P ≤ 0.0001).
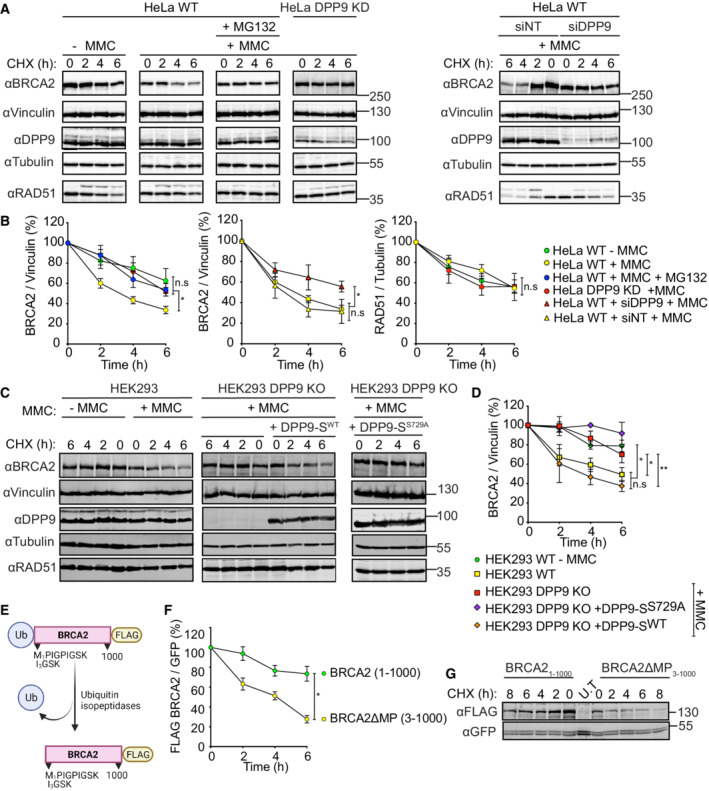
- A, B
Representative western blots and accompanying graph from more than three biological replicates show that MMC (300 nM, 24 h) induces a rapid turnover of endogenous BRCA2 in HeLa WT cells, which is less pronounced in HeLa WT cells treated with the proteasome inhibitor MG132 (100 μM), in HeLa DPP9 KD cells and in cells transiently silenced for DPP9 (siDPP9). RAD51 stability is not altered in HeLa DPP9 KD cells. Vinculin is a loading control for BRCA2, Tubulin is a loading control for RAD51. Shown images originate from one representative cycloheximide (CHX) chase assay. The ratios of BRCA2 to Vinculin and RAD51 to Tubulin are defined as 100% at time 0 h. Mean ± SEM, data were analyzed by a paired two‐tailed t‐test. (*P ≤ 0.03). Anti‐BRCA2: RRID:AB_2259370, anti‐DPP9: RRID:AB_731947, anti‐Vinculin: RRID:AB_477629, anti‐Tubulin: RRID:AB_628412, anti‐RAD51: RRID:AB_1142428.
- C, D
Representative western blots and graph summarizing results of more than three biological replicates. CHX chase assays show that the MMC‐induced degradation of BRCA2 is less pronounced in HEK293 DPP9 KO cells and in HEK293 DPP9 KO+DPP9‐SS729A cells overexpressing an inactive DPP9‐S mutant. Expression of DPP9 was induced (+ Dox, 1 μg/ml) simultaneously with MMC (300 nM), 24 h. Cells that were overexpressing the active variant (DPP9‐SWT) show similar levels of MMC‐induced BRCA2 degradation. RAD51 stability is not altered by MMC and is similar in all cell lines. Vinculin is a loading control for BRCA2, Tubulin is a loading control for RAD51. Shown images originate from one representative cycloheximide (CHX) chase assay. The ratios of BRCA2 to Vinculin are defined as 100% at time 0 h. Mean ± SEM, data were analyzed by a paired two‐tailed t‐test (*P ≤ 0.03, **P ≤ 0.002). Antibodies as described in (A‐B).
- E
Graphical presentation of the plasmid used for the production of the N‐terminal‐truncated mutant BRCA2ΔMP3‐1000 that was transfected in H‐I. The BRCA21‐1000 insert was cloned in a similar manner. Both constructs were tagged with a C‐terminal FLAG. The ubiquitin moiety is removed in cells by endogenous ubiquitin isopeptidases.
- F, G
Representative western blots and graphs summarizing CHX assays from three biological replicates show that the BRCA2ΔMP3‐1000 truncation mutant is degraded at a higher rate compared with the untruncated BRCA21‐1000. Cells were co‐transfected with a GFP expressing plasmid, as transfection and loading control. Control cells were transfected with GFP only (U.T). Image originates from one representative experiment. BRCA2‐FLAG signals are related to the transfection and loading control GFP. BRCA2 levels in relation to GFP were defined as 100% at time 0 h. Mean ± SEM, data were analyzed by a paired two‐tailed t‐test (*P ≤ 0.03). Anti‐FLAG: RRID:AB_262044, anti‐GFP: RRID:AB_641123.
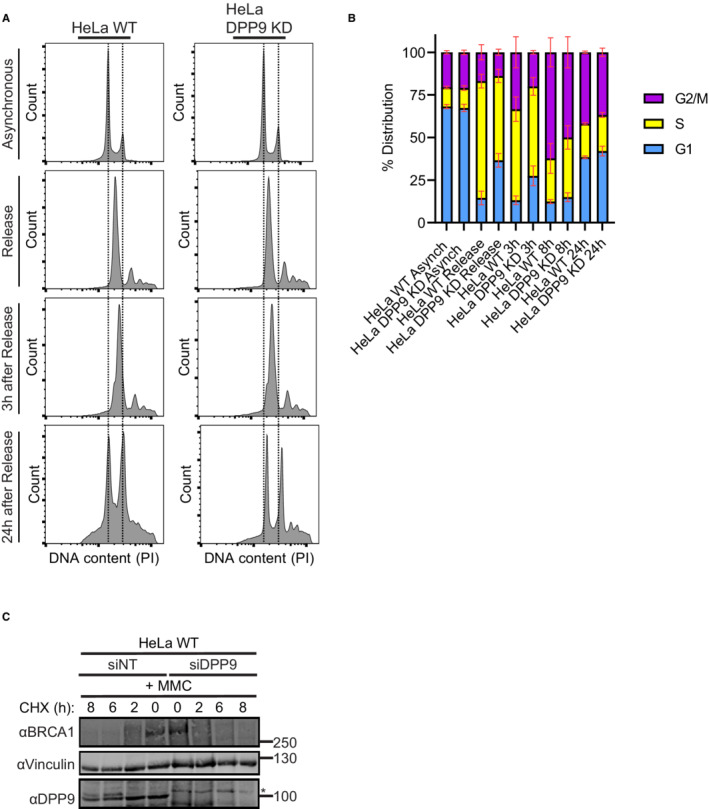
- A
Representative histograms of HeLa WT and HeLa DPP9 KD cells investigating their relative DNA content via PI staining. Asynchronized cells and cells that were double thymidine‐treated were investigated. Shown are representatives of the asynchronized, double thymidine release, 3 h of recovery and 24 h of recovery samples.
- B
Cell cycle distribution of the HeLa WT and HeLa DPP9 KD populations of asynchronized cells and synchronized cells at 0 h, 3, 8, and 24 after double thymidine release. Data from three to six biological replicates (asynchronized (n = 3), synchronized HeLa WT (n = 6), synchronized HeLa DPP9 KD (n = 4)) were analyzed by a two‐way ANOVA, with the Tukey's multiple comparison test. No significant differences could be detected between the two cell lines. Shown are mean ± SEM.
- C
Representative western blots showing a CHX chase of HeLa WT cells transiently silenced for DPP9, and of control cells treated with nontargeting siRNA (siNT). Cells were treated with MMC (300 nM, 24 h) prior to the addition of CHX. Anti‐BRCA1: RRID:AB_626761, anti‐DPP9: RRID:AB_731947, anti‐Vinculin: RRID:AB_477629.
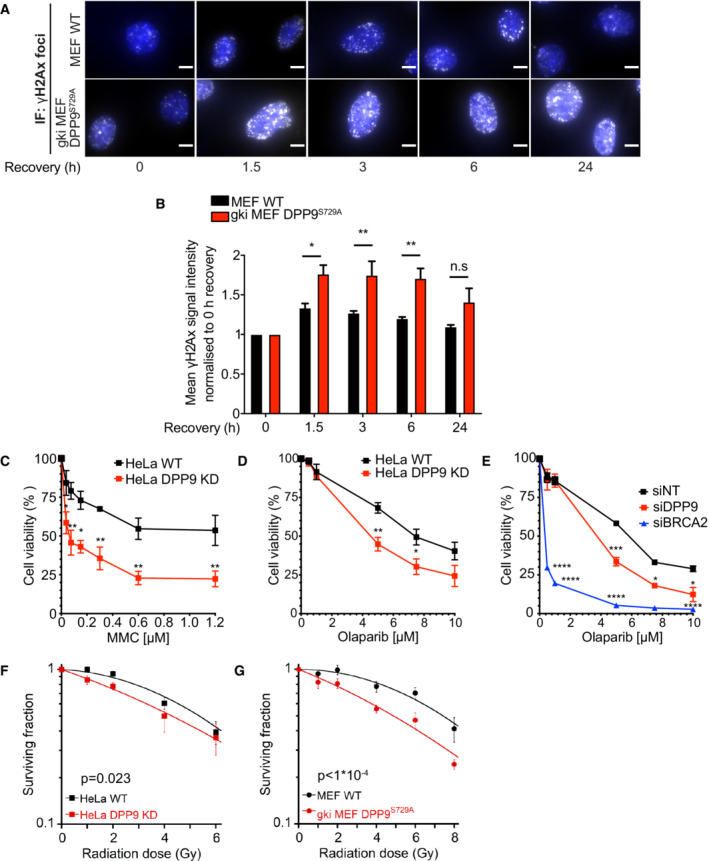
- A
Representative immunofluorescence images of γH2AX signals (white, RRID:AB_309864) in gki MEF DPP9S729A, showing more γH2AX in gki MEF DPP9S729A cells following removal of Neocarzinostatin (NCS), quantification in (B). MEF DPP9S729A and control MEF cells were treated with 250 ng/mL NCS for 30 min and allowed to recover for the indicated time points. γH2AX signals at time 0, reflect 30 min of NCS and no recovery time. Nuclei are shown in blue (DAPI). Scale bar 10 μm.
- B
Quantification of γH2AX in gki MEF DPP9S729A and control MEF cells as described in (A). Signals from more than 1,700 cells were quantified per condition per experiment. Mean ± SEM from six biological replicates, each in technical duplicates. Data were analyzed by an unpaired two‐way ANOVA with the Sidak's multiple comparison test (*P ≤ 0.05, **P ≤ 0.01).
- C–E
Dose‐dependent viability assays show a higher sensitivity of HeLa DPP9 KD cells (C and D) and DPP9 silenced cells (siDPP9) (E) to MMC (C) and Olaparib (D, E). BRCA2 was silenced for control. Mean ± SEM of three biological replicates. Data were analyzed by an unpaired two‐way ANOVA with the Sidak's multiple comparison test (*P ≤ 0.05, **P ≤ 0.01, ***P ≤ 0.001, ****P ≤ 0.0001).
- F, G
Quantification of colonies formed after γ‐radiation of HeLa WT and DPP9 KD (F), and MEF WT and gki MEF DPP9S729A cells (G), showing the mean ± SEM of the survival fraction (SF) from three biological replicates. Data were analyzed by an unpaired two‐way ANOVA.
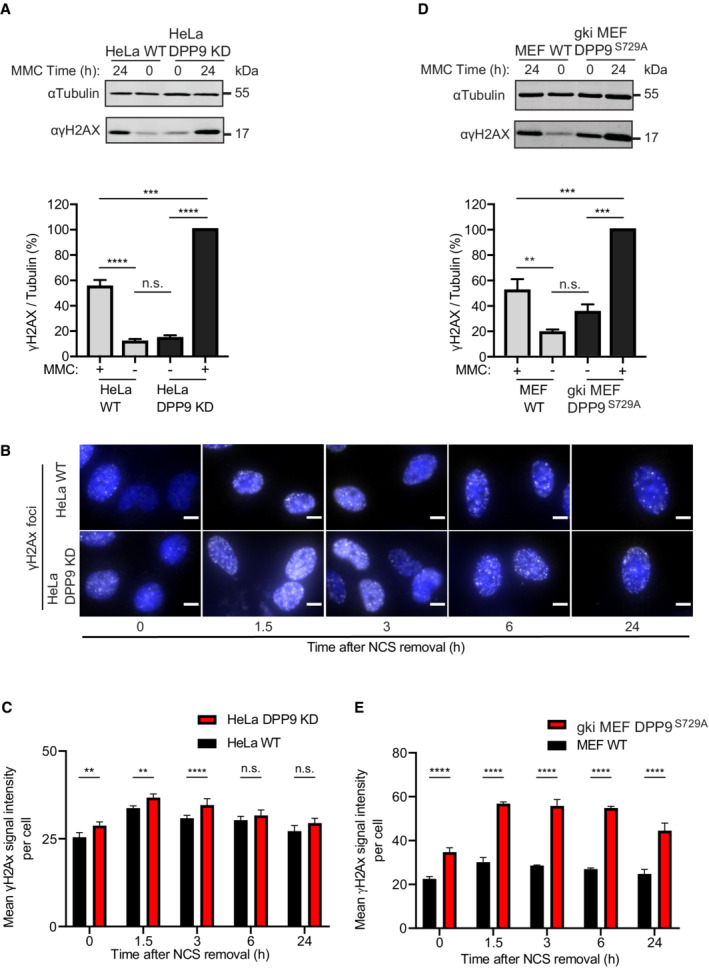
- A
Increased γH2AX signals in HeLa DPP9 KD cells following exposure to 300 nM MMC for 24 h. Tubulin was a loading control. Quantification of the γH2AX / Tubulin signals in HeLa DPP9 KD cells and HeLa WT cells from three biological replicates. The γH2AX / Tubulin ratio in HeLa DPP9 KD cells at 24 h MMC was defined as 100%. Mean ± SEM. Data were analyzed by a two‐way ANOVA, with the Tukey's multiple comparison test (****P ≤ 0.0001). Anti‐γH2AX: RRID:AB_2118009, anti‐Tubulin: RRID:AB_628412.
- B
Representative immunofluorescence images showing more γH2AX (white) in HeLa DPP9 KD cells following removal of Neocarzinostatin (NCS). Nuclei are shown in blue (DAPI). Scale bar 10 μm. HeLa DPP9 KD cells and HeLa WT cells were treated with 250 ng/ml Neocarzinostatin (NCS) for 30 min and allowed to recover for the indicated time points. γH2AX signals of each cell type at time 0, reflect 30 min of NCS, and no recovery time. Anti‐γH2AX: RRID:AB_309864.
- C
Quantification of mean γH2AX signals from HeLa WT and HeLa DPP9 KD cells. More than 1,300 cells were quantified per condition per experiment. Mean ± SEM from four biological replicates, each in technical duplicates. Data were analyzed by an unpaired two‐way ANOVA with the Sidak's multiple comparison test (**P ≤ 0.01, ****P ≤ 0.0001).
- D
Higher γH2AX signals in gki MEF DPP9S729A cells expressing enzymatically inactive DPP9 compared with MEF WT control cells following exposure to 300 nM MMC for 24 h. Tubulin was a loading control. Quantification of the γH2AX / Tubulin ratios in gki MEF DPP9S729A cells and MEF WT cells from three biological replicates. For normalization, the γH2AX / Tubulin ratio in gki MEF DPP9S729A cells at 24 h MMC was defined as 100%. Mean ± SEM. Data were analyzed by a two‐way ANOVA, with the Tukey's multiple comparison test (****P ≤ 0.0001).
- E
Same as (C) for gki MEF DPP9S729A cells and MEF WT cells. Signals from more than 1,700 cells were quantified per condition per experiment. Mean ± SEM from six biological replicates. Data were analyzed by an unpaired two‐way ANOVA with the Sidak's multiple comparison test (****P ≤ 0.0001).
- A
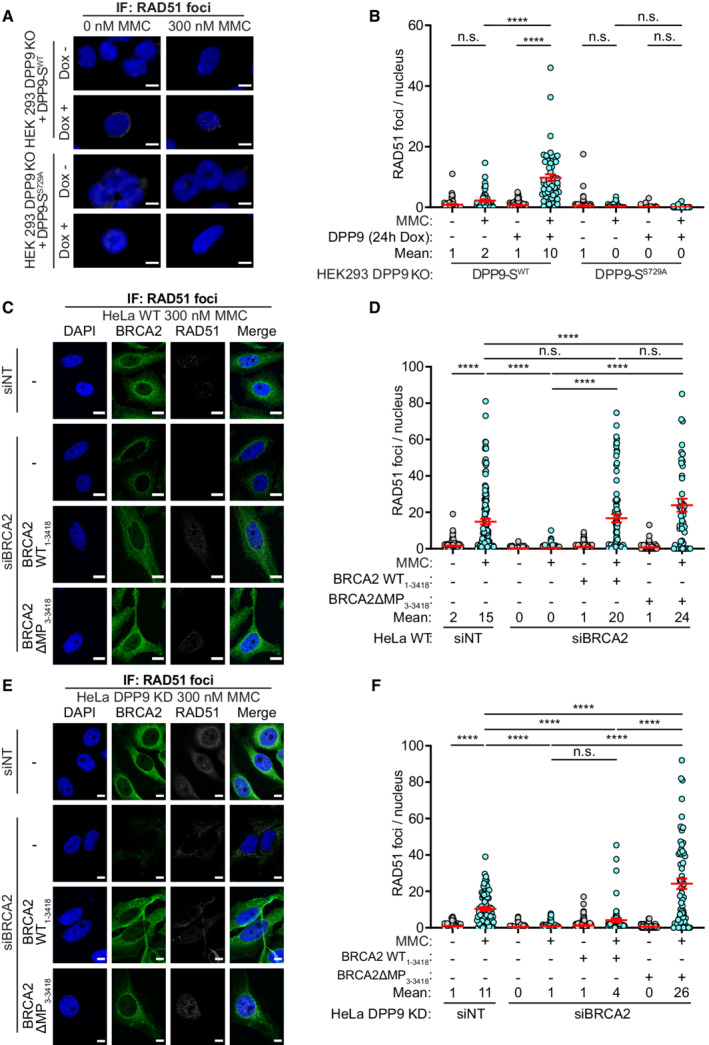
Representative immunofluorescence images showing that re‐expression of DPP9‐SWT leads to an increase in the number of RAD51 foci formed following exposure to MMC in HEK293 DPP9 KO+DPP9‐SWT cells. Expression of DPP9 was induced (+ Dox, 1 μg/ml) simultaneously with MMC (300 nM), 24 h. RAD51 foci are shown in white, and nuclei (DAPI) are shown in blue. Scale bar 10 μm. Anti‐RAD51: RRID:AB_1142428.
- B
Graph showing the number of RAD51 foci following induction of DPP9‐SWT expression, compared with uninduced HEK293 DPP9 KO+DPP9WT cells (‐Dox). Induction of HEK293 DPP9 KO+DPP9S729A for expression of DPP9‐SS729A did not result in more RAD51 foci. Each dot represents the number of RAD51 foci in a single cell, from three biological replicates. Data were analyzed by a two‐way ANOVA, with the Tukey's multiple comparison test. Shown are mean ± SEM (****P ≤ 0.0001).
- C–F
Representative images (C, E) and summarizing graph (D, F) showing the number of RAD51 foci per nucleus in HeLa WT cells (C, D) or HeLa DPP9 KD cells (E, F). Where stated, cells were treated with control siRNA (siNT) or silenced for BRCA2, and transiently transfected with the BRCA21‐3418 or BRCA23‐3418 constructs. Both BRCA2 constructs can rescue the RAD51 foci formation phenotype to the control levels in HeLa WT cells (C, D). In HeLa DPP9 KD cells significantly more RAD51 foci were present in cells transfected with BRCA2ΔMP3‐3418 compared with BRCA2 silenced cells and cells expressing the untruncated BRCA21‐3418 (E, F). Each dot represents the number of RAD51 foci in a single cell, from three (D) or four (F) biological replicates. Data were analyzed by a two‐way ANOVA, with the Tukey's multiple comparison test. Shown are mean ± SEM (****P ≤ 0.0001). RAD51 foci are shown in white, and nuclei (DAPI) are shown in blue. Scale bar 10 μm. Anti‐RAD51: RRID:AB_1142428; anti‐DPP9: RRID:AB_2889071; anti‐BRCA2: RRID:AB_2259370.
- A
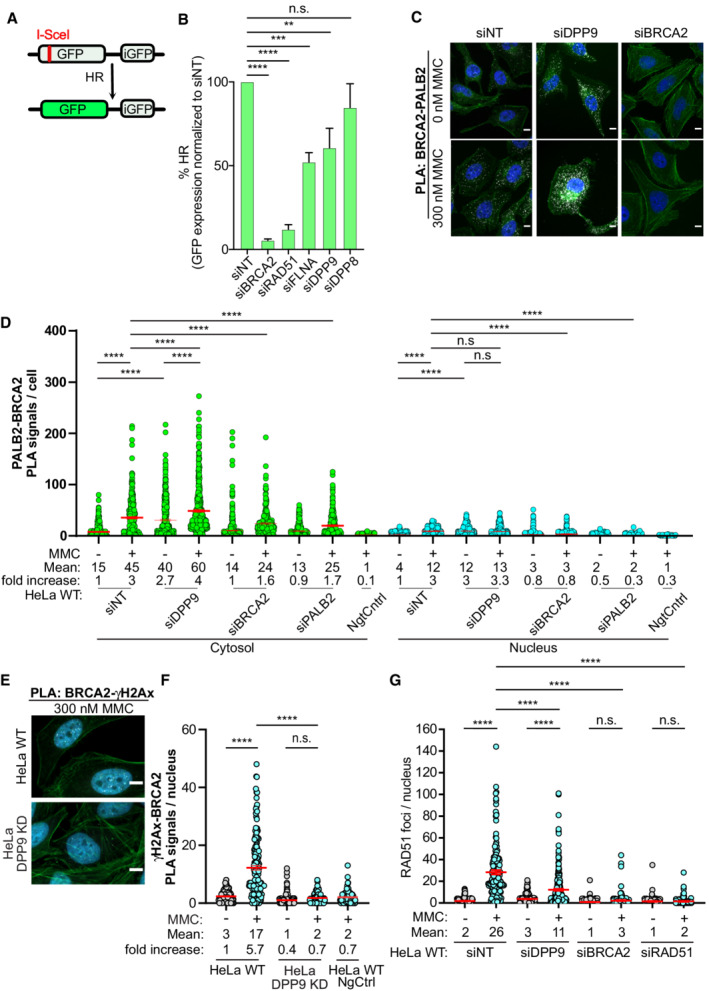
Graphical presentation of the DR‐GFP reporter assay for HR. The construct includes two mutated GFP genes (SceGFP and iGFP) oriented as direct repeats. The SceGFP gene is mutated to contain the recognition site for the rare‐cutting endonuclease I‐SceI and a STOP codon, while the iGFP is a truncated form of GFP. Cells expressing the DR‐GFP are transfected with I‐SceI, which forms a DSB within the SceGFP. For HR‐mediated repair, the iGFP serves as a template for HR‐mediated repair of the DSB in GFP (Pierce et al, 1999).
- B
DPP9‐silenced cells are less efficient in the repair of DSBs by HR. HCT116 cells stably expressing the DR‐GFP reporter assay for HR efficiency were transiently transfected with the indicated siRNAs, and transfected with an I‐SceI‐expression vector. 48 h after transfection, the percentage of GFP‐positive cells was measured using flow cytometry analysis as an indication of HR efficiency. The graph shows the mean ± SEM from seven biological replicates. Data were analyzed by a paired two‐tailed t‐test (**P ≤ 0.01, ***P ≤ 0.001, ****P ≤ 0.0001).
- C
Representative PLA images of BRCA2‐PALB2 PLA experiments showing more PLA events (white) in HeLa cells silenced for DPP9 (siDPP9) with respect to cells treated with nontargeting siRNA (siNT). Phalloidin (green) stains actin filaments and DAPI (blue) stains the nucleus. Scale bar 10 μm. Anti‐PALB2: RRID:AB_890607, anti‐BRCA2: RRID:AB_2259370.
- D
Quantification of PLAs experiments showing more BRCA2‐PALB2 PLA events in cells silenced for DPP9 (siDPP9) in comparison with nontargeting controls (siNT). Each dot represents the number of PLA events in a single cell, from four biological replicates. The technical control samples (NgtCntrl) omitted the BRCA2 antibody. The number of foci is shown based on their cellular localisation. Data were analyzed by a two‐way ANOVA, with the Tukey's multiple comparison test. Shown are mean ± SEM (****P ≤ 0.0001).
- E
Representative PLA images of γH2Ax‐BRCA2 PLA experiment showing a reduction in the number of PLA events (white) between γH2Ax and BRCA2 in HeLa DPP9 KD cells. Phalloidin (green) stains actin filaments and DAPI (blue) stains the nucleus. Scale bar 10 μm. Anti‐γH2Ax: RRID:AB_2118009, anti‐BRCA2: RRID:AB_2259370 (these images, along with the corresponding controls can be found in Appendix Fig S1D).
- F
Quantification of PLAs showing fewer MMC‐induced γH2Ax‐BRCA2 PLA events in HeLa DPP9 KD cells, in comparison with HeLa WT cells. Each dot represents the number of PLA events in a single cell, from three biological replicates. The technical control samples (NgtCntrl) omitted the γH2Ax antibody. Data were analyzed by a two‐way ANOVA, with the Tukey's multiple comparison test. Shown are mean ± SEM (****P ≤ 0.0001).
- G
Graph showing fewer RAD51 foci in DPP9‐silenced cells compared with control cells, following exposure to MMC. Each dot represents the number of RAD51 foci in a single cell, from two to six biological replicates: siNT‐MMC (n = 6), siNT+MMC (n = 6), siDPP9‐MMC (n = 5), siDPP9+MMC (n = 5), siBRCA2‐MMC (n = 3), siBRCA2+MMC (n = 3), siRAD51‐MMC (n = 2), siRAD51+MMC (n = 2). Data were analyzed by a two‐way ANOVA, with the Tukey's multiple comparison test. Shown are mean ± SEM (****P ≤ 0.0001).
- A
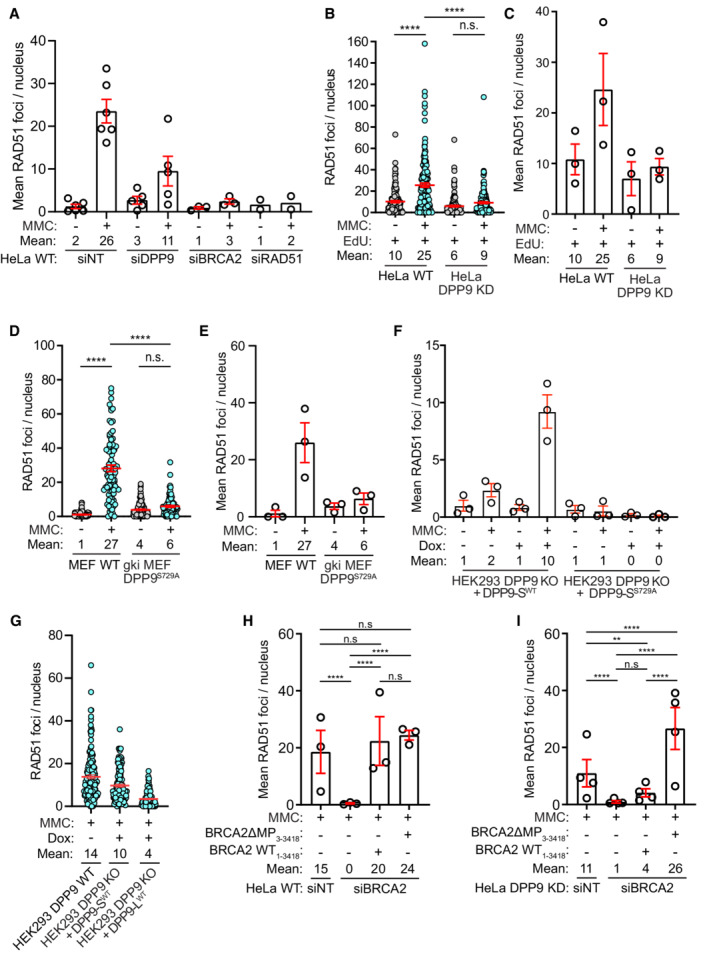
A graph summarizing the mean number of RAD51 foci in HeLa WT cells treated with nontargeting siRNA (siNT) or silenced with the indicated oligos. Each dot represents the mean number of RAD51 foci in a single repetition, from two to six biological replicates. Statistical analysis on the data is shown in Fig 6G. Shown are mean ± SEM.
- B
A graph summarizing the number of RAD51 foci in HeLa WT and DPP9 KD cells treated with EdU and MMC. Shown is the quantification of RAD51 foci in EdU positive cells. HeLa DPP9 KD cells display fewer RAD51 foci in comparison with their WT counterparts. Each dot represents the number of RAD51 foci in a single cell, from three biological replicates. Data were analyzed by a two‐way ANOVA, with the Tukey's multiple comparison test. Shown are mean ± SEM.
- C
A graph summarizing the mean number of RAD51 foci in EdU positive HeLa WT and DPP9 KD cells. Each dot represents the mean number of RAD51 foci in a single repetition, from three biological replicates. Statistical analysis on the data is shown in Fig EV4B. Shown are mean ± SEM.
- D
A graph summarizing the number of RAD51 foci in MEF WT and gki MEF DPP9S729A cells treated with MMC. Shown is the quantification of RAD51 foci. Each dot represents the number of RAD51 foci in a single cell, from three biological replicates. Data were analyzed by a two‐way ANOVA, with the Tukey's multiple comparison test. Shown are mean ± SEM.
- E
A graph summarizing the mean number of RAD51 foci in MEF WT and gki MEF DPP9S729A cells upon MMC treatment. Each dot represents the mean number of RAD51 foci in a single repetition, from three biological replicates. Statistical analysis on the data is shown in Fig EV4D. Shown are mean ± SEM.
- F
A graph summarizing the mean number of RAD51 foci following induction of DPP9‐SWT expression, compared with uninduced HEK293 DPP9 KO+DPP9WT cells (‐Dox). Induction of HEK293 DPP9 KO+DPP9S729A for expression of DPP9‐SS729A did not result in more RAD51 foci. Each dot represents the mean number of RAD51 foci in a single repetition, from three biological replicates. Statistical analysis on the data is shown in Fig 7B. Shown are mean ± SEM.
- G
A graph summarizing the number of RAD51 foci following induction of DPP9‐SWT or DPP9‐LWT expression, compared with HEK293 DPP9WT cells. The number of RAD51 foci formed by the HEK293 DPP9 KO+DPP9‐SWT cells was similar to the HEK293 DPP9WT cells, compared with the HEK293 DPP9 KO+DPP9‐LWT cells. Each dot represents the mean number of RAD51 foci in a single repetition, from two biological replicates. Shown are mean ± SEM.
- H, I
Summary of RAD51 foci in HeLa WT and HeLa DPP9 KD cells as described in (Fig 7C and F). Each dot represents the mean number of RAD51 foci in a single repetition, from three or four biological replicates (HeLa WT (n = 3), HeLa DPP9 KD (n = 4)). Data from the summary of all RAD51 foci per nucleus upon MMC treatment, between biological replicates, were analyzed by a two‐way ANOVA, with the Tukey's multiple comparison test. Shown are mean ± SEM (****P ≤ 0.0001). Shown are mean ± SEM.
- A, B
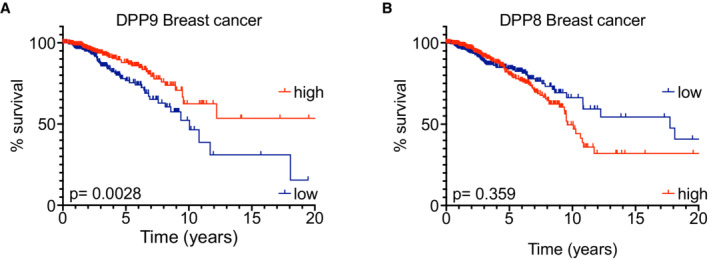
Kaplan–Meier survival curves of Breast cancer patients from The Human Protein Atlas into “high DPP9 or DPP8” (n = 282, 445) and “low DPP9 or DPP8” (n = 408, 630) mRNA expression (greater than or less than 9.678 or 4.36 reads per kilobase per million, respectively). P‐values calculated by log‐rank (Mantel–Cox) indicated greater overall survival in patients with high levels of DPP9 expression (A), while differences in the DPP8 levels were not statistically significant (B).
Similar articles
-
The multifunctional regulatory post-proline protease dipeptidyl peptidase 9 and its inhibitors: new opportunities for therapeutics.Cell Mol Life Sci. 2025 Apr 28;82(1):187. doi: 10.1007/s00018-025-05719-4. Cell Mol Life Sci. 2025. PMID: 40293537 Free PMC article. Review.
-
The amino-dipeptidyl peptidases DPP8 and DPP9: Purification and enzymatic assays.Methods Enzymol. 2023;684:289-323. doi: 10.1016/bs.mie.2023.02.013. Epub 2023 Mar 21. Methods Enzymol. 2023. PMID: 37230592
-
N-terminal processing by dipeptidyl peptidase 9: Cut and Go!Biochimie. 2024 Nov;226:180-192. doi: 10.1016/j.biochi.2024.03.002. Epub 2024 Mar 9. Biochimie. 2024. PMID: 38461970 Review.
-
A novel SUMO1-specific interacting motif in dipeptidyl peptidase 9 (DPP9) that is important for enzymatic regulation.J Biol Chem. 2012 Dec 28;287(53):44320-9. doi: 10.1074/jbc.M112.397224. Epub 2012 Nov 14. J Biol Chem. 2012. PMID: 23152501 Free PMC article.
-
Identification of novel dipeptidyl peptidase 9 substrates by two-dimensional differential in-gel electrophoresis.FEBS J. 2015 Oct;282(19):3737-57. doi: 10.1111/febs.13371. Epub 2015 Aug 3. FEBS J. 2015. PMID: 26175140
Cited by
-
DPP9: Comprehensive In Silico Analyses of Loss of Function Gene Variants and Associated Gene Expression Signatures in Human Hepatocellular Carcinoma.Cancers (Basel). 2021 Apr 1;13(7):1637. doi: 10.3390/cancers13071637. Cancers (Basel). 2021. PMID: 33915844 Free PMC article.
-
The multifunctional regulatory post-proline protease dipeptidyl peptidase 9 and its inhibitors: new opportunities for therapeutics.Cell Mol Life Sci. 2025 Apr 28;82(1):187. doi: 10.1007/s00018-025-05719-4. Cell Mol Life Sci. 2025. PMID: 40293537 Free PMC article. Review.
-
The serine protease DPP9 and the redox sensor KEAP1 form a mutually inhibitory complex.J Biol Chem. 2025 Jan;301(1):108034. doi: 10.1016/j.jbc.2024.108034. Epub 2024 Nov 29. J Biol Chem. 2025. PMID: 39615677 Free PMC article.
-
DPP8 Selective Inhibitor Tominostat as a Novel and Broad-Spectrum Anticancer Agent against Hematological Malignancies.Cells. 2023 Apr 6;12(7):1100. doi: 10.3390/cells12071100. Cells. 2023. PMID: 37048172 Free PMC article.
-
Chemoproteomics-Enabled Identification of 4-Oxo-β-Lactams as Inhibitors of Dipeptidyl Peptidases 8 and 9.Angew Chem Int Ed Engl. 2022 Nov 21;61(47):e202210498. doi: 10.1002/anie.202210498. Epub 2022 Oct 28. Angew Chem Int Ed Engl. 2022. PMID: 36089535 Free PMC article.
References
-
- Ajami K, Abbott CA, McCaughan GW, Gorrell MD (2004) Dipeptidyl peptidase 9 has two forms, a broad tissue distribution, cytoplasmic localization and DPIV‐like peptidase activity. Biochim Biophys Acta 1679: 18–28 - PubMed
-
- Arnesen T, Damme PV, Polevoda B, Helsens K, Evjenth R, Colaert N, Varhaug JE, Vandekerckhove J, Lillehaug JR, Sherman F et al (2009) Proteomics analyses reveal the evolutionary conservation and divergence of N‐terminal acetyltransferases from yeast and humans. Proc Natl Acad Sci U S A 106: 8157–8162 - PMC - PubMed
-
- Bachmair A, Finley D, Varshavsky A (1986) In vivo half‐life of a protein is a function of its amino‐terminal residue. Science 234: 179–186 - PubMed
Publication types
MeSH terms
Substances
Associated data
- Actions
- Actions
LinkOut - more resources
Full Text Sources
Research Materials
Miscellaneous
