. 2022 Sep;236(9):1388-1402.
doi: 10.1177/09544119221114207. Epub 2022 Aug 1.

A structural approach to 3D-printing arterial phantoms with physiologically comparable mechanical characteristics: Preliminary observations

Affiliations

A structural approach to 3D-printing arterial phantoms with physiologically comparable mechanical characteristics: Preliminary observations

Bruce Guest et al. Proc Inst Mech Eng H. 2022 Sep.

Abstract

Pulse wave behavior is important in cardiovascular pathophysiology and arterial phantoms are valuable for studying arterial function. The ability of phantoms to replicate complex arterial elasticity and anatomy is limited by available materials and techniques. The feasibility of improving phantom performance using functional structure designs producible with practical 3D printing technologies was investigated. A novel corrugated wall approach to separate phantom function from material properties was investigated with a series of designs printed from polyester-polyurethane using a low-cost open-source fused filament fabrication 3D printer. Nonpulsatile pressure-diameter data was collected, and a mock circulatory system was used to observe phantom pulse wave behavior and obtain pulse wave velocities. The measured range of nonpulsatile Peterson elastic strain modulus was 5.6-19 to 12.4-33.0 kPa over pressures of 5-35 mmHg for the most to least compliant designs respectively. Pulse wave velocities of 1.5-5 m s-1 over mean pressures of 7-55 mmHg were observed, comparing favorably to reported in vivo pulmonary artery measurements of 1-4 m s-1 across mammals. Phantoms stiffened with increasing pressure in a manner consistent with arteries, and phantom wall elasticity appeared to vary between designs. Using a functional structure approach, practical low-cost 3D-printed production of simple arterial phantoms with mechanical properties that closely match the pulmonary artery is possible. Further functional structure design development to expand the pressure range and physiologic utility of dir"ectly 3D-printed phantoms appears warranted.

Keywords: 3D-printed phantom; Arterial phantom; additive manufacturing; cardiovascular system mechanics; functional structure; physiologic elasticity; pulse wave; pulse wave velocity; waveforms: hemodynamics.


Conflict of interest statement

Declaration of conflicting interests: The author(s) declared no potential conflicts of interest with respect to the research, authorship, and/or publication of this article.

Figures

Figure 1.
Figure 1.
Rendered image of a corrugated phantom design (left) and an assembled 3D-printed phantom (right). Phantoms were printed progressively along their long (z) axis from a single thermally fused bead of polyurethane continuously extruded in a uniform corrugated pattern (inset) along a helical path (coiled arrow). 35 mm inner diameter polyurethane fittings (large arrows) were bonded to the phantom, expanding the ends (small arrows) and reducing phantom free length to 150 mm.
Figure 2.
Figure 2.
As printed corrugated wall designs. Images obtained by flatbed optical scanning of straightened unstrained phantom sections (~10 mm in length) cut in x-y plane at 30 mm build height, irregularities on and along section edges are associated with cutting artifacts. Letters denote design type, note variations in pitch between D through G and amplitude between D and H, complete metrics in Table 1. Scale bar applies to all sections. WT: wall thickness (mm); CP: corrugation pitch (mm); CS: corrugation size (mm).
Figure 3.
Figure 3.
Pressure-diameter test setup. Laser micrometer attached to phantom rail mount system (a), laser transmitter and receiver (black arrows), support medium open trough (white arrow), pressure catheter introducer sheath (red arrow). Phantom pressurization images captured during at 3, 30, and 45 mmHg ((b–d) respectively).
Figure 4.
Figure 4.
Schematic representation of mock circulatory system. A microcontroller-based pulse engine generates repeatable fluid pulses by controlling pulse valve open position, open and close rates and open dwell time as well as pulse period and resistance valve position. Anti-surge reservoir spill over height determines terminal runoff pressure. Phantom is horizontally mounted via rail mounted bulkheads and supported in water trough. Data acquisition system records proximal and distal intraluminal pressures, inlet flow rate and pulse valve position. Pump vibrations and water hammer impulses are damped by a looped hose fixed to a rubber and metal element. Protection system prevents phantom over-pressurization. P: pressure: T: temperature; F: flow.
Figure 5.
Figure 5.
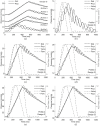
Design G pulse profile and wave relationships. Distal and proximal pressure waves (recorded 30 mm from the respective phantom ends) for five pulse profiles (a), first 1000 ms of profiles 2 through 5 shown. Individual pulse profiles (b–f) with inlet flow onset and pulse valve open transition synchronized to proximal pressure wave foot, first 1250 ms of profiles 2 through 5 shown. Pulse valve position normalized to flow rate. Two phases of the main pressure wave are defined; an inflow phase while the pulse valve (dash-dot line) is open and a runoff phase during the period of pulse valve closure (b–f). Note the secondary wave superimposed on the main pressure wave forms, please refer to Figure 10 for a temporal-spatial depiction and the discussion for a proposed explanation.
Figure 6.
Figure 6.
Nonpulsatile compliance on pressure isobars along design G long axis. Isobar values indicated (mmHg); diameter and distance scales are equivalent. Upper build height end of phantom (oriented at 0 mm distance) appears more compliant than build surface end. Compliance becomes non-physiological (increasing with increasing pressure) at luminal pressures above ~50 mmHg. Phantom effective reflective distance decreases and end reflective site abruptness increases with increasing pressure (arrows). Nominal end diameters constrained to 35 mm by fittings. Data generated from polynomial fit of pressure and diameter measurements obtained at 5 cm intervals along long axis.
Figure 7.
Figure 7.
Analysis of five repeated pressure-diameter measures at mid phantom long axis distance (80 mm from inlet); (a) elastance (all designs) and (b) non-pulsatile Peterson elastic strain modulus (corrugated designs). Cursory analysis of standard deviation (see Supplemental Figures 2 and 3) indicates nonlinearity and significant difference between phantoms. Note difference in design A (smooth wall) elastance magnitude and slope compared to corrugated designs (D–H). Letters denote design types.
Figure 8.
Figure 8.
Phantom pulse volumes relative to pulse pressure and minimum wave pressure (a). Data obtained from five pulse profiles for each design (Table 4), letters denote design types. Pulse pressure of design A (smooth wall) phantom is small compared to corrugated designs and declines with increasing minimum pressure in contrast to corrugated designs where pulse pressure tends to increase with increasing minimum pressure except for the highest-pressure pulse profile where pulse pressures are essentially unchanged. Pulse volume response, normalized to pulse pressure and corrugation magnitude, relative to corrugation number of corrugated phantoms (b) over five different pulse profiles. For corrugated designs, normalized pulse volume appears to vary by design type with normalized pulse volume correlated to corrugation number and, comparing designs G and H, is also likely proportional to corrugation size.
Figure 9.
Figure 9.
Relationship between phantom pulse wave velocity and mean wave pressure for pulse wave velocities obtained from foot-of-wave (FOW) fiduciary point analysis (a) and from statistical phase offset analysis of waves present in the runoff phase (b). Letters denote design types. In contrast to the smooth wall phantom (A), pulse wave velocity determined by foot-of-wave analysis for the corrugated phantoms (D–H) increases with increasing pressure. Corrugated phantom pulse wave velocities determined by foot-of-wave analysis are similar for all designs whereas wave velocities during runoff appear to have an inverse relationship to corrugation number or size.
Figure 10.
Figure 10.
Interpolation of repeated pressure waves surveyed along phantom long axis in 5 mm increments from inlet. First 1250 of 2000 ms pulse duration shown. Note attenuation of secondary wave at phantom midpoint (80 mm distance). Design G, pulse profile 2.

References

    1. Segers P, O’Rourke MF, Parker K, et al.. Towards a consensus on the understanding and analysis of the pulse waveform: results from the 2016 workshop on arterial hemodynamics: past, present and future. Artery Res2017; 18: 75–80. - PMC - PubMed
    1. Wang JJ, O’Brien AB, Shrive NG, et al.. Time-domain representation of ventricular-arterial coupling as a windkessel and wave system. Am J Physiol Heart Circ Physiol 2003; 284(4): H1358–H1368. - PubMed
    1. Parker KH. An introduction to wave intensity analysis. Med Biol Eng Comput 2009; 47(2): 175–188. - PubMed
    1. Safar ME, Struijker-Boudier HA. Cross-talk between macro- and microcirculation. Acta Physiol 2010; 198: 417–430. - PubMed
    1. Climie RED, Picone DS, Blackwood S, et al.. Pulsatile interaction between the macro-vasculature and micro-vasculature: proof-of-concept among patients with type 2 diabetes. Eur J Appl Physiol 2018; 118(11): 2455–2463. - PubMed

LinkOut - more resources