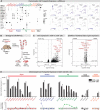
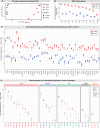
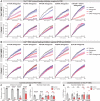
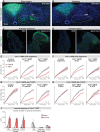
Figure 6.. Parallel neuronal pathways convey EEC signals to the brain.
(A) Experimental design. Triple-transgenic mice expressing hM3D in CCK or TAC1 EECs, or littermate controls, were subjected to either surgical vagotomy to remove subdiaphragmatic vagal afferents, or treatment with intrathecal RTX to ablate spinal afferents, or sham surgery. They were then treated with CNO or vehicle and the effect on feeding behavior and learned preferences was measured. (B,D) Tac1Cre; Vil-Flp; R26Dual-hM3D mice and littermate controls were subjected to either subdiaphragmatic vagotomy or sham surgery (B) or IT-RTX or sham surgery (D). Animals were then food deprived overnight, injected with CNO or vehicle, and one-hour food intake was recorded. Right: ratio of feeding inhibition after treatment with CNO versus vehicle. Statistics for (B, left): Two-way repeated measures ANOVA. Drug: F(1, 14)=15.03, p=0.0017. Subject: F(2, 14)=0.7452, p=0.4925. Interaction: F(2, 14)=6.480, p=0.0102. (B, right): Ordinary one-way ANOVA. F(2, 14)=6.926, p=0.0081.(D, left): Two-way repeated measures ANOVA. Drug: F(1, 16)=20.25, p=0.0004. Subject: F(2, 16)=4.673, p=0.0252. Interaction: F(2, 16)=13.38, P=0.0004. (D, right): Ordinary one-way ANOVA. F(2, 16)=13.40, p=0.0004. (C,E) CckCre; Vil-Flp; R26Dual-hM3D mice and littermate controls were subjected to either subdiaphragmatic vagotomy or sham surgery (C) or IT-RTX or sham surgery (E). Animals were then food deprived overnight, injected with CNO or vehicle, and one-hour food intake was recorded. Right: ratio of feeding inhibition after treatment with CNO versus vehicle. Statistics for (C, left): Two-way repeated measures ANOVA. Drug: F(1, 12)=32.50, p<0.0001. Subject: F(2, 12)=0.6638, p=0.5328. Interaction: F(2, 12)=15.33, p=0.0005. (C, right): Ordinary one-way ANOVA. F(2, 12)=7.267, p=0.0086. (E, left): Two-way repeated measures ANOVA. Drug: F(1, 16)=34.54, p<0.0001. Subject: F(2, 16)=1.036, p=0.3774. Interaction: F(2, 16)=7.123, p=0.0061. (E, right): Ordinary one-way ANOVA. F(2, 16)=11.03, p=0.0010. (F) Tac1Cre; Vil-Flp; R26Dual-hM3D mice (red) and littermate controls (gray) underwent sham treatment, vagotomy, or IT-RTX before CTA training as in Figure 4. All mice received CNO during CTA training. Left: Preference for sucrose in the two-bottle test after CTA training. Ordinary two-way ANOVA. Genotype: F(1, 24)=154.1, p<0.0001. Treatment: F(2, 24)=12.83, p=0.0002. Interaction: F(2, 24)=7.792, p=0.0025. Right: Ratio of total sucrose intake in the second sucrose training session (day 3, after pairing with CNO for one trial) versus first sucrose session (day 1, naive mice). Ordinary two-way ANOVA. Genotype: F(1, 30)=35.61, p<0.0001. Treatment: F(2, 30)=4.673, p=0.0171. Interaction: F(2, 30)=2.398, p=0.1081. Of note, the apparent increased preference for sucrose after vagotomy is largely due to the low ingestion of water; see also Figure 6—figure supplement 1I. (G) CckCre; Vil-Flp; R26Dual-hM3D mice and littermate controls underwent sham treatment, vagotomy, or IT-RTX and then were subjected to CFP training as in Figure 4. Shown is the preference for the CNO paired flavor in the two-bottle test before training (gray bars, day 1) and after training (red bars, day 6). Control: Two-way repeated measure ANOVA. Genotype: F(1, 10)=16.95, p=0.0021. Time: F(1, 10)=9.746, p=0.0108. Interaction: F(1, 10)=5.771, p=0.0372.Vagotomy: Two-way repeated measure ANOVA. Genotype: F(1, 12)=1.866, p=0.1970. Time: F(1, 12)=1.213, p=0.2923. Interaction: F(1, 12)=0.4892, p=0.4976. IT-RTX: Two-way repeated measure ANOVA. Genotype: F(1, 13)=0.08803, p=0.7714. Time: F(1, 13)=5.795, 0.0316. Interaction: F(1, 13)=6.671, p=0.0227. (H) Summary of neuronal pathways required for Tac1Cre EECs or CckCre EECs to regulate food intake and drive food learning. Values are reported as mean ± SEM. *p<0.05, **p<0.01, ***p<0.001, ****p<0.0001; # or ns above bars indicate p-value comparing with the vehicle control treatment of the same genotype (#P<0.05); two-way ANOVA (left of B-E; F, G), or ordinary one-way ANOVA (right of B-E). See also Figure 6—figure supplement 1, Figure 6—source data 1, Source data 1, Figure 6—source data 2, Figure 6—source data 3, Figure 6—source data 4, Figure 6—source data 5, .