. 2022 Aug 18;90(8):e0008022.
doi: 10.1128/iai.00080-22. Epub 2022 Aug 1.

The Integrative Conjugative Element ICESpyM92 Contributes to Pathogenicity of Emergent Antimicrobial-Resistant emm92 Group A Streptococcus

Affiliations

The Integrative Conjugative Element ICESpyM92 Contributes to Pathogenicity of Emergent Antimicrobial-Resistant emm92 Group A Streptococcus

Luis Alberto Vega et al. Infect Immun. .

Abstract

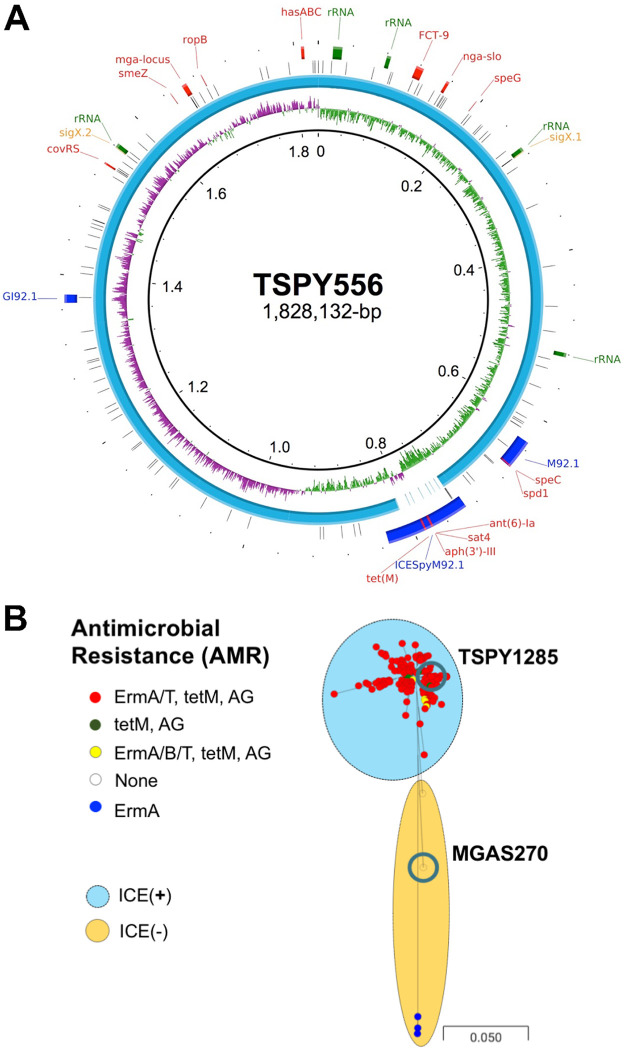
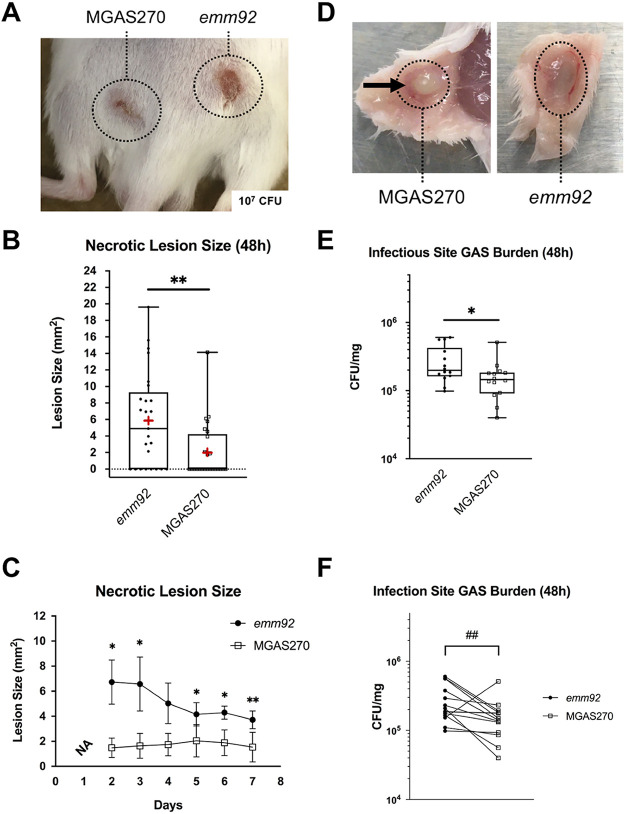
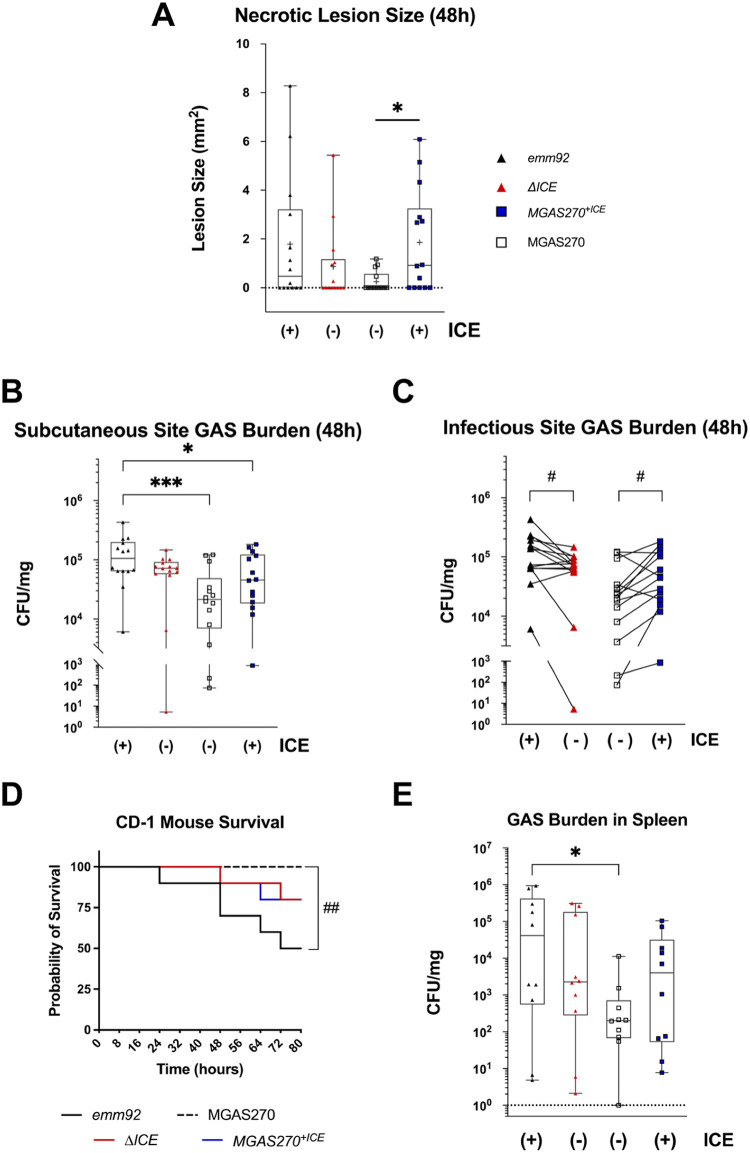
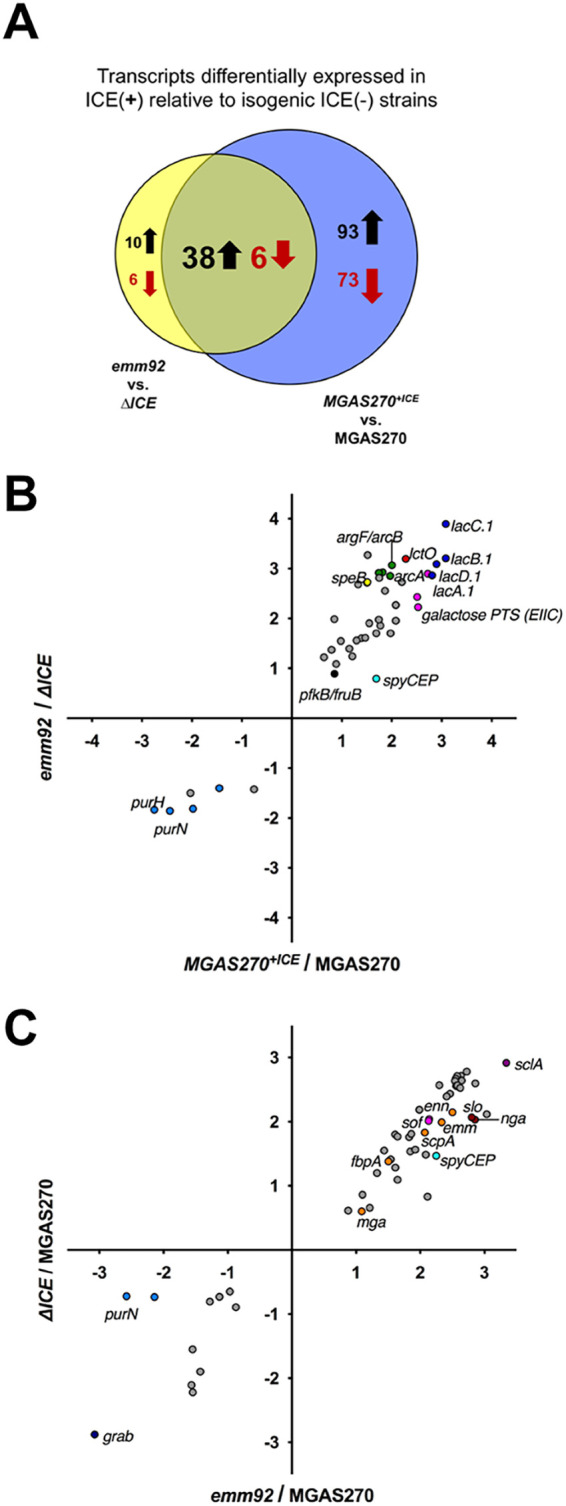
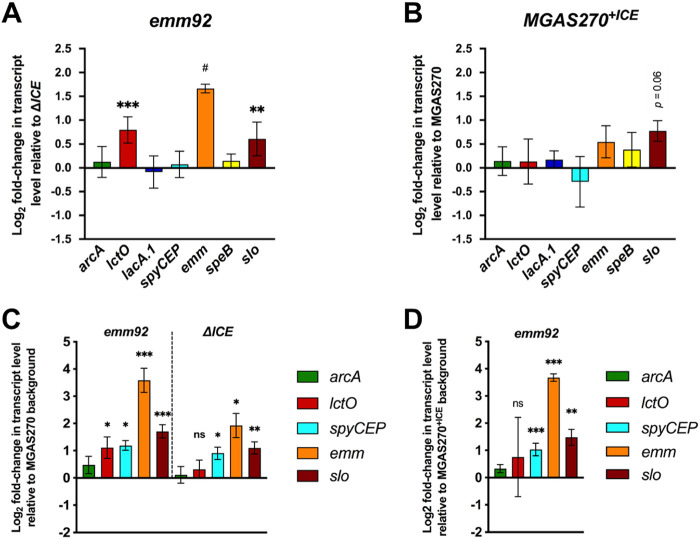
Antimicrobial resistance-encoding mobile genetic elements (MGEs) may contribute to the disease potential of bacterial pathogens. We previously described the association of Group A Streptococcus (GAS) derived from invasive disease with increasingly frequent antimicrobial resistance (AMR). We hypothesized that a 65-kb AMR-encoding MGE (ICESpyM92), highly conserved among closely related emergent invasive emm92 GAS, contributes to GAS disease potential. Here, we provide evidence that a combination of ICESpyM92- and core genome-dependent differential gene expression (DGE) contributes to invasive disease phenotypes of emergent emm92 GAS. Using isogenic ICESpyM92 mutants generated in distinct emm92 genomic backgrounds, we determined the presence of ICESpyM92 enhances GAS virulence in a mouse subcutaneous infection model. Measurement of in vitro and ex vivo DGE indicates ICESpyM92 influences GAS global gene expression in a background-dependent manner. Our study links virulence and AMR on a unique MGE via MGE-related DGE and highlights the importance of investigating associations between AMR-encoding MGEs and pathogenicity.

Keywords: Streptococcus pyogenes; antimicrobial resistance; mobile genetic element; transcriptome; virulence.


Conflict of interest statement

The authors declare no conflict of interest.

Figures

FIG 1
FIG 1
Emergent emm92 constitutes a highly clonal population in which ICESpyM92 is well conserved, suggesting recent emergence. (A) Comparison of MGAS270 whole genome sequence to emergent emm92 reference genome (TSPY556; accession no. CP032700). Rings denote (from innermost to outermost), genome position in Mb (ring 1), GC skew (ring 2), blast comparison of MGAS270 relative to TSPY556 (ring 3), polymorphisms (SNPs/Indels) in MGAS270 relative to TSPY556 (ring 4), and chromosomal features of TSPY556 reference genome (ring 5). Chromosomal features are color-coded as follows: blue = mobile genetic elements (MGEs), red = annotated virulence and antimicrobial resistance (AMR) genes [tet(M), aph(3′)-III, sat4, and ant(6)-Ia], green = rRNA operons, and yellow = sigX site of genome inversion. Note absence of AMR-encoding ICESpyM92 MGE in MGAS270 whole genome sequence. (B) Phylogenetic reconstruction using 901 core biallelic SNP loci of invasive emm92 from Houston (n = 19), Centers for Disease Control Active Bacterial Core surveillance (n = 239) and the MGAS270 strain, relative to the reference genome TSPY556. Node color indicates AMR genotype for aminoglycosides (AG), macrolides (ErmA/B/T), and tetracycline (tetM). Shaded ovals denote nodes corresponding to ICE(+) and ICE(–) strains. Nodes corresponding to TSPY1285 and MGAS270 strains (circled in gray) are indicated. Phylogenetic tree is rooted in strain TSPY556.
FIG 2
FIG 2
Emergent emm92 GAS exhibits enhanced virulence in a murine model of SSTI. Individual mice infected subcutaneously in flanks (contralaterally) with ICE(–) MGAS270 and ICE(+) emergent emm92 (TSPY1285) streptococcal strains (107 CFU) exhibit necrotic lesion development at 48 hpi. (A) Dashed lines indicate area of infection site; image representative of observed necrotic lesion phenotype. (B) Size of necrotic lesion (mm2) at sites of emergent emm92 and MGAS270 infection measured at 48 hpi. The mean (red cross) and median lesion size with 95% confidence interval (box and whisker plot) are indicated. Symbols represent necrotic lesion size in individual mice. (C) Size of necrotic lesion (mm2) at sites of emergent emm92 and MGAS270 infection measured at daily time points postinfection. The mean lesion size (symbols) and SEM (error bars) are indicated. Necrotic lesions were not visible at 1day postinfection (NA). Statistically significant differences in lesion size at each time point are indicated. (D) Representative images of dermal tissue excised from mouse infections sites (interior face of dermis shown). Area of inflammation associated with infection outlined in dashed lines. Infectious site abscess at MGAS270 infection site indicated (arrow). (E and F) Infectious site burden of emergent emm92 and MGAS270 quantified as CFU/mg of homogenized infected tissue at 48 hpi. Median burden and 95% confidence interval (box and whisker plot) (E), as well as paired comparisons (F) of infectious site emergent emm92 and MGAS270 burdens are indicated. Symbols represent individual infection site burden and lines connect infection site burdens of individual mice. Figure legends indicate symbol correspondence to infecting strain. Statistical significance was determined by Mann-Whitney U-test (**, P < 0.01; *, P < 0.05) or by Wilcoxon signed-rank test (##, P < 0.01).
FIG 3
FIG 3
ICESpyM92 contributes to enhanced virulence in a murine model of SSTI. Individual mice infected subcutaneously in flanks (contralaterally) with isogenic ICE(+) and ICE(–) strain pairs (emergent emm92 [JMF1026] versus ΔICE and MGAS270+ICE versus MGAS270; 106 CFU) exhibit ICESpyM92-related statistically significant differences in necrotic lesion development and bacterial burden at 48 hpi. (A) Size of necrotic lesion (mm2) at sites of infection measured at 48 hpi. The mean (gray cross) and median lesion size with 95% confidence interval (box and whisker plot) are indicated. Symbols represent necrotic lesion size in individual mice. (B and C) Infectious site GAS burden quantified as CFU/mg of homogenized infected tissue at 48 hpi. Median GAS burden and 95% confidence interval (box and whisker plot) (B) as well as paired comparisons of isogenic ICE(+) and ICE(–) infectious site burdens in individual mice (C) are indicated. (D) Kaplan-Meier survival curves of CD-1 mice (n = 10 per strain) infected intraperitoneally with isogenic ICE(+) and ICE(–) strain pairs (108 CFU). (E) GAS burden in spleens of intraperitoneally-infected mice, quantified as CFU/mg of homogenized tissue at time test subjects were euthanized. Median GAS burden and 95% confidence interval (box and whisker plot) are indicated. Symbols represent GAS burden in individual mice. Figure legend indicates symbol/color correspondence to infecting strain. Statistical significance was determined by Mann-Whitney U-test (***, P < 0.001; *, P < 0.05), Wilcoxon signed-rank test (#, P < 0.05), or by Mantel-Cox log rank test (##, P < 0.05).
FIG 4
FIG 4
Presence of ICESpyM92 contributes to in vitro differential gene expression (DGE). RNAseq analysis of isogenic ICE (+) and ICE(–) transcriptomes (emergent emm92 ([JMF1026] versus ΔICE and MGAS270+ICE versus MGAS270) during exponential growth in vitro (THY medium) revealed ICE-related DGE. (A) Diagram illustrating the number of transcripts upregulated (black) and downregulated (red) in ICE(+) relative to isogenic ICE(–) transcriptomes in the emergent emm92 (yellow circle) and the MGAS270 background (blue circle). Overlapping region indicates number of transcripts similarly differentially expressed in both ICE(+) transcriptomes. (B) Correlation plot of 44 significantly (P < 0.05; Bonferroni correction) differentially expressed genes (≥1.5-fold relative to ICE[–] isogenic strain) shared between the MGAS270+ICE (x axis) and the emergent emm92 (y axis) transcriptome. (C) Correlation plot of 56 significantly (P < 0.05, Bonferroni correction) differentially expressed genes (≥1.5-fold relative to ICE[–] MGAS270 strain) shared between the emergent emm92 (x axis) and the isogenic ΔICE (y axis) transcriptome. Log2 values are plotted, colors correspond to gene operons and names of virulence genes of interest are listed.
FIG 5
FIG 5
Emergent emm92 transcripts exhibit ICE-related and ICE-independent differential expression in the context of interaction with human epithelial keratinocytes. Differential expression of selected targets in ICE(+) relative to isogenic ICE(–) strains (A) emergent emm92 relative to ΔICE and (B) in MGAS270+ICE relative to MGAS270 adherent to human epithelial keratinocytes (HEK) measured by quantitative real-time PCR (qRT-PCR). (C) Differential expression of selected targets in the emergent emm92 background relative to the historical MGAS270 genomic background (i.e., emergent emm92 and isogenic ΔICE relative to MGAS270) and (D) in the emergent emm92 background relative to the ICE(+) historical mutant (MGAS270+ICE) adherent to HEK measured by qRT-PCR. Compared GAS strains were allowed to adhere to HEK (MOI 100:1), grown for 2 h in biological quadruplicate and transcript levels were measured in triplicate for each target. Mean Log2 fold change in transcript level relative to comparison strain is plotted (y axis) with 95% confidence interval (error bars) for each gene target (x axis). Differentially expressed genes (≥1.5-fold relative to comparison strain) and statistical significance are indicated (#, P < 0.0001; ***, P < 0.001; **, P < 0.01; *, P < 0.05; ns = not significant; Student's t test).

Similar articles

Cited by

References

    1. Queck SY, Khan BA, Wang R, Bach T-HL, Kretschmer D, Chen L, Kreiswirth BN, Peschel A, Deleo FR, Otto M. 2009. Mobile genetic element-encoded cytolysin connects virulence to methicillin resistance in MRSA. PLoS Pathog 5:e1000533. 10.1371/journal.ppat.1000533. - DOI - PMC - PubMed
    1. Farzand R, Rajakumar K, Barer MR, Freestone PPE, Mukamolova GV, Oggioni MR, O'Hare HM. 2021. A Virulence Associated Siderophore Importer Reduces Antimicrobial Susceptibility of. Front Microbiol 12:607512. 10.3389/fmicb.2021.607512. - DOI - PMC - PubMed
    1. Anderson SE, Chin CY, Weiss DS, Rather PN. 2020. Copy number of an integron-encoded antibiotic resistance locus regulates a virulence and opacity switch in Acinetobacter baumannii AB5075. mBio 11. 10.1128/mBio.02338-20. - DOI - PMC - PubMed
    1. Barnett TC, Bowen AC, Carapetis JR. 2018. The fall and rise of Group A. Epidemiol Infect 147:e4. 10.1017/S0950268818002285. - DOI - PMC - PubMed
    1. Beres SB, Sylva GL, Barbian KD, Lei B, Hoff JS, Mammarella ND, Liu M-Y, Smoot JC, Porcella SF, Parkins LD, Campbell DS, Smith TM, McCormick JK, Leung DYM, Schlievert PM, Musser JM. 2002. Genome sequence of a serotype M3 strain of Group A Streptococcus: phage-encoded toxins, the high-virulence phenotype, and clone emergence. Proc Natl Acad Sci USA 99:10078–10083. 10.1073/pnas.152298499. - DOI - PMC - PubMed

Publication types