

The Bladder Microbiome, Metabolome, Cytokines, and Phenotypes in Patients with Systemic Lupus Erythematosus
- PMID: 35913213
- PMCID: PMC9620774
- DOI: 10.1128/spectrum.00212-22
The Bladder Microbiome, Metabolome, Cytokines, and Phenotypes in Patients with Systemic Lupus Erythematosus
Abstract
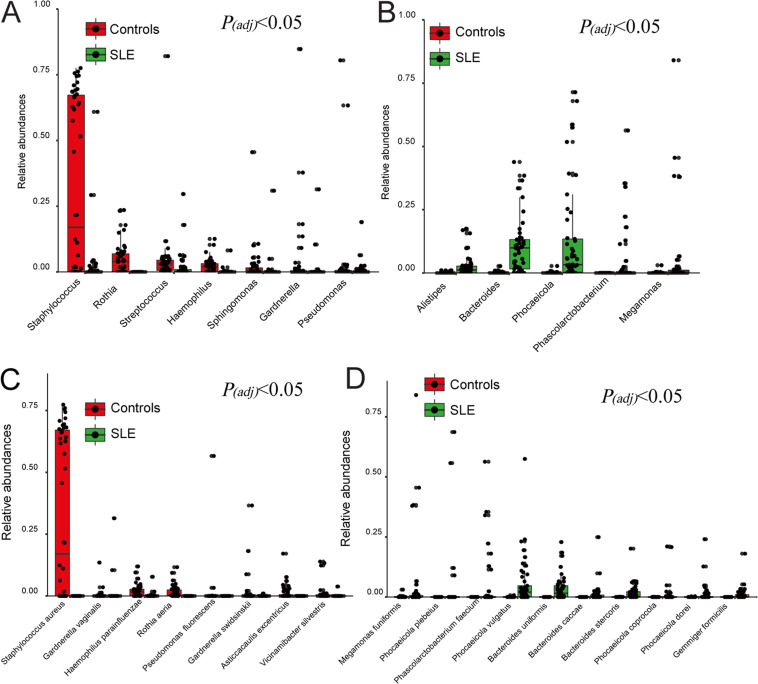
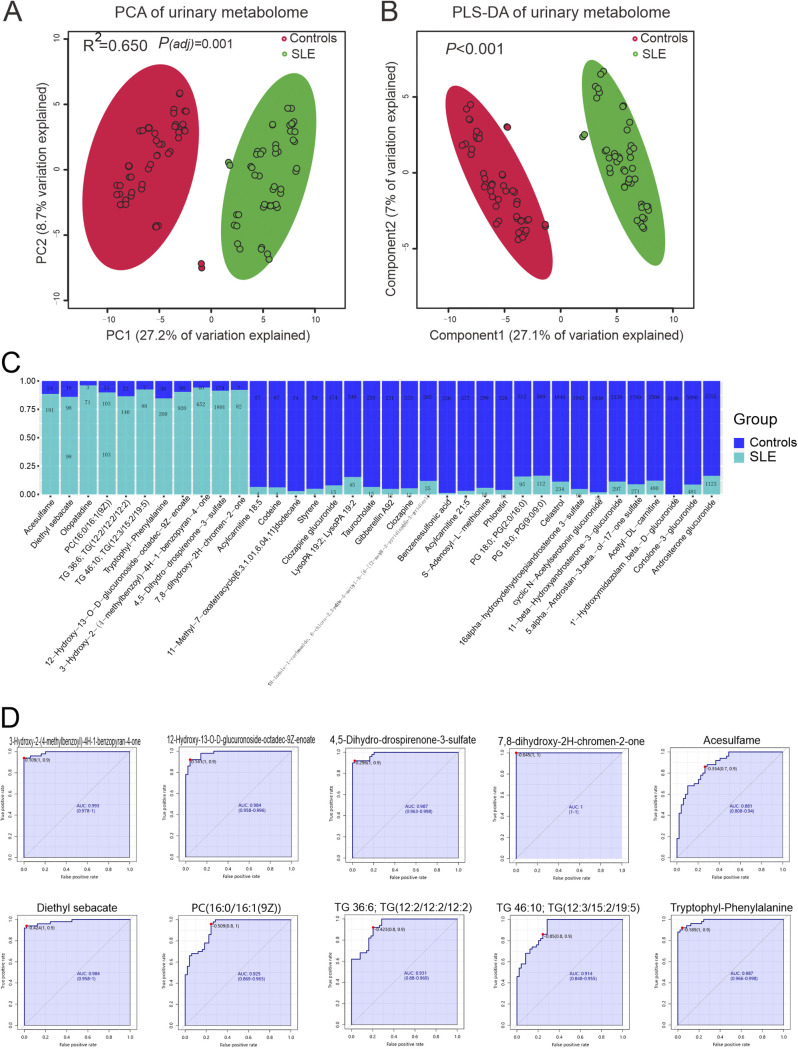
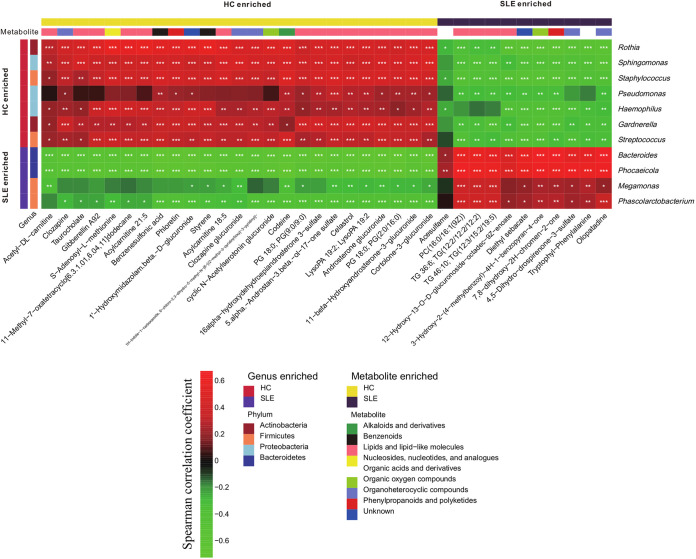
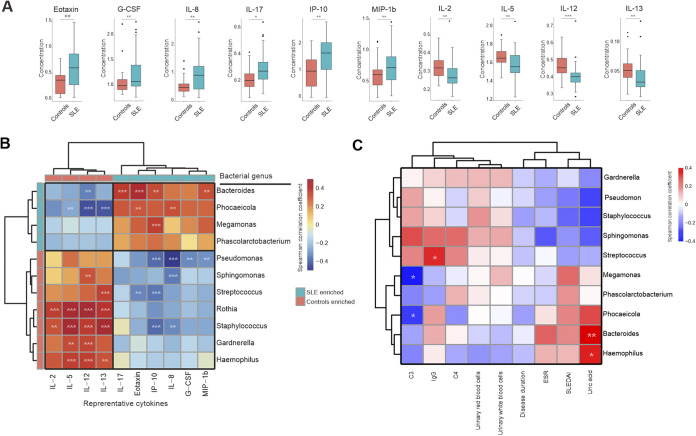
Emerging studies reveal unique bacterial communities in the human bladder, with alteration of composition associated to disease states. Systemic lupus erythematosus (SLE) is a complex autoimmune disease that is characterized by frequent impairment of the kidney. Here, we explored the bladder microbiome, metabolome, and cytokine profiles in SLE patients, as well as correlations between microbiome and metabolome, cytokines, and disease profiles. We recruited a group of 50 SLE patients and 50 individually matched asymptomatic controls. We used transurethral catheterization to collect urine samples, 16S rRNA gene sequencing to profile bladder microbiomes, and liquid chromatography-tandem mass spectrometry to perform untargeted metabolomic profiling. Compared to controls, SLE patients possessed unique bladder microbial communities and increased alpha diversity. These differences were accompanied by differences in urinary metabolomes, cytokines, and patients' disease profiles. The SLE-enriched genera, including Bacteroides, were positively correlated with several SLE-enriched metabolites, including olopatadine. The SLE-depleted genera, such as Pseudomonas, were negatively correlated to SLE-depleted cytokines, including interleukin-8. Alteration of the bladder microbiome was associated with disease profile. For example, the genera Megamonas and Phocaeicola were negatively correlated with serum complement component 3, and Streptococcus was positively correlated with IgG. Our present study reveals associations between the bladder microbiome and the urinary metabolome, cytokines, and disease phenotypes. Our results could help identify biomarkers for SLE. IMPORTANCE Contrary to dogma, the human urinary bladder possesses its own unique bacterial community with alteration of composition associated with disease states. Systemic lupus erythematosus (SLE) is a complex autoimmune disease often characterized by kidney impairment. Here, we explored the bladder microbiome, metabolome, and cytokine profiles in SLE patients, as well as correlations between the microbiome and metabolome, cytokines, and disease profiles. Compared to controls, SLE patients possessed a unique bladder microbial community and elevated alpha diversity. These differences were accompanied by differences in bladder metabolomes, cytokines, and patients' disease profiles. SLE-enriched genera were positively correlated with several SLE-enriched metabolites. SLE-depleted genera were negatively correlated to SLE-depleted cytokines. Alteration of the bladder microbiome was associated with disease profile. Thus, our study reveals associations between the bladder microbiome and the bladder metabolome, cytokines, and disease phenotypes. These results could help identify biomarkers for SLE.
Keywords: bladder microbiome; complement; disease profile; systemic lupus erythematosus; urinary cytokines; urinary metabolome.
Conflict of interest statement
The authors declare no conflict of interest.
Figures

Similar articles
-
Alterations of the fecal and vaginal microbiomes in patients with systemic lupus erythematosus and their associations with immunological profiles.Front Immunol. 2023 Mar 10;14:1135861. doi: 10.3389/fimmu.2023.1135861. eCollection 2023. Front Immunol. 2023. PMID: 36969178 Free PMC article.
-
Urinary microbiome profiling as a non-invasive tool for identifying biomarkers in systemic lupus erythematosus and lupus nephritis.Front Cell Infect Microbiol. 2024 Dec 3;14:1364333. doi: 10.3389/fcimb.2024.1364333. eCollection 2024. Front Cell Infect Microbiol. 2024. PMID: 39691697 Free PMC article.
-
Uncovering potential biomarkers and metabolic pathways in systemic lupus erythematosus and lupus nephritis through integrated microbiome and metabolome analysis.BMC Microbiol. 2025 May 7;25(1):275. doi: 10.1186/s12866-025-03995-5. BMC Microbiol. 2025. PMID: 40329182 Free PMC article.
-
A Scoping Review of the Positive and Negative Bacteria Associated With the Gut Microbiomes of Systemic Lupus Erythematosus Patients.Cureus. 2024 Apr 3;16(4):e57512. doi: 10.7759/cureus.57512. eCollection 2024 Apr. Cureus. 2024. PMID: 38707123 Free PMC article.
-
Alterations of the microbiome across body sites in systemic lupus erythematosus: A systematic review and meta-analysis.Lupus. 2024 Oct;33(12):1345-1357. doi: 10.1177/09612033241281891. Epub 2024 Sep 11. Lupus. 2024. PMID: 39258896
Cited by
-
Racial Differences in Plasma Microbial Translocation and Plasma Microbiome, Implications in Systemic Lupus Erythematosus Disease Pathogenesis.ACR Open Rheumatol. 2024 Jun;6(6):365-374. doi: 10.1002/acr2.11664. Epub 2024 Apr 2. ACR Open Rheumatol. 2024. PMID: 38563441 Free PMC article.
-
Gut microbiota regulation of T lymphocyte subsets during systemic lupus erythematosus.BMC Immunol. 2024 Jul 8;25(1):41. doi: 10.1186/s12865-024-00632-0. BMC Immunol. 2024. PMID: 38972998 Free PMC article.
-
Megamonas funiformis, Plasma Zonulin, and Sodium Intake Affect C3 Complement Levels in Inactive Systemic Lupus Erythematosus.Nutrients. 2023 Apr 21;15(8):1999. doi: 10.3390/nu15081999. Nutrients. 2023. PMID: 37111218 Free PMC article.
-
Alterations of the fecal and vaginal microbiomes in patients with systemic lupus erythematosus and their associations with immunological profiles.Front Immunol. 2023 Mar 10;14:1135861. doi: 10.3389/fimmu.2023.1135861. eCollection 2023. Front Immunol. 2023. PMID: 36969178 Free PMC article.
-
Urine microbiome in individuals with an impaired immune system.Front Cell Infect Microbiol. 2024 Jan 11;13:1308665. doi: 10.3389/fcimb.2023.1308665. eCollection 2023. Front Cell Infect Microbiol. 2024. PMID: 38274734 Free PMC article. Review.
References
-
- Azzouz D, Omarbekova A, Heguy A, Schwudke D, Gisch N, Rovin BH, Caricchio R, Buyon JP, Alekseyenko AV, Silverman GJ. 2019. Lupus nephritis is linked to disease-activity associated expansions and immunity to a gut commensal. Ann Rheum Dis 78:947–956. doi:10.1136/annrheumdis-2018-214856. - DOI - PMC - PubMed
Publication types
MeSH terms
Substances
LinkOut - more resources
Full Text Sources
Medical
