. 2022 Dec;30(6):2521-2535.
doi: 10.1007/s10787-022-01041-8. Epub 2022 Aug 1.

Modulation of autophagy, apoptosis and oxidative stress: a clue for repurposing metformin in photoaging

Affiliations

Modulation of autophagy, apoptosis and oxidative stress: a clue for repurposing metformin in photoaging

Dalia Kamal Mostafa et al. Inflammopharmacology. 2022 Dec.

Abstract

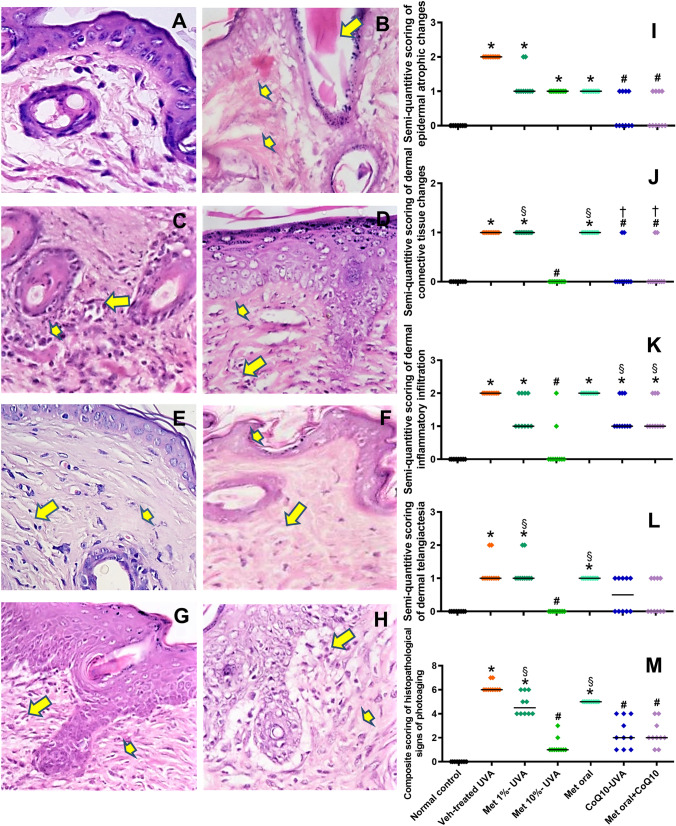
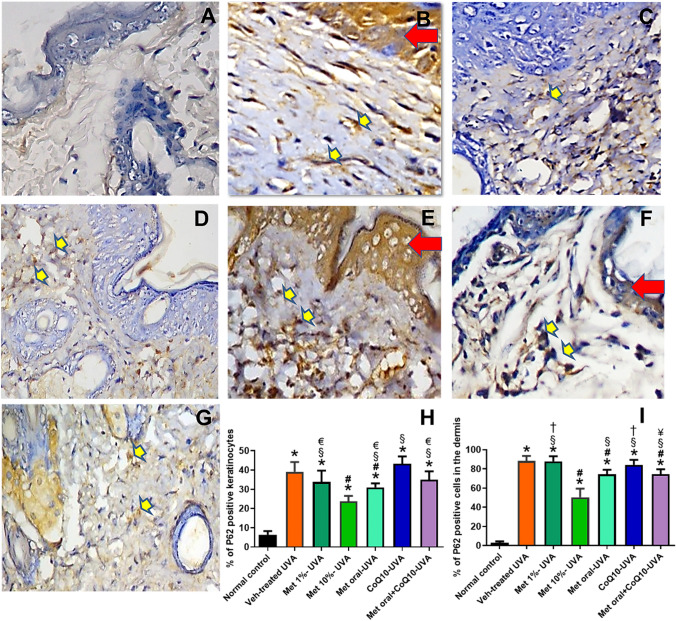
Long-term sun exposure is the commonest cause of photoaging, where mutual interplay between autophagy, oxidative stress, and apoptosis is incriminated. In combating photoaging, pharmacological approaches targeted to modulate autophagy are currently gaining more ground. This study aimed to examine repurposing metformin use in such context with or without the antioxidant coenzyme Q10 (coQ10) in ultraviolet A (UVA) irradiation-induced skin damage. The study was conducted on 70 female CD1 mice that were randomly assigned into seven groups (10/group): normal control, vehicle-treated-UVA-exposed mice, three metformin UVA-exposed groups (Topical 1 and 10%, and oral 300 mg/kg), topical coQ10 (1%)-treated mice, and combined oral metformin with topical coQ10-treated UVA-exposed mice. After UVA-exposure for 10 weeks (3 times/week), macroscopic signs of photoaging were evaluated. Mice were then euthanized, and the skin was harvested for biochemical estimation of markers for oxidative stress, inflammation, matrix breakdown, and lysosomal function. Histopathological signs of photoaging were also evaluated with immunohistochemical detection of associated changes in autophagic and apoptotic markers. Metformin, mainly by topical application, improved clinical and histologic signs of photoaging. This was associated with suppression of the elevated oxidative stress, IL-6, matrix metalloproteinase 1, and caspase, with induction of cathepsin D and subsequent change in anti-LC3 and P62 staining in skin tissue. In addition to metformin antioxidant, anti-inflammatory, and antiapoptotic activities, its anti-photoaging effect is mainly attributed to enhancing autophagic flux by inducing cathepsin D. Its protective effect is boosted by coQ10, which supports their potential use in photoaging.

Keywords: Caspase; Cathepsin D; Coenzyme Q10; Nrf-2; Ultraviolet irradiation.


Conflict of interest statement

The authors have no relevant financial or non-financial interests to disclose.

Figures

Fig. 1
Fig. 1
Clinical evaluation of macroscopic signs of photodamage and skin elasticity. Representative photographs of mice skin of the different groups are shown in (A-C), where set A represents the naked eye appearance of the mice skin and set B represents photos taken under the magnifications of the dermatoscope, while set C represents changes observed on the internal skin surface showing neovascularization, tissue oedema, and signs of inflammation. The deep wrinkles are illustrated in the skin of vehicle-treated UVA-exposed mice. Note the delayed skin relaxation after release from pinching as demarcated by the arrow. Attenuation of these wrinkles is observed with Met 10%, CoQ10- treatment, and the combined treated group. Statistical analysis of semi-quantitative scoring for the macroscopic signs of photoaging is presented by a scatter plot of individual values and medians (transverse lines) in (D), while results of assessment of pinch test time as a marker of skin elasticity is demonstrated as means ± SD in (E). * P < 0.05 versus normal control, # P < 0.05 versus veh-treated UVA group, § P < 0.05 versus Met 10%-UVA group, † P < 0.05 versus Met oral-UVA group. UVA ultraviolet A irradiation, Veh vehicle, Met, metformin, CoQ10 coenzyme Q10
Fig. 2
Fig. 2
Effect of drug treatment on UVA-induced change in oxidative redox state, and IL-6 and MMP-1 in skin. Drug treatment reduced MDA in all mice groups (A), increased GSH except in coQ10-treated mice (B), normalized skin IL-6 (C), and variably inhibited skin MMP-1 (D). * P < 0.05 versus normal control, # P < 0.05 versus veh-treated UVA group, § P < 0.05 versus Met 10%-UVA group, †, P < 0.05 versus Met oral-UVA group. MDA malondialdehyde, GSH reduced glutathione, MMP-1 metalloproteinase-1, UVA ultraviolet A irradiation, Veh vehicle, Met metformin, CoQ10 coenzyme Q10
Fig. 3
Fig. 3
Representative immunoblots of skin cathepsin D and Nrf-2 with their quantitative evaluation. Total proteins were analysed using antibodies against cathepsin D or Nrf-2. β-actin was used as control for protein loading (A). Quantification of both proteins by image J are plotted as a ratio to β-actin in (B) and (C), respectively. * P < 0.05 versus normal control; # P < 0.05 versus veh-treated UVA group, § P < 0.05 versus Met 10%-UVA group, P < 0.05 versus Met oral-UVA group. UVA ultraviolet A irradiation, Veh vehicle, Met metformin, CoQ10 coenzyme Q10
Fig. 4
Fig. 4
Effect of the treating drugs on the microscopic signs of photoaging. Representative photomicrographs of light microscopic picture of H&E-stained skin tissue sections (Mic. Mag. × 200), showing skin of normal control mouse with unremarkable epidermis and dermis and few scattered dermal lymphocytes in (A). Tissue sample of the vehicle-treated UVA-exposed mice shows the atrophic epidermal changes with keratin plugs (arrows) and degenerated dermal collagen fibers (small arrow) in (B). Exposed ectactic dermal blood vessels (small arrow) and dense dermal lymphocytic infiltration (arrow) are shown in (C). D represents the skin of a metformin 1%-treated mouse showing average thickness of the epidermis with mild dermal lymphocytic infiltration (arrow) and degenerated vacuolated dermal collagen (small arrow). In E, almost normal epidermis with minimal dermal lymphocytic infiltration (arrow) and restored dermal collagen are observed in section form metformin 10%-treated mouse. The oral metformin treatment group is represented in F by moderate dermal lymphocytic infiltration (arrow) and slight homogenization of the dermal collagen (small arrow). G represents the coQ10-treated group and shows mild lymphocytic infiltration (arrow) with restored dermal collagen (small arrow) with similar findings observed by the combined treatment as shown in (H). The morphometric analysis of the detected histopathological changes in the form of the epidermal atrophic changes, dermal connective tissue, inflammatory and telangiectatic changes. as well as the overall composite skin changes are presented in (I-M), by scatter plots of individual values and medians (transverse lines). * P < 0.05 versus normal control; # P < 0.05 versus veh-treated UVA group; § P < 0.05 versus Met 10%-UVA group, P < 0.05 versus Met oral-UVA group. UVA ultraviolet A irradiation, Veh vehicle, Met metformin, CoQ10 coenzyme Q10
Fig. 5
Fig. 5
Immunohistochemical staining of LC3 antibody (Mic. Mag. × 200). Representative photomicrographs of immunohistochemical stained skin tissue sections showing negative staining of normal skin in (A). Intense staining of the keratinocytes (red arrows) while moderate staining of the dermal fibroblasts and macrophages (yellow arrows) are shown in (B), which represents the Veh-treated UVA group. Drug treatment variably affected the number of LC3-stained cells in the epidermis and dermis represented from (C-G), as Met 1%, Met 10%, Met oral, CoQ10, and combined Met oral + CoQ10, respectively. Data obtained by software image analysis of the immunohistochemical stained skin sections are represented in (H and I); as mean ± SD of the percentage positive epidermal and dermal cells, respectively. * P < 0.05 versus normal control, # P < 0.05 versus veh-treated UVA group, § P < 0.05 versus Met 10%-UVA group, P < 0.05 versus Met oral-UVA group € P < 0.05 versus CoQ10-treated UVA, ¥ P < 0.05 versus Met 1%-treated UVA. UVA ultraviolet A irradiation, Veh vehicle, Met metformin, CoQ10 coenzyme Q10
Fig. 6
Fig. 6
Immunohistochemical staining of P62 antibody (Mic. Mag. × 200). Representative photomicrographs of immunohistochemical stained skin tissue sections showing faint negligible staining in the epidermis with scattered positive dermal fibroblasts and macrophages in normal skin in (A). Moderate staining of the keratinocytes (red arrows) while intense staining of the dermal fibroblasts and macrophages (yellow arrows) are shown in (B), which represents the Veh-treated UVA group. Variable degrees of reduction of number of P62-stained cells are shown in the skin of the different drug-treated groups represented from (C-G); as Met 1%, Met 10%, Met oral, CoQ10, and combined Met oral + CoQ10, respectively. Data obtained by software image analysis of the immunohistochemical stained skin sections are represented in (H&I); as mean ± SD of the percentage positive epidermal and dermal cells, respectively. * P < 0.05 versus normal control, # P < 0.05 versus veh-treated UVA group, § P < 0.05 versus Met 10%-UVA group, P < 0.05 versus Met oral-UVA group, € P < 0.05 versus CoQ10-treated UVA, ¥ P < 0.05 versus Met 1%-treated UVA. UVA ultraviolet A irradiation, Veh vehicle, Met metformin, CoQ10 coenzyme Q10
Fig. 7
Fig. 7
Immunohistochemical staining of anti-caspase antibody. (Mic. Mag. × 200). Representative photomicrographs of immunohistochemical stained skin tissue sections showing scattered positive cell of normal skin in (A). Intense staining of the keratinocytes (red arrows) as well as the dermal fibroblasts and macrophages (yellow arrows) are shown in (B), which represents the Veh-treated UVA group. Drug treatment reduced the number of anti-caspase-stained cells in the epidermis and dermis represented from (C-G), as Met 1%, Met 10%, Met oral, CoQ10, and combined Met oral + CoQ10, respectively. Data obtained by software image analysis of the immunohistochemical stained skin sections are represented in (H&I), as mean ± SD of the percentage positive epidermal and dermal cells, respectively. * P < 0.05 versus normal control, # P < 0.05 versus veh-treated UVA group, § P < 0.05 versus Met 10%-UVA group, † P < 0.05 versus Met oral-UVA group, € P < 0.05 versus CoQ10-treated UVA, ¥ P < 0.05 versus Met 1%-treated UVA. UVA ultraviolet A irradiation, Veh vehicle, Met metformin, CoQ10 coenzyme Q10

References

    1. Anding AL, Baehrecke EH. Cleaning house: selective autophagy of organelles. Dev Cell. 2017;41(1):10–22. doi: 10.1016/j.devcel.2017.02.016. - DOI - PMC - PubMed
    1. Araoye EF, Thomas JA, Aguh CU. Hair regrowth in 2 patients with recalcitrant central centrifugal cicatricial alopecia after use of topical metformin. JAAD Case Rep. 2020;6(2):106. doi: 10.1016/j.jdcr.2019.12.008. - DOI - PMC - PubMed
    1. Ba W, Xu Y, Yin G, Yang J, Wang R, Chi S, Wang Y, Li C. Metformin inhibits pro-inflammatory responses via targeting nuclear factor-κB in HaCaT cells. Cell Biochem Funct. 2019;37(1):4–10. doi: 10.1002/cbf.3367. - DOI - PubMed
    1. Bryce GF. The effect of UVA irradiation on the mechanical properties of the skin of hairless mice. J Invest Dermatol. 1991;96:584–588.
    1. Bubna AK. Metformin-For the dermatologist. Indian J Pharmacol. 2016;48(1):4–10. doi: 10.4103/0253-7613.174388. - DOI - PMC - PubMed

LinkOut - more resources