. 2022 Oct 6;102(10):pzac104.
doi: 10.1093/ptj/pzac104.

Effects of Neural Mobilization on Sensory Dysfunction and Peripheral Nerve Degeneration in Rats With Painful Diabetic Neuropathy

Affiliations

Effects of Neural Mobilization on Sensory Dysfunction and Peripheral Nerve Degeneration in Rats With Painful Diabetic Neuropathy

Guan-Cheng Zhu et al. Phys Ther. .

Abstract

Objective: This study aims to evaluate the effectiveness of neural mobilization (NM) in the management of sensory dysfunction and nerve degeneration related to experimental painful diabetic neuropathy (PDN).

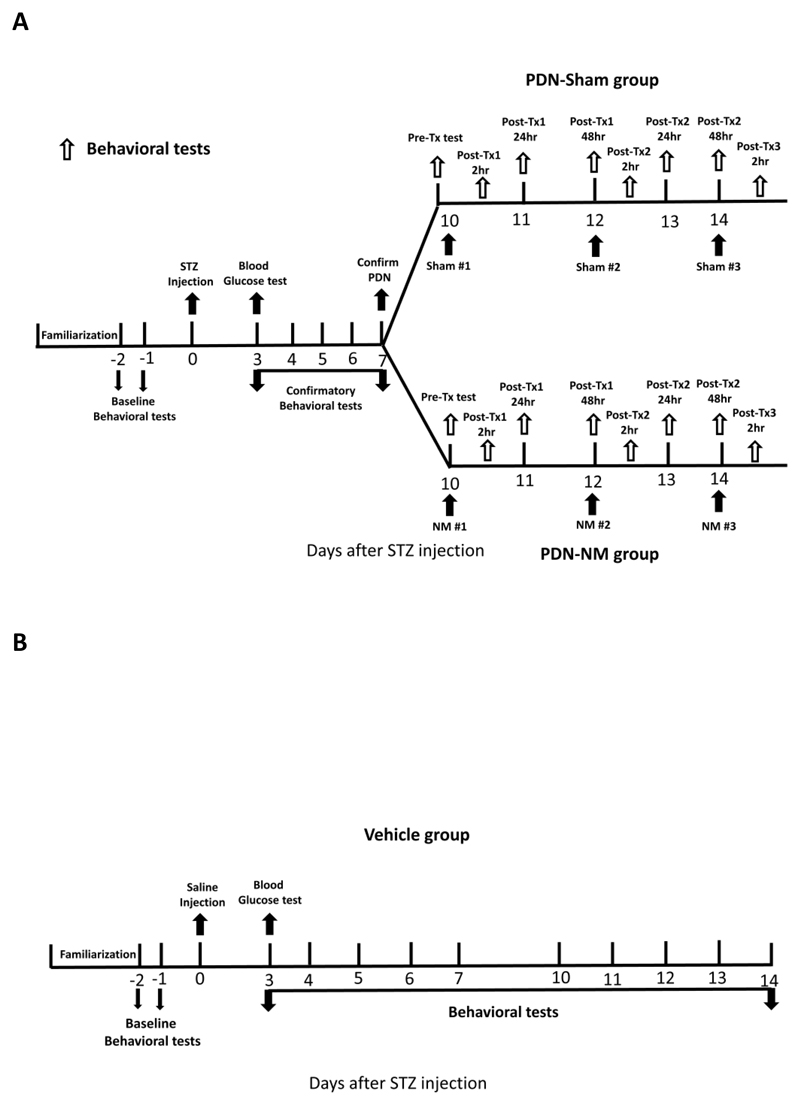
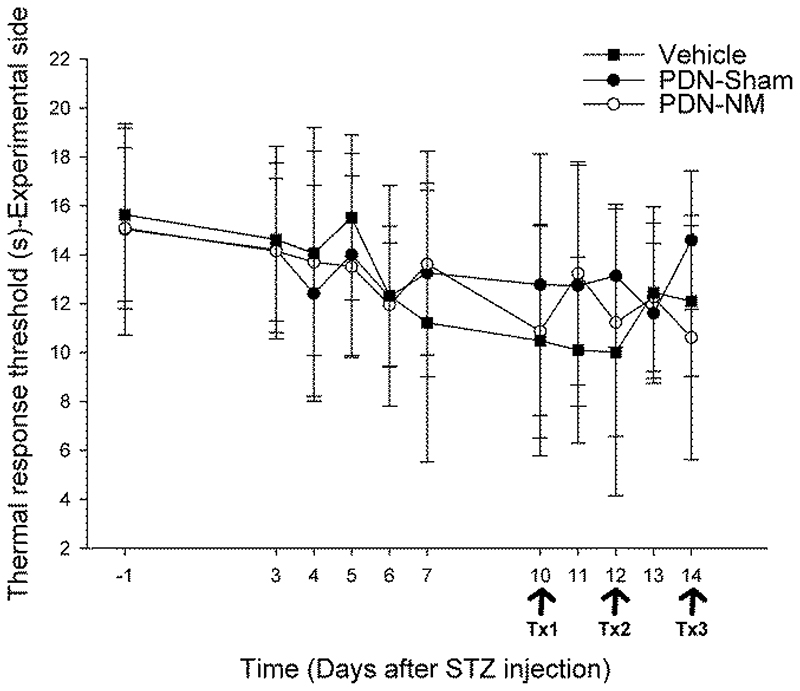
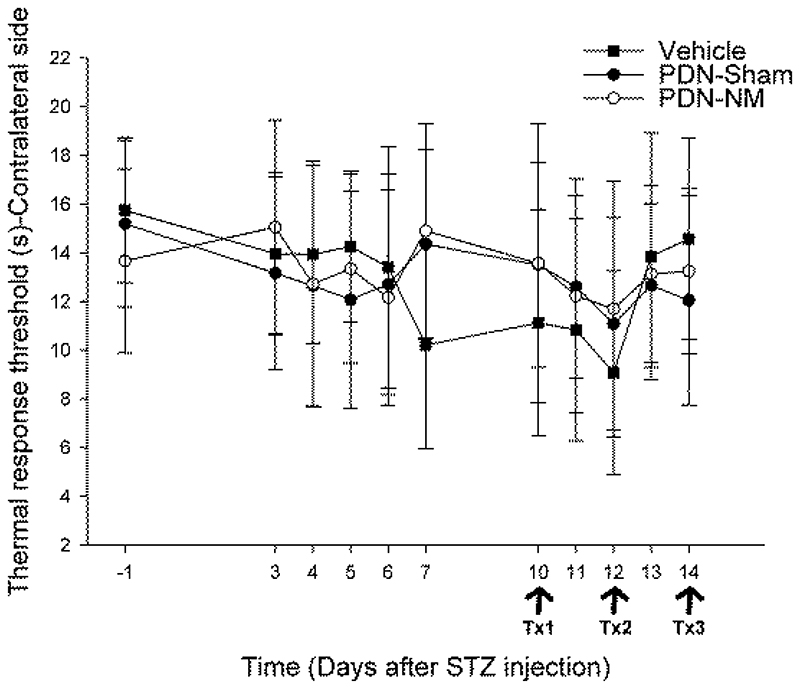
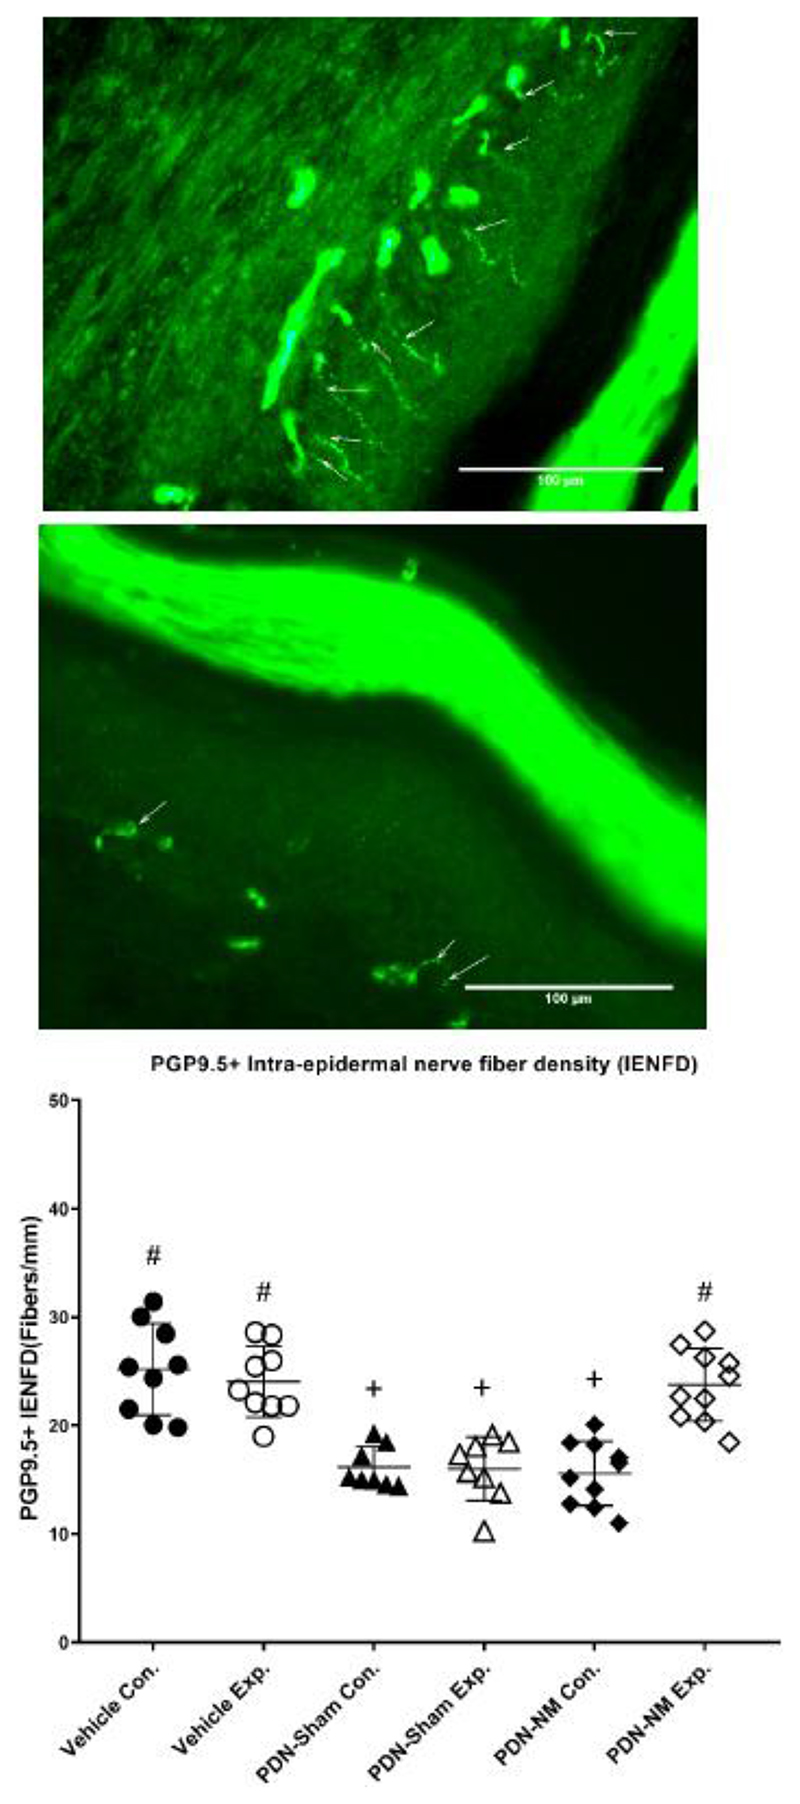
Methods: This is a pre-clinical animal study performed in the streptozocin-induced diabetic rat model. Three groups were included: a treatment group of rats with PDN receiving NM under anesthesia (PDN-NM, n = 10), a sham treatment group of rats with PDN that received only anesthesia (PDN-Sham, n = 9), and a vehicle control group with nondiabetic animals (Vehicle, n = 10). Rats in the PDN-NM and PDN-Sham groups received 1 treatment session on days 10, 12, and 14 after streptozocin injection, with a 48-hour rest period between sessions. Behavioral tests were performed using von Frey and Plantar tests. Evaluation for peripheral nerve degeneration was performed through measuring protein gene product 9.5-positive intra-epidermal nerve fiber density in hind-paw skin biopsies. All measurements were performed by a blinded investigator.

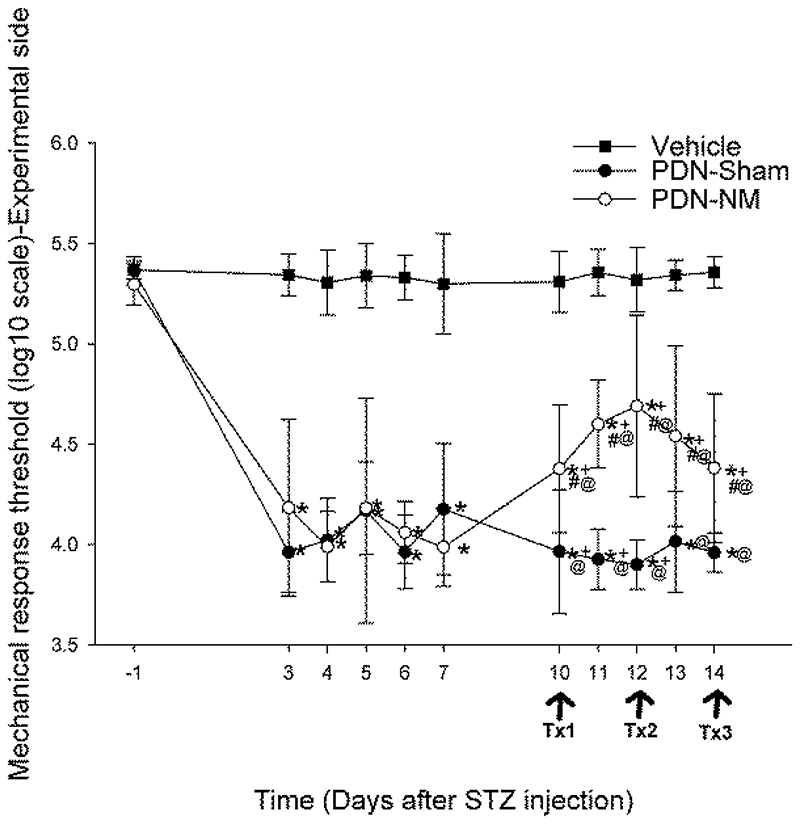
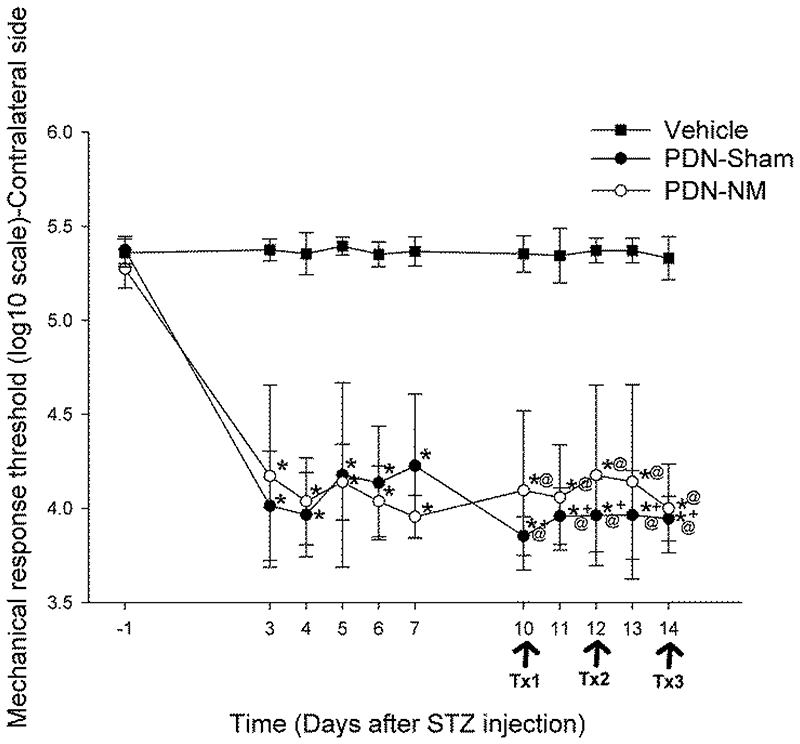
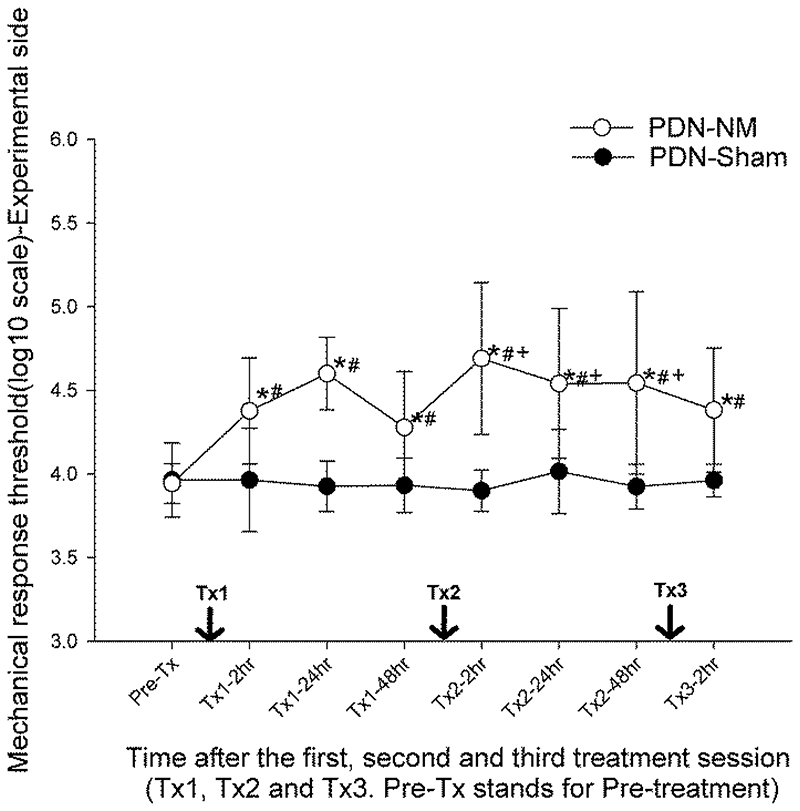
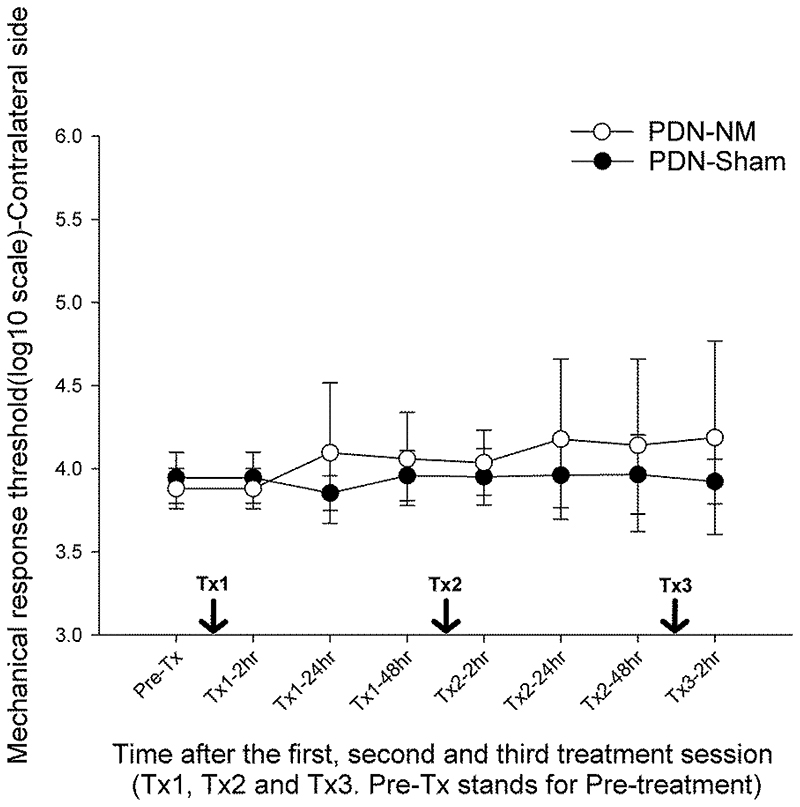
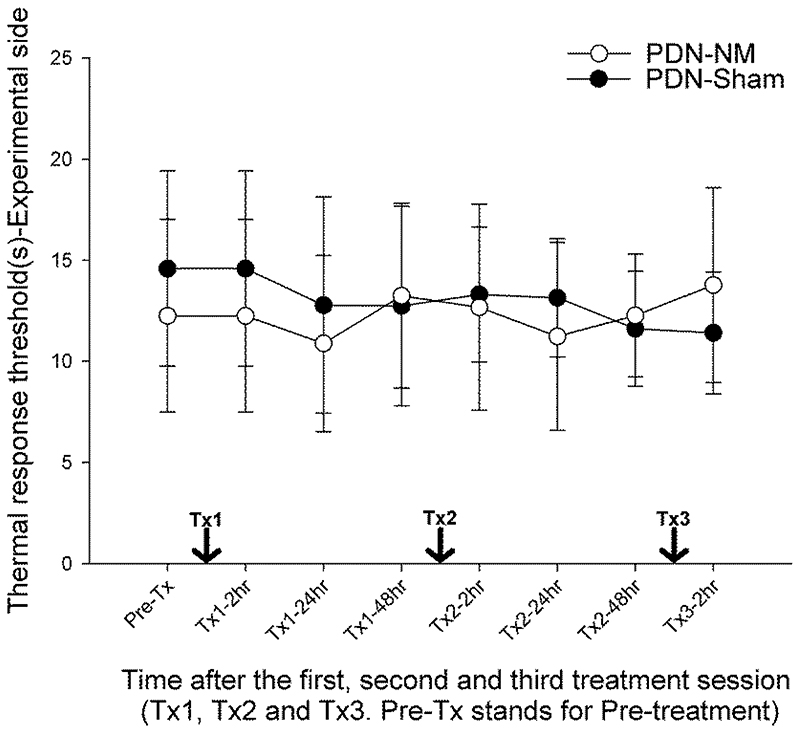
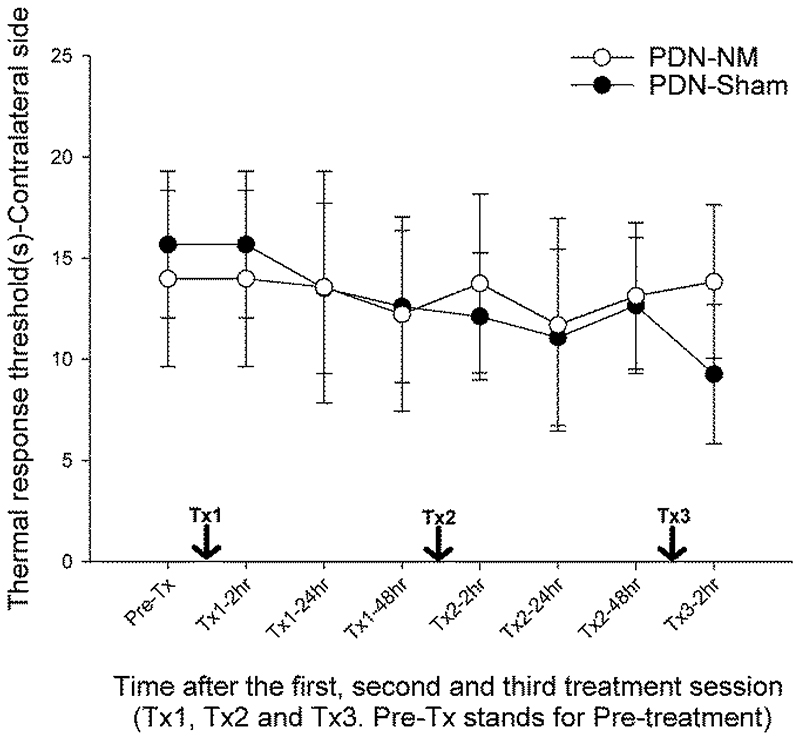
Results: The behavioral tests showed that a single NM session could reduce hyperalgesia, which was maintained for 48 hours. The second treatment session further improved this treatment effect, and the third session maintained it. These results suggest that it requires multiple treatment sessions to produce and maintain hypoalgesic effects. Skin biopsy analysis showed that the protein gene product 9.5-positive intra-epidermal nerve fiber density was higher on the experimental side of the PDN-NM group compared with the PDN-Sham group, suggesting NM may mitigate the degeneration of peripheral nerves.

Conclusion: This study demonstrated that NM may be an effective method to manage experimentally induced PDN, potentially through mitigation of nerve degeneration. Further studies are needed to develop standardized protocols for clinical use.

Impact: These findings provide neurophysiological evidence for the use of NM in PDN and can form the basis for the development of physical therapy-based programs in clinics.

Keywords: Diabetic Neuropathies; Nerve Degeneration; Pain Management.


Conflict of interest statement

Disclosure

The authors completed the ICMJE Form for Disclosure of Potential Conflicts of Interest and reported no conflicts of interest.

Figures

Figure 1
Figure 1. General procedure of this study.
(A) Procedure for rats in the PDN-Sham and PDN-NM groups. After baseline behavioral tests and STZ injection, the rats received 5 days of confirmatory behavioral tests to monitor the development of PDN. The rats with decreased mechanical or thermal response threshold at day-7 post-injection were considered to have developed PDN and were randomly assigned to PDN-Sham or PDN-NM groups. The rats in PDN-Sham and PDN-NM groups received 3 treatment sessions on days 10, 12 and 14 post-STZ injection. Behavioral tests to monitor the treatment effect were performed before each treatment session and at 2, 24, and 48 hours after the first and second treatment session and 2 hours after the third treatment session. (B) Procedure for rats in the Vehicle group. After baseline behavioral tests and saline injection, the rats in the Vehicle group received daily behavioral tests.
Figure 2
Figure 2
Mechanical von Frey (A, B) and thermal plantar test (C, D) data from the experimental (A,C) and contralateral (B,D) paws. The x-axis represents time, y-axis represents the mechanical response threshold (log(10) scale) and thermal response latency (s). Tx1, Tx2 and Tx3 represent the first, second and third treatment session. Data are presented as mean ± standard deviations with 9 rats in PDN-Sham, 10 in PDN-NM, and 10 in Vehicle group. The mechanical response threshold of PDN-Sham and PDN-NM group showed significant reduction after STZ injection (A, B). The rats in the PDN-NM group showed improvement in the mechanical response threshold on the experimental but not contralateral side starting on day-10 after the first treatment session (A). As for the thermal response threshold, no significant differences were apparent between groups. *P < .05 compared to baseline data, +P < .05 compared to pretreatment data from day-7 after STZ injection, #P < .05 compared to PDN-Sham group at the same timepoint, @P < .05 compared to Vehicle group at the same timepoint.
Figure 2
Figure 2
Mechanical von Frey (A, B) and thermal plantar test (C, D) data from the experimental (A,C) and contralateral (B,D) paws. The x-axis represents time, y-axis represents the mechanical response threshold (log(10) scale) and thermal response latency (s). Tx1, Tx2 and Tx3 represent the first, second and third treatment session. Data are presented as mean ± standard deviations with 9 rats in PDN-Sham, 10 in PDN-NM, and 10 in Vehicle group. The mechanical response threshold of PDN-Sham and PDN-NM group showed significant reduction after STZ injection (A, B). The rats in the PDN-NM group showed improvement in the mechanical response threshold on the experimental but not contralateral side starting on day-10 after the first treatment session (A). As for the thermal response threshold, no significant differences were apparent between groups. *P < .05 compared to baseline data, +P < .05 compared to pretreatment data from day-7 after STZ injection, #P < .05 compared to PDN-Sham group at the same timepoint, @P < .05 compared to Vehicle group at the same timepoint.
Figure 3
Figure 3
Fine-grained behavior data in relation to intervention time points. von Frey (A,B) and Plantar (C,D) test data from the experimental (A,C) and contralateral (B,D) side representing the mechanical response threshold (log(10) scale) and thermal response latency (s). The x-axis represents time after treatment sessions. Tx1, 2 and 3 represent first, second and third treatment sessions. Data are presented as mean ± standard deviations with 9 rats in PDN-Sham and 10 in PDN-NM group. The mechanical response threshold on the experimental side of the PDN-NM group increased after the first NM session and was maintained for 48 hours. The second session further increased the mechanical response threshold and was also maintained for 48 hours (A). The third NM session did not further increase but maintain the mechanical response threshold (A). On the contralateral side, no significant differences between PDN-NM and PDN-Sham group were apparent (B). No changes were observed between groups for thermal testing. *P< .05 compared to pretreatment data, +P < .05 compared to behavioral data from 48 hours after first treatment session, #P < .05 compared to PDN-Sham group at the same timepoint.
Figure 3
Figure 3
Fine-grained behavior data in relation to intervention time points. von Frey (A,B) and Plantar (C,D) test data from the experimental (A,C) and contralateral (B,D) side representing the mechanical response threshold (log(10) scale) and thermal response latency (s). The x-axis represents time after treatment sessions. Tx1, 2 and 3 represent first, second and third treatment sessions. Data are presented as mean ± standard deviations with 9 rats in PDN-Sham and 10 in PDN-NM group. The mechanical response threshold on the experimental side of the PDN-NM group increased after the first NM session and was maintained for 48 hours. The second session further increased the mechanical response threshold and was also maintained for 48 hours (A). The third NM session did not further increase but maintain the mechanical response threshold (A). On the contralateral side, no significant differences between PDN-NM and PDN-Sham group were apparent (B). No changes were observed between groups for thermal testing. *P< .05 compared to pretreatment data, +P < .05 compared to behavioral data from 48 hours after first treatment session, #P < .05 compared to PDN-Sham group at the same timepoint.
Figure 4
Figure 4
PGP9.5+ intraepidermal nerve fiber density for the glabrous paw skin. Figures (A) and (B) represent the PGP9.5 immunohistochemical staining of a representative skin section on the experimental (A) and contralateral side (B) of an animal in the PDN-NM group. Arrows indicate PGP9.5+ nerve fibers crossing the dermal/epidermal border into the epidermis. Figure C illustrate the quantification of PGP9.5+ IENFD of the experimental and contralateral paw skin in the Vehicle, PDN-Sham and PDN-NM groups. Data are presented as mean ± standard deviation for 9 rats in the Vehicle, 8 rats in the PDN-Sham and 10 rats in the PDN-NM group. Whereas IENFD was reduced in both experimental and contralateral sides of the PDN-Sham group and the contralateral side of PDN-NM group, the IENFD on the experimental side of the PDN-NM group was comparable to the Vehicle group. Con.= contralateral side, Exp.= experiment side. + P < .05 compared to the same side of the Vehicle group, # P < .05 compared to the same side of the PDN-Sham group.

Similar articles

Cited by

References

    1. Davies M, Brophy S, Williams R, Taylor A. The prevalence, severity, and impact of painful diabetic peripheral neuropathy in type 2 diabetes. Diabetes Care. 2006;29:1518–1522. - PubMed
    1. Benbow SJ, Wallymahmed ME, MacFarlane IA. Diabetic peripheral neuropathy and quality of life. QJM. 1998;91:733–737. - PubMed
    1. Calcutt NA, Backonja MM. Pathogenesis of pain in peripheral diabetic neuropathy. Curr Diab Rep. 2007;7:429–434. - PubMed
    1. Adler AI, Boyko EJ, Ahroni JH, Smith DG. Lower-extremity amputation in diabetes. The independent effects of peripheral vascular disease, sensory neuropathy, and foot ulcers. Diabetes Care. 1999;22:1029–1035. - PubMed
    1. Callaghan BC, Cheng HT, Stables CL, Smith AL, Feldman EL. Diabetic neuropathy: clinical manifestations and current treatments. Lancet Neurol. 2012;11:521–534. - PMC - PubMed

Publication types