. 2022 Aug 11;126(31):5781-5792.
doi: 10.1021/acs.jpcb.2c03557. Epub 2022 Aug 1.

Spatial Organization of Dectin-1 and TLR2 during Synergistic Crosstalk Revealed by Super-resolution Imaging

Affiliations

Spatial Organization of Dectin-1 and TLR2 during Synergistic Crosstalk Revealed by Super-resolution Imaging

Miao Li et al. J Phys Chem B. .

Abstract

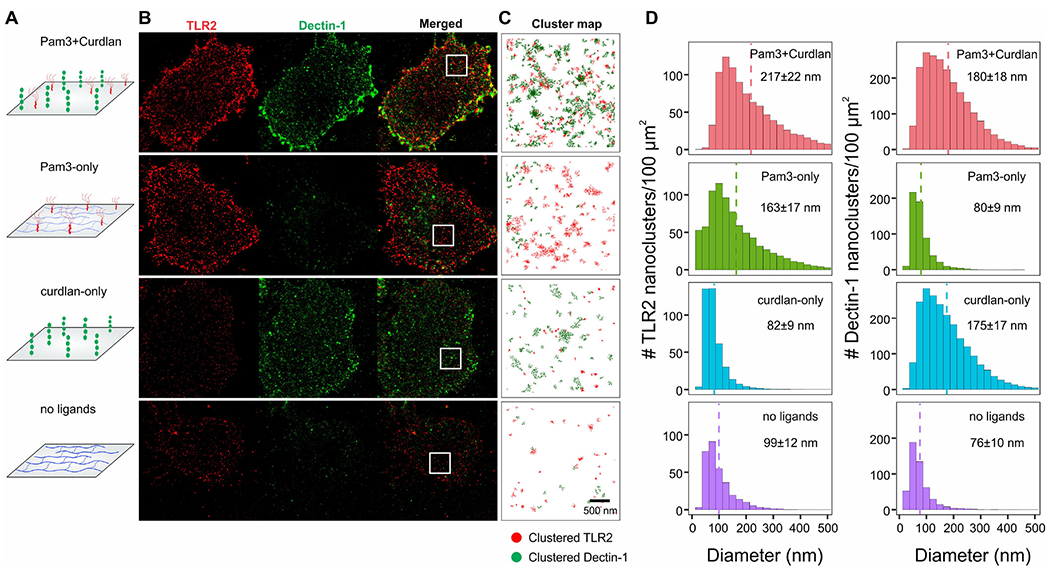
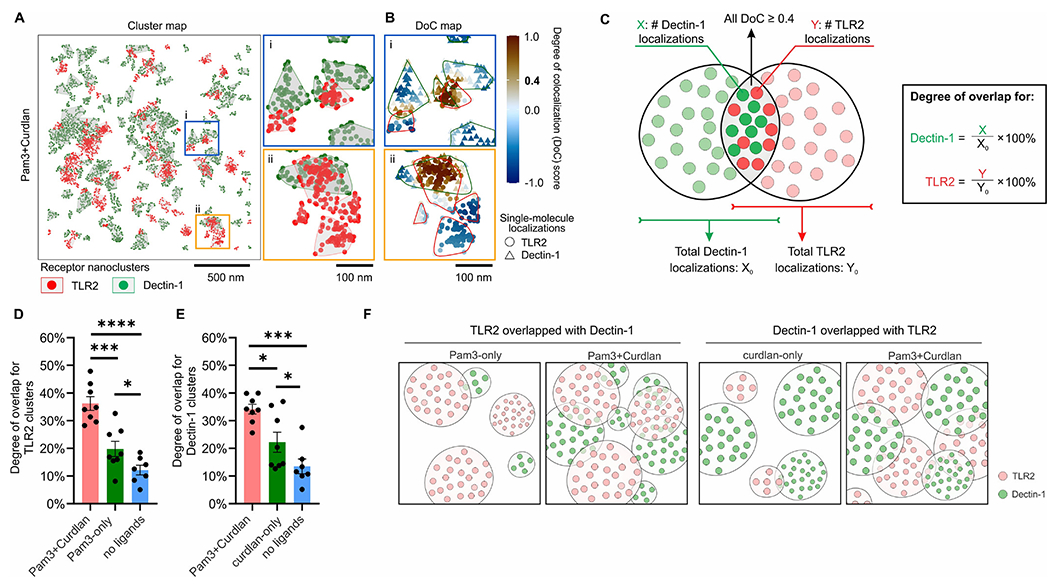
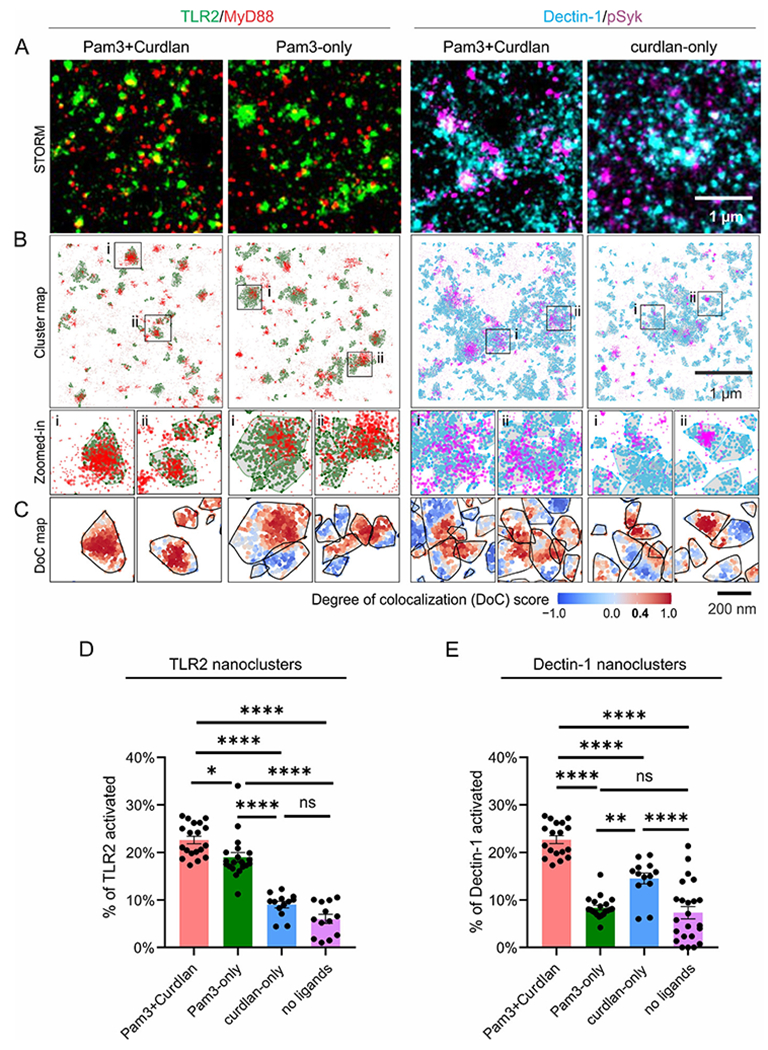
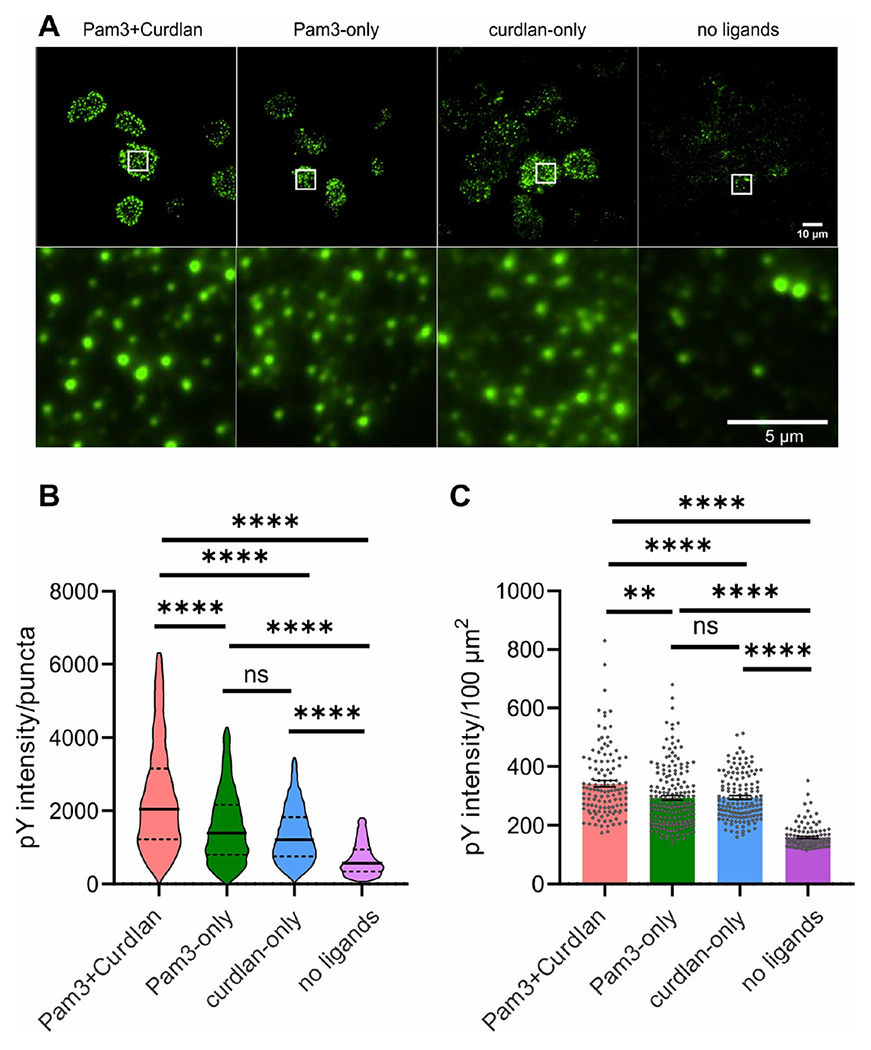
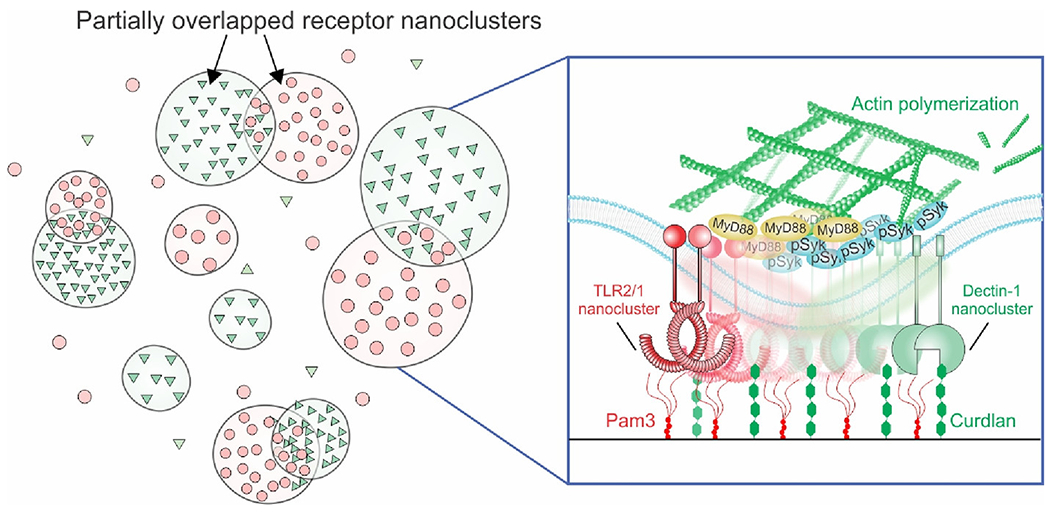
Innate immune cells recognize and elicit responses against pathogens by integrating signals from different types of cell-surface receptors. How the receptors interact in the membrane to enable their signaling crosstalk is poorly understood. Here, we reveal the nanoscale organization of TLR2 and Dectin-1, a receptor pair known to cooperate in regulating antifungal immunity, through their synergistic signaling crosstalk at macrophage cell membranes. Using super-resolution single-molecule localization microscopy, we show that discrete noncolocalized nanoclusters of Dectin-1 and TLR2 are partially overlapped during their synergistic crosstalk. Compared to when one type of receptor is activated alone, the simultaneous activation of Dectin-1 and TLR2 leads to a higher percentage of both receptors being activated by their specific ligands and consequently an increased level of tyrosine phosphorylation. Our results depict, in nanoscale detail, how Dectin-1 and TLR2 achieve synergistic signaling through the spatial organization of their receptor nanoclusters.


Conflict of interest statement

The authors declare no competing financial interest.

Figures

Figure 1.
Figure 1.
Nanoscale organization of TLR2 and Dectin-1 in macrophage cell membranes on various substrates. (A) Schematic illustration of the three different kinds of ligand-coated substrates and a control substrate. (B) Two-color dSTORM images of immunofluorescently labeled TLR2 and Dectin-1 in RAW264.7 cell membranes that were in contact with ligand-coated and control substrates. Cells were seeded on substrates for 10 min before fixation. (C) Cluster maps show a magnified view of the distribution of receptor nanoclusters within the areas outlined by white boxes (3 × 3 μm) shown in panel B. Receptor clusters were identified using the topological mode analysis tool (ToMATo) method. Single-molecule localizations of TLR2 (red dots) and Dectin-1 (green dots) in clusters. (D) Histograms showing the surface densities of TLR2 (left) and Dectin-1 (right) nanoclusters at given cluster diameters. Dotted vertical lines indicate the average cluster diameter of each type of receptors. The legend in each graph indicates mean ± SEM of N cells from three independent experiments. For TLR2 nanoclusters, N = 28 cells (Pam3 + Curdlan), 26 cells (Pam3-only), 22 cells (curdlan-only), and 22 cells (no ligands). For Dectin-1 nanoclusters, N = 41 cells (Pam3 + Curdlan), 36 cells (Pam3-only), 42 cells (curdlan-only), and 29 cells (no ligands).
Figure 2.
Figure 2.
Quantification of spatial overlap between TLR2 and Dectin-1 nanoclusters. (A) Cluster maps of TLR2 and Dectin-1 in RAW264.7 cell membranes in contact with the curdlan-Pam3 substrates. Cells were seeded for 10 min before fixation. Single-molecule localizations of TLR2 (red dots) and Dectin-1 (green dots) are indicated. (B) Degree of colocalization (DoC) analysis of TLR2 and Dectin-1 single-molecule localizations within the magnified areas (boxes i and ii) indicated in panel A. DoC scores ranging from −1 to 1 are color-coded and assigned to each localization, with −1 indicating segregation, 0 indicating noncolocalization, and 1 indicating complete overlap. (C) Schematic illustration demonstrating the definition of the degree of overlap between nanoclusters. Quantification of (D) the degree of overlap for TLR2 clusters overlapped with Dectin-1 and (E) that for Dectin-1 clusters overlapped with TLR2. Data are presented as mean ± SEM of N cells from two independent experiments. N = 8 cells from 5 images (Pam3 + Curdlan), 8 cells from 5 images (Pam3-only), 8 cells from 5 images (curdlan-only), and 7 cells from 5 images cells (no ligands). Statistical significance is highlighted by p values as follows: ****p ≤ 0.0001; **p ≤ 0.01; *p ≤ 0.05; ns p > 0.05. (F) Schematic illustration shows that the increased number and size of receptor nanoclusters upon synergistic activation of Dectin-1 and TLR2 can lead to overlap between TLR2 and Dectin-1 nanoclusters.
Figure 3.
Figure 3.
Quantification of the activation of TLR2 and Decitn-1 nanoclusters. (A) Representative two-color dSTORM images of immunofluorescently labeled TLR2 and MyD88 and of immunofluorescently labeled Dectin-1 and pSyk. All cells were seeded on ligand-functionalized glass coverslips for 10 min before fixation. (B) Cluster maps of TLR2 (green) and Dectin-1 (cyan) overlapped with the single-molecule localizations of MyD88 (red) and pSyk (magenta), respectively, corresponding to Raw dSTORM images in panel A. TLR2 and Dectin-1 localizations that were identified as in nanoclusters are enclosed in polygons. (C) Upper portion: degree of colocalization (DoC) analysis of TLR2 and MyD88 and of Dectin-1 and pSyk in areas outlined by boxes i and ii in panel B. Lower portion: Activation of TLR2 or Dectin-1 is indicated by the color-coded DoC scores between TLR2 and MyD88 or Dectin-1 and pSyk, respectively. Receptor nanocluster contours are highlighted with black lines. Quantification of the (D) percentage of activated TLR2 in nanoclusters and (E) percentage of activated Dectin-1 in nanoclusters under different stimulation conditions as indicated. Data are represented as mean ± SEM of N cells from two independent experiments. For TLR2 and MyD88 imaging, N = 19 cells from 8 images (Pam3 + Curdlan), 20 cells from 8 images (Pam3-only), 13 cells from 8 images (curdlan-only), and 13 cells from 6 images (no ligands). For Dectin-1 and pSyk imaging, N = 18 cells from 7 images (Pam3 + Curdlan), 20 cells from 11 images (Pam3-only), 13 cells from 8 images (curdlan), and 23 cells from 7 images (no ligands). Statistical significance is highlighted by p values as follows: ****p ≤ 0.0001; **p ≤ 0.01; *p ≤ 0.05; ns p > 0.05.
Figure 4.
Figure 4.
Effect of receptor activation on phosphotyrosine (pY) signaling. (A) Fluorescence images showing immunostained pY in RAW264.7 macrophage cells after 10 min of incubation on different substrates. Zoom-in images show pY puncta in regions of interest outlined by white boxes. (B) Quantification of fluorescence intensity of individual pY puncta. Data were from two independent experiments and presented as violin plots with median and interquartile range. N = 11,231 puncta from 178 images (Pam3 + Curdlan), 8618 puncta from 123 images (Pam3-only), 7764 puncta from 145 images (curdlan-only), and 853 puncta from 117 images (no ligands). (C) Quantification of pY fluorescence intensity of individual cells. For quantitative comparison, pY intensity of each cell was obtained as intensity per cell area. Data are presented as mean ± SEM obtained from 178 cells (Pam3 + Curdlan), 123 cells (Pam3-only), 145 cells (curdlan-only), and 117 cells (no ligands). Statistical significance is highlighted by p values as follows: ****p ≤ 0.0001; **p ≤ 0.01; *p ≤ 0.05; ns p > 0.05.
Figure 5.
Figure 5.
Schematic illustration showing the nanoscale organization of TLR2 and Dectin-1 receptors at the macrophage surface upon synergistic activation. Upon synergistic stimulation, TLR2 and Dectin-1 receptors organize in partially overlapped nanoclusters. The overlapping interfaces between nanoclusters allow receptors and signaling proteins to interact for signaling crosstalk. Actin polymerization supports the formation of TLR2 and Dectin-1 nanoclusters and their synergistic crosstalk.

Similar articles

Cited by

References

    1. Inoue M; Shinohara ML Clustering of Pattern Recognition Receptors for Fungal Detection. PLoS Pathog. 2014, 10, No. e1003873. - PMC - PubMed
    1. Hajishengallis G; Lambris JD Microbial Manipulation of Receptor Crosstalk in Innate Immunity. Nat. Rev. Immunol 2011, 11, 187–200. - PMC - PubMed
    1. Thaiss CA; Levy M; Itav S; Elinav E Integration of Innate Immune Signaling. Trends Immunol. 2016, 37, 84–101. - PubMed
    1. Vogelpoel LTC; Hansen IS; Rispens T; Muller FJM; van Capel TMM; Turina MC; Vos JB; Baeten DLP; Kapsenberg ML; de Jong EC; et al. Fc Gamma Receptor-TLR Cross-Talk Elicits Pro-Inflammatory Cytokine Production by Human M2 Macrophages. Nat. Commun 2014, 5, 5444. - PMC - PubMed
    1. van Egmond M; Vidarsson G; Bakema JE Cross-Talk between Pathogen Recognizing Toll-Like Receptors and Immunoglobulin Fc Receptors in Immunity. Immunol. Rev 2015, 268, 311–327. - PubMed

Publication types

MeSH terms