

Estimating National Exposures and Potential Bladder Cancer Cases Associated with Chlorination DBPs in U.S. Drinking Water
- PMID: 35913906
- PMCID: PMC9342685
- DOI: 10.1289/EHP9985
Estimating National Exposures and Potential Bladder Cancer Cases Associated with Chlorination DBPs in U.S. Drinking Water
Abstract
Background: Disinfection byproducts (DBPs) in public water systems (PWS) are an unintended consequence resulting from reactions between mostly chlorine-based disinfectants and organic and inorganic compounds in source waters. Epidemiology studies have shown that exposure to DBP (specifically trihalomethanes) was associated with an increased risk of bladder cancer.
Objective: Our goal was to characterize the relative differences in exposures and estimated potential bladder cancer risks for people served by different strata of PWS in the United States and to evaluate uncertainties associated with these estimates.
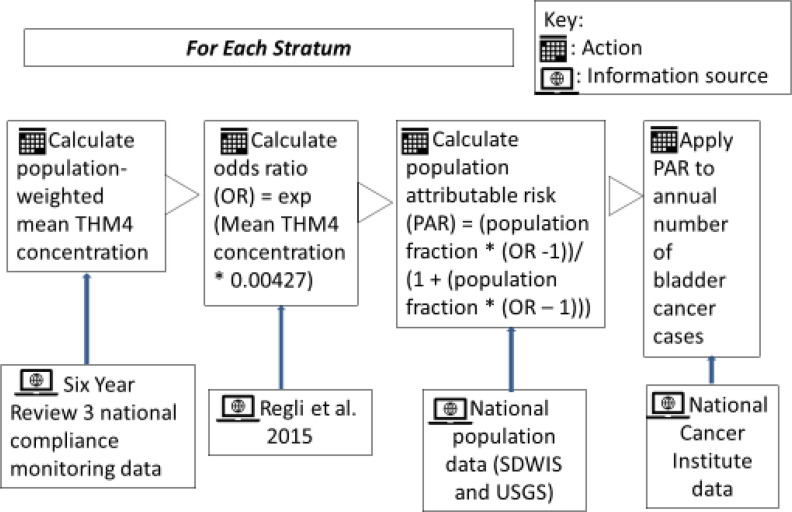
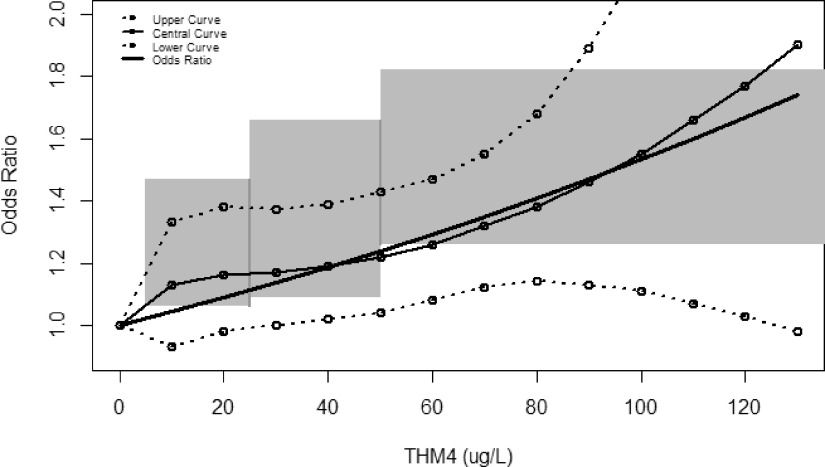
Methods: We stratified PWS by source water type (surface vs. groundwater) and population served (large, medium, and small) and calculated population-weighted mean trihalomethane-4 (THM4) concentrations for each stratum. For each stratum, we calculated a population attributable risk (PAR) for bladder cancer using odds ratios derived from published pooled epidemiology estimates as a function of the mean THM4 concentration and the fraction of the total U.S. population served by each stratum of systems. We then applied the stratum-specific PARs to the total annual number of new bladder cancer cases in the U.S. population to estimate bladder cancer incidence in each stratum.
Results: Our results show that approximately 8,000 of the 79,000 annual bladder cancer cases in the United States were potentially attributable to DBPs in drinking water systems. The estimated attributable cases vary based on source water type and system size. Approximately 74% of the estimated attributable cases were from surface water systems serving populations of people. We also identified several uncertainties that may affect the results from this study, primarily related to the use of THM4 as a surrogate measure for DBPs relevant to bladder cancer.
Discussion: Despite significant reductions in exposure over the past several decades, our study suggests that of the bladder cancer cases in the United States may still be attributed to exposure to DBPs found in drinking water systems. https://doi.org/10.1289/EHP9985.
Figures
Comment in
-
Invited Perspective: Existing Rules for Disinfection By-Products Are Good, but They Are Not Enough.Environ Health Perspect. 2022 Aug;130(8):81302. doi: 10.1289/EHP11187. Epub 2022 Aug 1. Environ Health Perspect. 2022. PMID: 35913907 Free PMC article. No abstract available.
Similar articles
-
Formation potential of disinfection byproducts during chlorination of petroleum hydrocarbon-contaminated drinking water.Chemosphere. 2024 Jun;357:142057. doi: 10.1016/j.chemosphere.2024.142057. Epub 2024 Apr 16. Chemosphere. 2024. PMID: 38636920
-
Association between drinking water disinfection byproducts exposure and human bladder cancer: A time-updated meta-analysis of trihalomethanes.J Hazard Mater. 2025 Jun 15;490:137833. doi: 10.1016/j.jhazmat.2025.137833. Epub 2025 Mar 3. J Hazard Mater. 2025. PMID: 40043398 Review.
-
A review on the 40th anniversary of the first regulation of drinking water disinfection by-products.Environ Mol Mutagen. 2020 Jul;61(6):588-601. doi: 10.1002/em.22378. Epub 2020 Jun 19. Environ Mol Mutagen. 2020. PMID: 32374889 Free PMC article. Review.
-
Relationships between regulated DBPs and emerging DBPs of health concern in U.S. drinking water.J Environ Sci (China). 2022 Jul;117:161-172. doi: 10.1016/j.jes.2022.04.016. Epub 2022 Apr 19. J Environ Sci (China). 2022. PMID: 35725068
-
Trihalomethanes in Drinking Water and Bladder Cancer Burden in the European Union.Environ Health Perspect. 2020 Jan;128(1):17001. doi: 10.1289/EHP4495. Epub 2020 Jan 15. Environ Health Perspect. 2020. PMID: 31939704 Free PMC article.
Cited by
-
Global assessment of chemical quality of drinking water: The case of trihalomethanes.Water Res. 2023 Feb 15;230:119568. doi: 10.1016/j.watres.2023.119568. Epub 2023 Jan 3. Water Res. 2023. PMID: 36621278 Free PMC article.
-
Cytotoxicity Comparison between Drinking Water Treated by Chlorination with Postchloramination versus Granular Activated Carbon (GAC) with Postchlorination.Environ Sci Technol. 2023 Sep 12;57(36):13699-13709. doi: 10.1021/acs.est.3c03591. Epub 2023 Aug 28. Environ Sci Technol. 2023. PMID: 37640368 Free PMC article.
-
Bladder Cancer in Lebanon: An Updated Epidemiological Comparison with Global Regions and a Comprehensive Review of Risk Factors.Cancer Control. 2025 Jan-Dec;32:10732748251330696. doi: 10.1177/10732748251330696. Epub 2025 Apr 1. Cancer Control. 2025. PMID: 40170215 Free PMC article. Review.
-
Pomegranate (Punica granatum L.) Peel Extracts as Antimicrobial and Antioxidant Additives Used in Alfalfa Sprouts.Foods. 2022 Aug 26;11(17):2588. doi: 10.3390/foods11172588. Foods. 2022. PMID: 36076774 Free PMC article.
-
Haloacetonitriles Induce Structure-Related Cellular Toxicity Through Distinct Proteome Thiol Reaction Mechanisms.ACS Environ Au. 2024 Dec 3;5(1):101-113. doi: 10.1021/acsenvironau.4c00068. eCollection 2025 Jan 15. ACS Environ Au. 2024. PMID: 39830722 Free PMC article.
References
-
- U.S. EPA (U.S. Environmental Protection Agency). 2018. Safe Drinking Water Information System (SDWIS) Federal Reporting Services. https://www.epa.gov/ground-water-and-drinking-water/safe-drinking-water-... [accessed 22 February 2018].
-
- U.S. Centers for Disease Control and Prevention. 1999. A Century of Water Chlorination and Treatment: One of the Ten Greatest Public Health Achievements of the 20th Century. MMWR Morb Mortal Wkly Rep 48(29):621–629. https://www.cdc.gov/healthywater/drinking/history.html#:∼:text=A%20Centu... [accessed 5 March 2018].
-
- WHO (World Health Organization). 2018. Developing drinking-water quality regulations and standards; general guidance with a special focus on countries with limited resources. https://www.who.int/publications/i/item/9789241513944 [accessed 10 May 2018].
-
- U.S. EPA. 1998. National Primary Drinking Water Regulations: Disinfectants and Disinfection Byproducts; Final Rule. Fed Reg 63:69390. https://www.govinfo.gov/content/pkg/FR-1998-12-16/pdf/98-32887.pdf#page=1 [accessed 2 January 2018].
-
- McGuire MJ, Karanfil T, Krasner SW, Reckhow DA, Roberson JA, Summers RS, et al. 2014. Not your granddad’s disinfection by-product problems and solutions. J Am Water Works Assoc 106(8), 10.5942/jawwa.2014.106.0128. - DOI
MeSH terms
Substances
LinkOut - more resources
Full Text Sources
Medical
Miscellaneous
