. 2023 Mar;19(3):839-857.
doi: 10.1080/15548627.2022.2105562. Epub 2022 Aug 1.

SDC1-dependent TGM2 determines radiosensitivity in glioblastoma by coordinating EPG5-mediated fusion of autophagosomes with lysosomes

Affiliations

SDC1-dependent TGM2 determines radiosensitivity in glioblastoma by coordinating EPG5-mediated fusion of autophagosomes with lysosomes

Wang Zheng et al. Autophagy. 2023 Mar.

Abstract

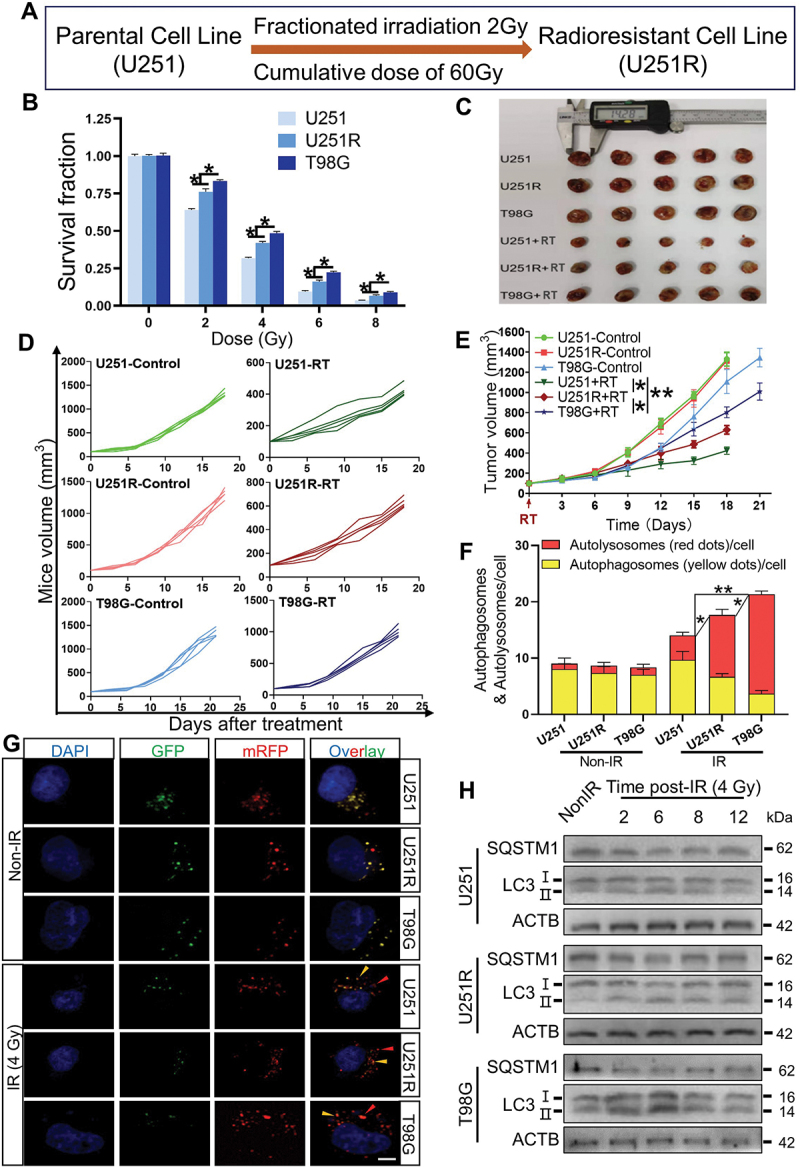
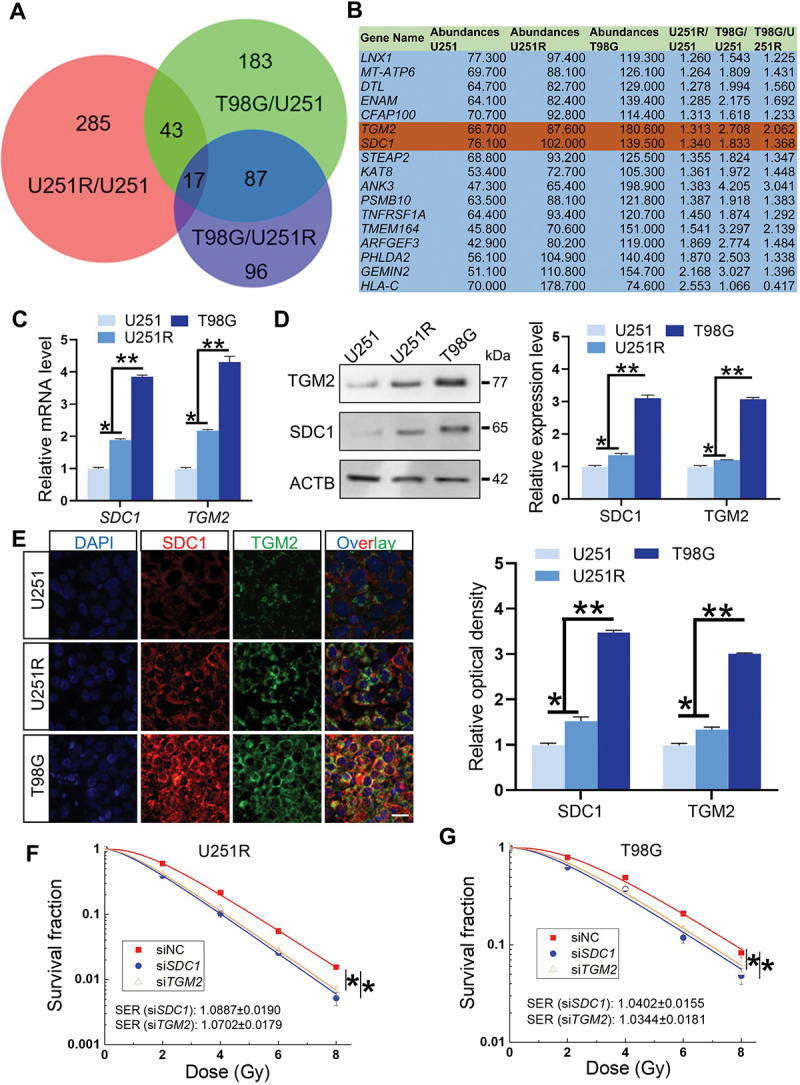
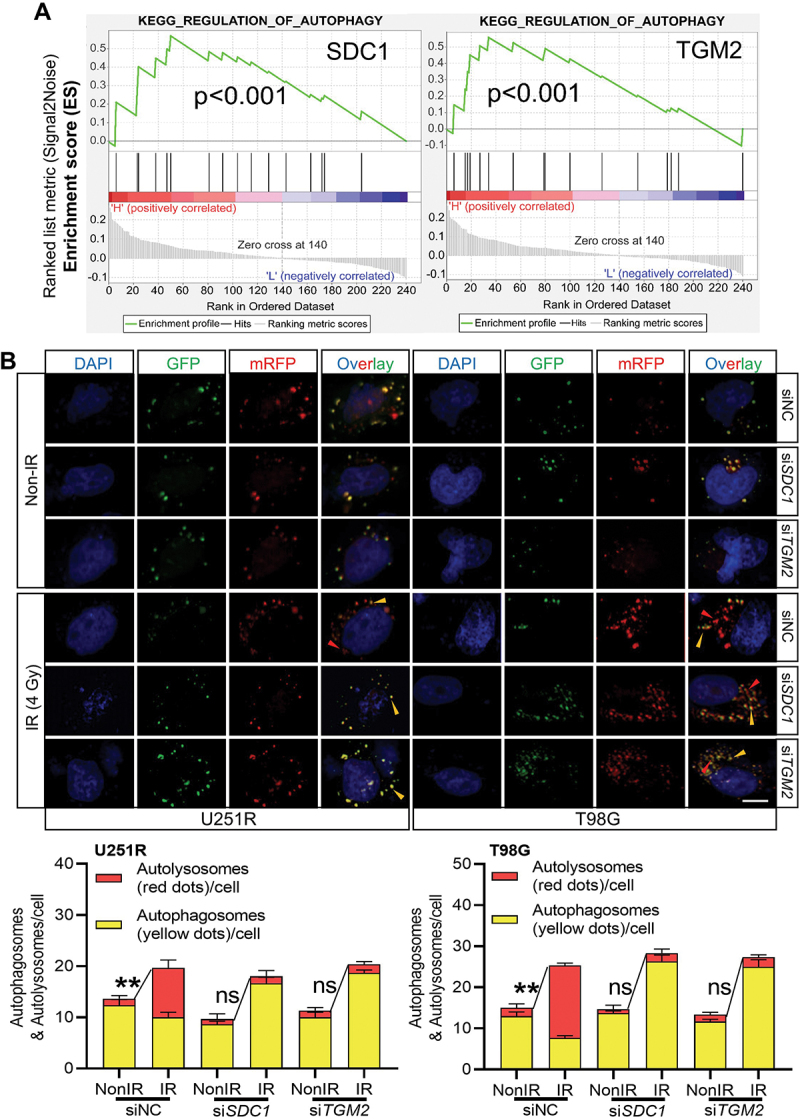
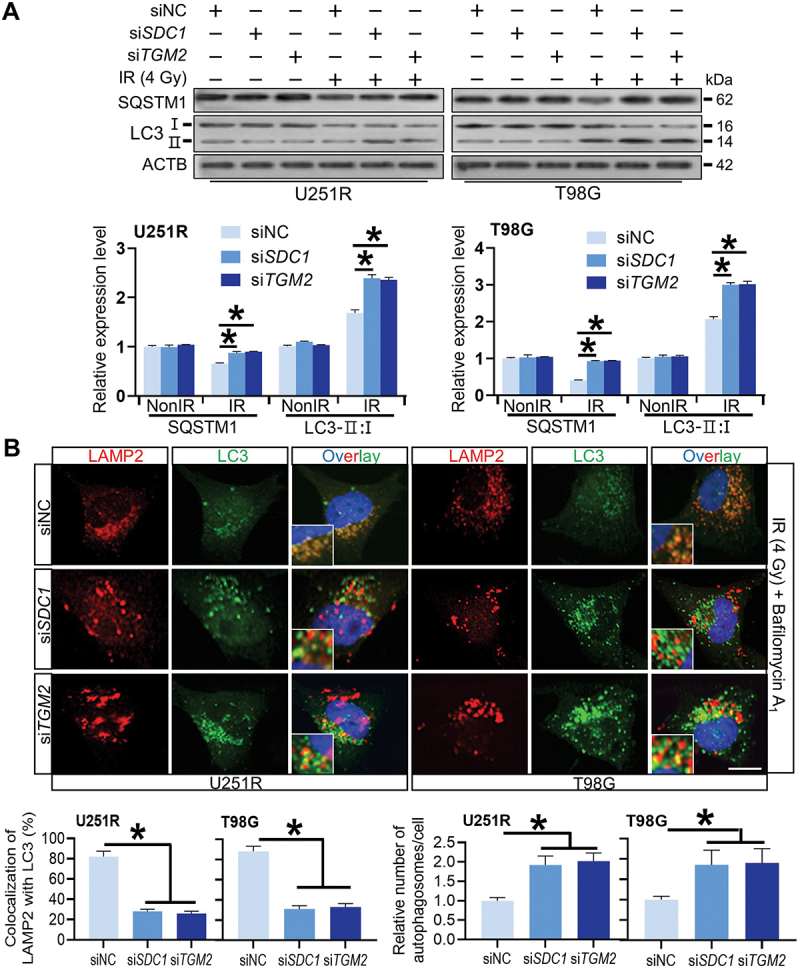
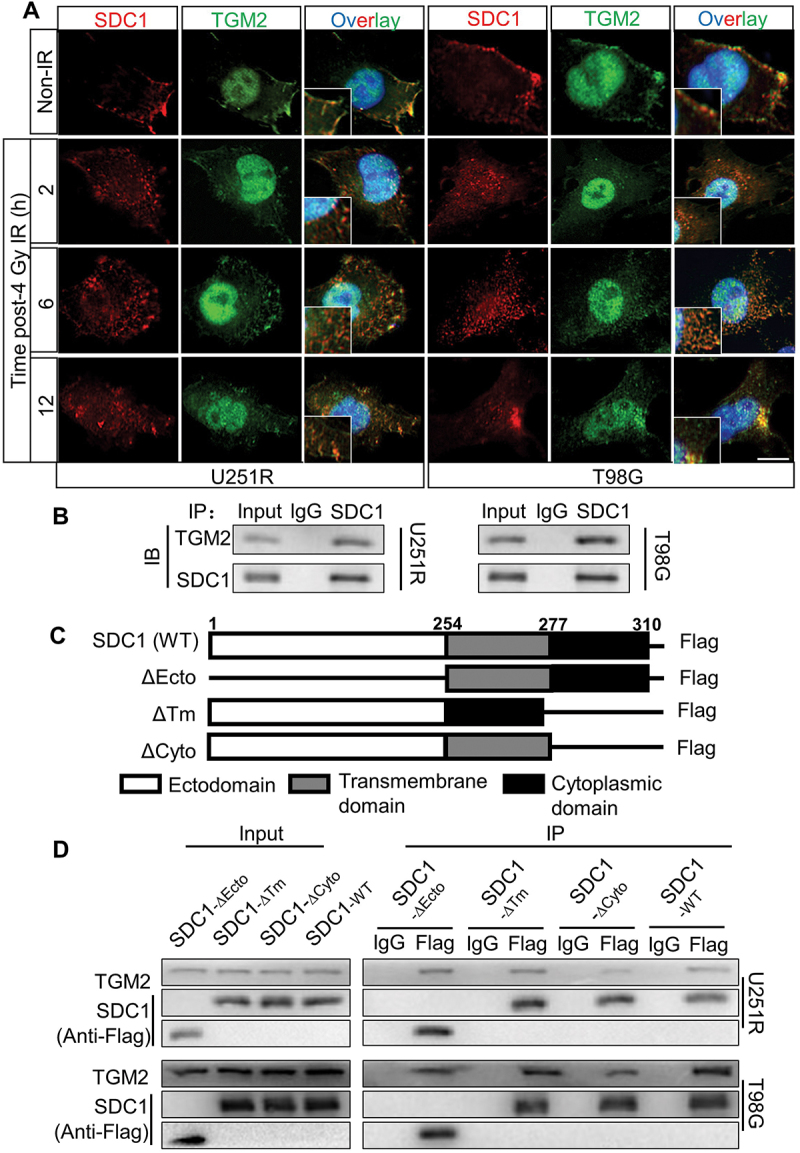
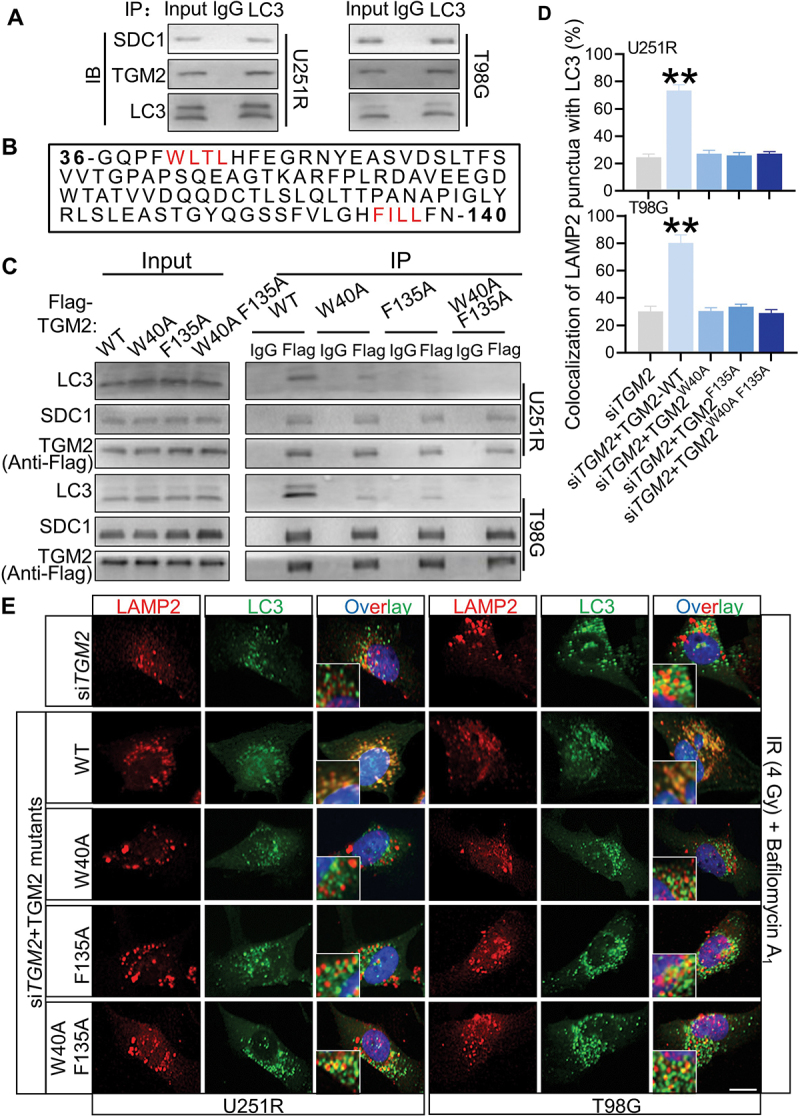
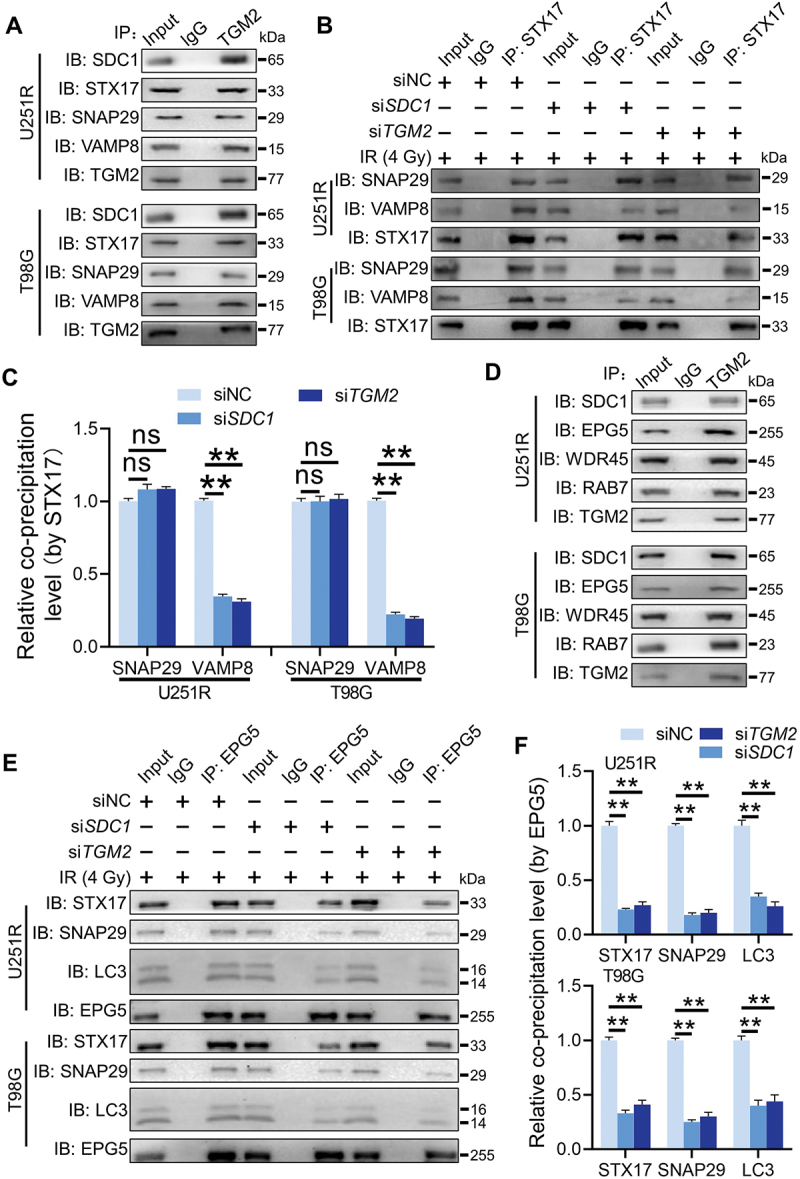
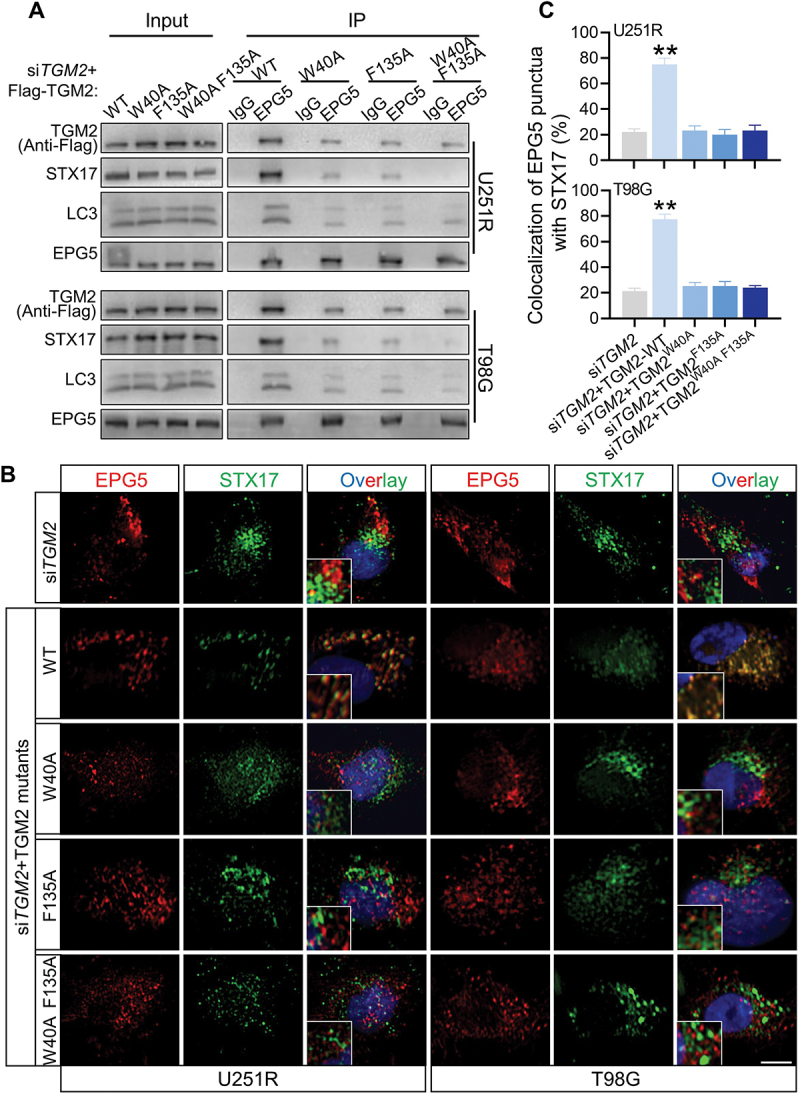
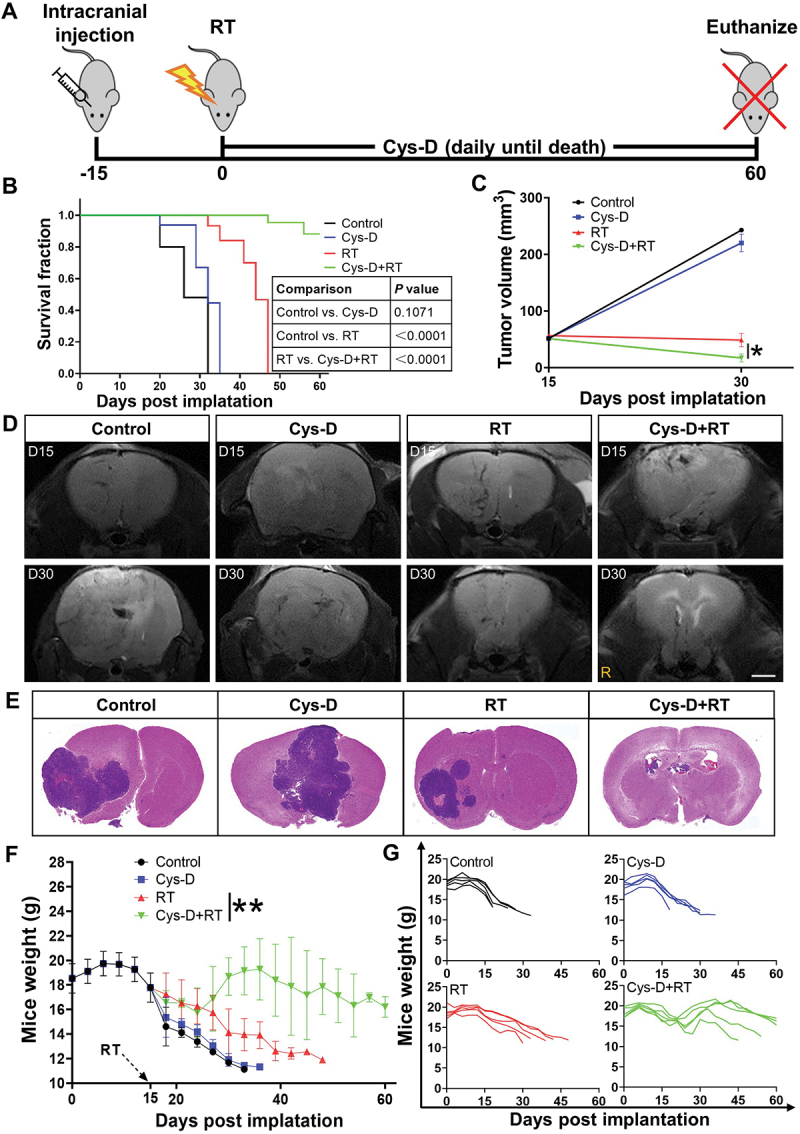
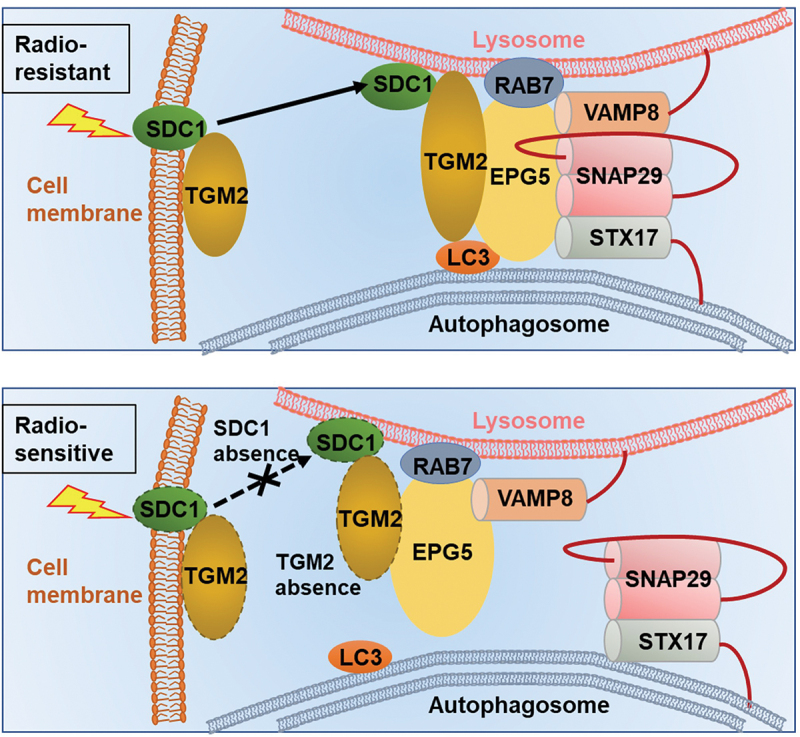
Glioblastoma multiforme (GBM) is the most common brain malignancy insensitive to radiotherapy (RT). Although macroautophagy/autophagy was reported to be a fundamental factor prolonging the survival of tumors under radiotherapeutic stress, the autophagic biomarkers coordinated to radioresistance of GBM are still lacking in clinical practice. Here we established radioresistant GBM cells and identified their protein profiles using tandem mass tag (TMT) quantitative proteomic analysis. It was found that SDC1 and TGM2 proteins were overexpressed in radioresistant GBM cells and tissues and they contributed to the poor prognosis of RT. Knocking down SDC1 and TGM2 inhibited the fusion of autophagosomes with lysosomes and thus enhanced the radiosensitivity of GBM cells. After irradiation, TGM2 bound with SDC1 and transported it from the cell membrane to lysosomes, and then bound to LC3 through its two LC3-interacting regions (LIRs), coordinating the encounter between autophagosomes and lysosomes, which should be a prerequisite for lysosomal EPG5 to recognize LC3 and subsequently stabilize the STX17-SNAP29-VAMP8 QabcR SNARE complex assembly. Moreover, when combined with RT, cystamine dihydrochloride (a TGM2 inhibitor) extended the lifespan of GBM-bearing mice. Overall, our findings demonstrated the EPG5 tethering mode with SDC1 and TGM2 during the fusion of autophagosomes with lysosomes, providing new insights into the molecular mechanism and therapeutic target underlying radioresistant GBM.Abbreviations: BafA1: bafilomycin A1; CQ: chloroquine; Cys-D: cystamine dihydrochloride; EPG5: ectopic P-granules 5 autophagy tethering factor; GBM: glioblastoma multiforme; GFP: green fluorescent protein; LAMP2: lysosomal associated membrane protein 2; LIRs: LC3-interacting regions; MAP1LC3/LC3: microtubule associated protein 1 light chain 3; NC: negative control; RFP: red fluorescent protein; RT: radiotherapy; SDC1: syndecan 1; SNAP29: synaptosome associated protein 29; SQSTM1/p62: sequestosome 1; STX17: syntaxin 17; TGM2: transglutaminase 2; TMT: tandem mass tag; VAMP8: vesicle associated membrane protein 8; WT: wild type.

Keywords: Autophagosome maturation; EPG5; SDC1; TGM2; glioblastoma; radioresistance biomarkers.


Conflict of interest statement

No potential conflicts of interest were disclosed.

Figures

Figure 1.
Figure 1.
The radioresistance of GBM cells was associated with the enhancement of autophagic activity. (A) Pattern of the establishment of U251R radioresistant cell line. (B) The radiosensitivity of U251, U251R and T98G cells were assessed by colony formation assay. (C) Representative images of xenograft tumors from U251, U251R and T98G cells with or without irradiation. (D-E) Tumor growth curves (E) for each mouse (D) in the indicated groups (n = 5 per group). (F-G) Average number of autophagosomes and autolysosomes per GBM cell with or without 4 Gy irradiation and the representative images of autophagy indicated by the expression of mRFP-GFP-LC3 fusion protein (scale bars: 10 μm). (H) Western blot analysis of the protein levels of SQSTM1 and LC3 in GBM cells at different times after 4 Gy irradiation. *P < 0.05 and **P < 0.01.
Figure 2.
Figure 2.
SDC1 and TGM2 enhanced radioresistance of GBM cells. (A) Wayne chart of the overexpressed genes in U251R and T98G cells in comparison with U251 or U251R cells. The interaction contains 17 genes. (B) List of above 17 upregulated genes. (C) Real-time PCR analysis of SDC1 and TGM2 mRNA levels in U251, U251R and T98G cells. (D) Western blot analysis (left) and quantification (right) of SDC1 and TGM2 protein expression levels in U251, U251R and T98G cells. (E) Immunofluorescence staining (left) of SDC1 and TGM2 and their relative densities (right) in xenografts of U251, U251R and T98G cells. Scale bars: 20 μm. (F-G) Dose responses of the survival fractions of U251R (F) and T98G (G) cells transfected with siNC (negative control), siSDC1 and siTGM2, respectively. *P < 0.05 and **P < 0.01.
Figure 3.
Figure 3.
Inhibition of SDC1 and TGM2 suppressed autolysosome formation. (A) KEGG pathway enrichment analysis of SDC1 (left) and TGM2 (right). (B) Representative image of the mRFP‐GFP‐LC3 fusion protein expressions in U251R and T98 G cells under different siRNAs transfection at 6 h after 4 Gy IR. Red dots indicate autolysosomes while yellow dots indicate autophagosomes in overlays. Nuclei were stained with DAPI. Scale bars: 10 μm. The average number of autophagosomes and autolysosomes in each indicated cell was quantified. ns P ≥ 0.05 and **P < 0.01.
Figure 4.
Figure 4.
Reduced autophagosome and lysosome encounter occurred in SDC1 and TGM2 knockdown cells. (A) Western blot analysis of LC3-II:I and SQSTM1 protein levels in different siRNAs transfected GBM cells at 6 h after 4 Gy IR. (B) Control, SDC1- and TGM2-knockdown cells were treated with 4 Gy irradiation and then incubated with 100 nM BafA1 for 6 h before stained with antibodies to LC3 and LAMP2. Nuclei were stained with DAPI. Scale bar: 10 μm. Colocalization LC3 and LAMP2 was quantified, and the relative number of autophagosomes in each cell was counted in comparison with the siNC group. *P < 0.05.
Figure 5.
Figure 5.
SDC1 bond to TGM2, and transported from cell surface to intracellular. (A) Immunofluorescence images of subcellular location of SDC1 (red) and TGM2 (green) proteins in GBM cells at 2–12 h after 4 Gy IR. DAPI-stained nuclei are blue. Scale bars: 10 μm. (B) Immunoblots of Co-IP assay that verified the binding of SDC1 to TGM2. (C) Schematic diagram depicting wild-type and fragmental SDC1 proteins. (D) Co-IP assay was used to validate the binding of TGM2 to wild-type SDC1 or SDC1 fragments.
Figure 6.
Figure 6.
The LIR motifs in TGM2 mediated LC3 binding. Cells were irradiated with 4 Gy X-rays 6 h before relevant detection. (A) In a Co-IP assay, SDC1 and TGM2 precipitated endogenous LC3. (B) Two potential LIR (LC3-interacting region) motifs in TGM2 were highlighted in red. (C) Lysates of GBM cells transfected with plasmids encoding Flag-tagged WT TGM2 or TGM2 with mutations in two LIR motifs were immunoprecipitated with an antibody to Flag followed by immunoblotting with antibodies to Flag, SDC1 and LC3. (D-E) Colocalization of LC3 and LAMP2 was quantified (D) in TGM2-knockdown cells that were stained with antibodies to LC3 and LAMP2 after 100 nM BafA1 treatments for 6 h (E). The TGM2-knockdown cells were rescued with TGM2-WT plasmid or TGM2-LIR mutants. Nuclei were stained with DAPI. Scale bars: 10 μm. **P < 0.01.
Figure 7.
Figure 7.
TGM2 bond to EPG5 and promoted EPG5-mediated QabcR SNARE assembly. Cells were irradiated with 4 Gy X-rays 6 h before detection. (A) Endogenous STX17, SNAP29 and VAMP8 were precipitated by TGM2 in Co-IP assays. (B) Co-IP assay of endogenous SNAP29 and VAMP8 bond with STX17 in the SDC1- or TGM2-knockdown cells. (C) The levels of co-precipitated SNAP29 and VAMP8 were normalized to the corresponding STX17 (set to 1 in control cells). (D) Endogenous EPG5, WDR45 and RAB7 were precipitated by TGM2 in Co-IP assays. (E) Co-IP assay of endogenous STX17, SNAP29 and LC3 bond with EPG5 in the SDC1- or TGM2-knockdown cells. (F) The levels of co-precipitated STX17, SNAP29 and LC3 were normalized to the corresponding EPG5 (set to 1 in control cells). ns P ≥ 0.05 and **P < 0.01.
Figure 8.
Figure 8.
TGM2-LC3 binding determined EPG5 recognition of autophagosomal LC3. Cells were irradiated with 4 Gy X-rays 6 h before detecting. (A) Co-IP assay of endogenous LC3, STX17 and Flag-tagged TGM2 bond with EPG5 in TGM2-knockdown cells rescued with TGM2 WT or mutants having substitution on two LIR motifs. (B-C) TGM2-knockdown cells with or without rescue of TGM2-WT plasmid or TGM2-LIR mutants were stained with antibodies to EPG5 and STX17 (B). Colocalization of EPG5 and STX17 was quantified (C). Nuclei were stained with DAPI. Scale bars: 10 μm. **P < 0.01.
Figure 9.
Figure 9.
GBM was sensitized to RT with anti-TGM2 blockade (Cys-D) treatment. (A) Schematic of experimental design. (B) Kaplan–Meier survival curves of U251R xenograft-bearing mice from the day of tumor cells implantation to mice death or maximum study duration of 60 days (n = 5 per group). Survival differences were determined by log-rank Mantel-Cox test. (C) Tumor growth delay curves with U251R xenograft tumor volumes measured by MRI scan. (D) U251R xenograft tumor volume was measured by T2-weighted MR image on day 15 (upper panel) and day 30 (lower panel) after cell implantation. Mice were treated with RT, Cys-D, or their combination. Scale bars: 2 mm. (E) Whole mount HE-stained brain sections of mice treated with RT, Cys-D, or their combination. (F-G) Time responses upon the weight of mice after U251R cells implantation on average (F) and individual (G). Mice were treated with RT, Cys-D, or their combination. *P < 0.05 and **P < 0.01.
Figure 10.
Figure 10.
Mechanism diagram showed how SDC1 and TGM2 mediate fusion of autophagosomes with lysosomes in GBM cells after IR. In radioresistant cells, with the transport of SDC1, TGM2 was recruited to lysosome. TGM2 in turn bond to LC3 on autophagosomal membrane, activating EPG5 interaction with LC3, promoting assembly of the STX17-SNAP29-VAMP8 QabcR SNARE complex and autophagosome-lysosome fusion. In SDC1 or TGM2 absence cells, EPG5 could not interact with LC3 and capture autophagosome, impairing STX17-SNAP29-VAMP8 QabcR SNARE assembly and autophagosome-lysosome fusion, which ultimately enhanced radiosensitivity.

Similar articles

Cited by

References

    1. Ostrom QT, Patil N, Cioffi G, et al. CBTRUS statistical report: primary brain and other central nervous system tumors diagnosed in the United States in 2013-2017. Neuro Oncol. 2020;22(12 Suppl 2):v1–96. - PMC - PubMed
    1. Lara-Velazquez M, Al-Kharboosh R, Jeanneret S, et al. Advances in brain tumor surgery for glioblastoma in adults. Brain Sci. 2017;7(12):166. - PMC - PubMed
    1. Chiblak S, Tang Z, Lemke D, et al. Carbon irradiation overcomes glioma radioresistance by eradicating stem cells and forming an antiangiogenic and immunopermissive niche. JCI Insight. 2019;4(2):e123837. - PMC - PubMed
    1. Dunn GP, Rinne ML, Wykosky J, et al. Emerging insights into the molecular and cellular basis of glioblastoma. Genes Dev. 2012;26(8):756–784. - PMC - PubMed
    1. Levine B, Kroemer G.. Autophagy in the pathogenesis of disease. Cell. 2008;132(1):27–42. - PMC - PubMed

Publication types