. 2022 Aug 1;17(8):e0271074.
doi: 10.1371/journal.pone.0271074. eCollection 2022.

Genomic surveillance, evolution and global transmission of SARS-CoV-2 during 2019-2022

Affiliations

Genomic surveillance, evolution and global transmission of SARS-CoV-2 during 2019-2022

Nadim Sharif et al. PLoS One. .

Abstract

In spite of the availability of vaccine, the health burden associated with the COVID-19 pandemic continues to increase. An estimated 5 million people have died with SARS-CoV-2 infection. Analysis of evolution and genomic diversity can provide sufficient information to reduce the health burden of the pandemic. This study focused to conduct worldwide genomic surveillance. About 7.6 million genomic data were analyzed during 2019 to 2022. Multiple sequence alignment was conducted by using maximum likelihood method. Clade GK (52%) was the most predominant followed by GRY (12%), GRA (11%), GR (8%), GH (7%), G (6%), GV (3%), and O (1%), respectively. VOC Delta (66%) was the most prevalent variant followed by VOC Alpha (18%), VOC Omicron (13%), VOC Gamma (2%) and VOC Beta (1%), respectively. The frequency of point mutations including E484K, N501Y, N439K, and L452R at spike protein has increased 10%-92%. Evolutionary rate of the variants was 23.7 substitution per site per year. Substitution mutations E484K and N501Y had significant correlation with cases (r = .45, r = .23), fatalities (r = .15, r = .44) and growth rate R0 (r = .28, r = .54). This study will help to understand the genomic diversity, evolution and the impact of the variants on the outcome of the COVID-19 pandemic.


Conflict of interest statement

The authors have declared that no competing interests exist.

Figures

Fig 1
Fig 1
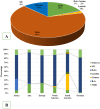
(A) Frequency distribution of total of 7540558 whole genome of SARS-CoV-2 among six continents. All of the whole genomes were collected and submitted to GISAID and NCBI during December, 2019 to January, 2022. Only genome sequences of high coverage of reference and complete genome were included in this analysis. (B) Frequency distribution of 7540558 whole genome of SARS-CoV-2 into eleven clades isolated during December, 2019 to January, 2022. (C) Distribution of eleven clades of 7540558 whole genome of SARS-CoV-2 in six continents.
Fig 2
Fig 2
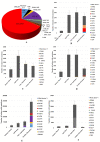
(A) Global frequency distribution of 7540558 whole genome of SARS-CoV-2 among variants of concerns identified during December, 2019 to January, 2022. (B) Percentage of variant of concerns of SARS-CoV-2 circulating throughout the six continents during the COVID-19 pandemic.
Fig 3
Fig 3
(A) Temporal and spatial distribution of substitution of frequency of point mutations at spike protein of SARS-CoV-2 worldwide during January, 2020 to December, 2020. (B-F) Continent-wise frequency distribution of the detected significant mutations at spike protein during January, 2020 to December, 2020 [(B) Africa, (C) America, (D) Asia, (E) Europe, and (F) Oceania, respectively]. Wuhan-Hu-1/2019 was used as reference sequence in this analysis.
Fig 4
Fig 4
(A) Worldwide distribution of frequency of significant substitution point mutations at nucleocapsid and nonstructural protein of SARS-CoV-2 during January, 2020 to December, 2020. (B) Monthly report of substitution point mutations at nucleocapsid and nonstructural protein of SARS-CoV-2 in Africa and (C) Americas, (D) Asia, (E) Europe, and (F) Oceania during January 01 to December 31, 2020. Wuhan-Hu-1/2019 was used as reference sequence in this analysis.
Fig 5
Fig 5
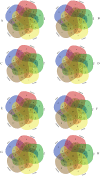
Venn diagram representing the incidence of significant point mutations at RBD and S1/S2 junction at spike protein of circulating SARS-CoV-2 in six continents during (A) January to June, 2020 (B) July to December, 2020 (C) January to June, 2021 and (D) July to December, 2021. The frequency of collective point mutations and common point mutations at S protein among the six continents increased significantly after June, 2020. Venn diagram representing the incidence of significant point mutations at nucleocapsid and nonstructural protein among circulating SARS-CoV-2 in Africa, Americas, Asia, Europe and Oceania during (E) January to June, 2020 (F) July to December, 2020 (G) January to June, 2021 and (H) July to December, 2021. Total of 7663308 whole genome of SARS-CoV-2 were analyzed. Wuhan-Hu-1/2019 was used as reference sequence in this analysis.
Fig 6
Fig 6
(A) Probable origin and global transmission history of significant variants of concerns of SARS-CoV-2 with altered transmission rate, fatality rate and detection rate during the COVID-19 pandemic. During December, 2019 to January, 2022 about 7540558 whole genome of SARS-CoV-2 were traced worldwide. Four variants of concern including beta, gamma, delta and omicron with their probable transmission history were indicated by four different color lines. Star and circle indicated probable origin places. (B) Worldwide distribution of cumulative case, fatality and complete vaccination number of COVID-19 till 31 January, 2022.
Fig 7
Fig 7. Phylogenomic tree of the whole genome of SARS-CoV-2 including the representative genomes containing significant point mutations.
Whole genome with high coverage were selected for every continents. Every phylogenomic tree included at least 10 or more sample sequences collected in every month after December, 2019 to January 2022 in every continents. Reference SARS-CoV-2 strains were selected from NCBI. Trees were built by using Maximum Composite Likelihood (MCL) method and genetic distance was calculated by Kimura-2-parameter model. Phylogenomic trees were generated with 1000 bootstrap replicates of the nucleotide alignment datasets. Six trees represented six continents including (A) Africa (485 whole genomes), (B) Asia (855 whole genomes), (C) Europe (624 whole genomes), (D) North America (738 whole genomes), (E) Oceania (395 whole genomes), and (F) South America (625 whole genomes), respectively. Wuhan-Hu-1/2019 was used as reference sequence in this analysis.
Fig 8
Fig 8
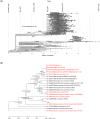
(A) Phylogenomic tree of 3055 representative whole genomes of SARS-CoV-2 isolated during December 2019 to January 31, 2022 representing the diversity and evolution of different variants. The tree is rooted relative to early samples from Wuhan, China. Nucleotide substitution rate of 8 × 10⁻⁴ subs per site per year was represented by single temporal resolution. Mutational frequency was calculated by using previous model (Obermeyer et al). The lower scale represented number of mutations and the upper scale indicated timeline of evolution. Wuhan-Hu-1/2019 was used as reference sequence in this analysis. (B) Phylogenetic tree of the whole genome of available reference sequences of coronaviruses isolated from different animals and human collected from NCBI. The tree was constructed using whole genome of novel coronaviruses. The tree was built by using the Maximum Composite Likelihood (MCL) method and genetic distance was calculated by Kimura-2-parameter model. Phylogenetic tree was generated with 1000 bootstrap replicates of the nucleotide alignment datasets. The scale indicates nucleotide substitutions, SNPs and indels per position. The bar in the branch indicated 95% confidence intervals. Red colored references indicated human coronaviruses. Total of 21 whole genome from 8 different animals were included in this analysis.

References

    1. Wu F, Zhao S, Yu B, Chen YM, Wang W, Song ZG, et al.. A new coronavirus associated with human respiratory disease in China. Nature. 2020;579(7798):265–9. doi: 10.1038/s41586-020-2008-3 - DOI - PMC - PubMed
    1. Machhi J, Herskovitz J, Senan AM, Dutta D, Nath B, Oleynikov MD, et al.. The natural history, pathobiology, and clinical manifestations of SARS-CoV-2 infections. Journal of Neuroimmune Pharmacology. 2020;15(3):359–86. doi: 10.1007/s11481-020-09944-5 - DOI - PMC - PubMed
    1. Malik YS, Sircar S, Bhat S, Sharun K, Dhama K, Dadar M, et al.. Emerging novel coronavirus (2019-nCoV)—current scenario, evolutionary perspective based on genome analysis and recent developments. Veterinary quarterly. 2020;40(1):68–76. doi: 10.1080/01652176.2020.1727993 - DOI - PMC - PubMed
    1. Matoba Y, Abiko C, Ikeda T, Aoki Y, Suzuki Y, Yahagi K, et al.. Detection of the human coronavirus 229E, HKU1, NL63, and OC43 between 2010 and 2013 in Yamagata, Japan. Japanese journal of infectious diseases. 2015;68(2):138–41. doi: 10.7883/yoken.JJID.2014.266 - DOI - PubMed
    1. Cui J, Li F, Shi ZL. Origin and evolution of pathogenic coronaviruses. Nature Reviews Microbiology. 2019;17(3):181–92. doi: 10.1038/s41579-018-0118-9 - DOI - PMC - PubMed

Publication types

Substances