

Modeling within-host and aerosol dynamics of SARS-CoV-2: The relationship with infectiousness
- PMID: 35913988
- PMCID: PMC9371288
- DOI: 10.1371/journal.pcbi.1009997
Modeling within-host and aerosol dynamics of SARS-CoV-2: The relationship with infectiousness
Abstract
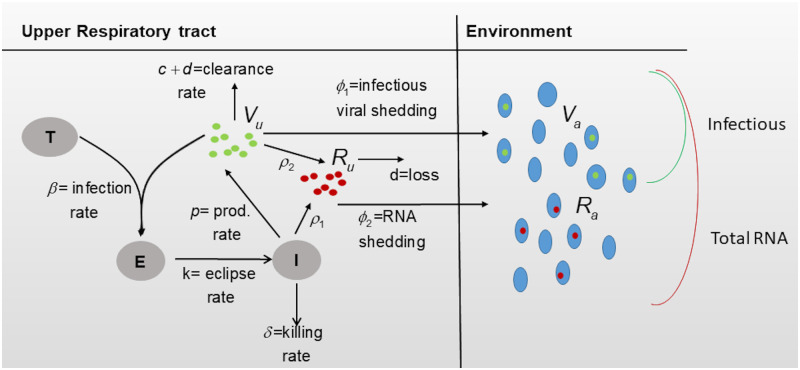
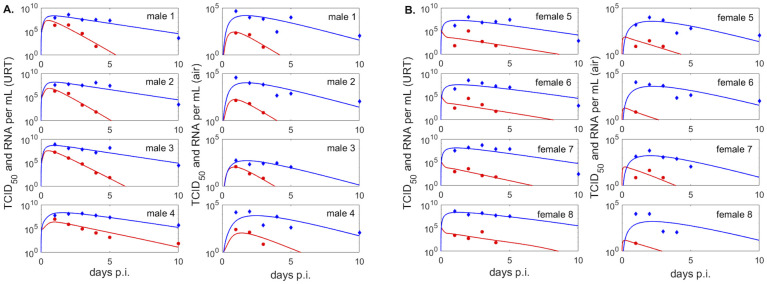
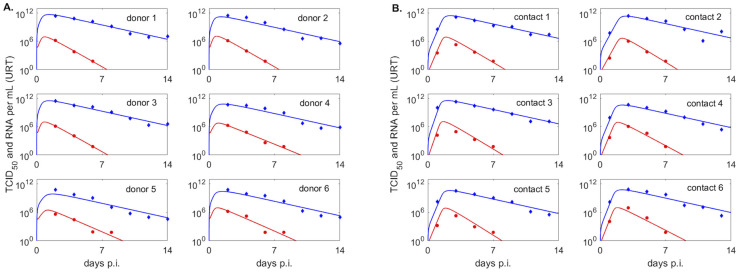
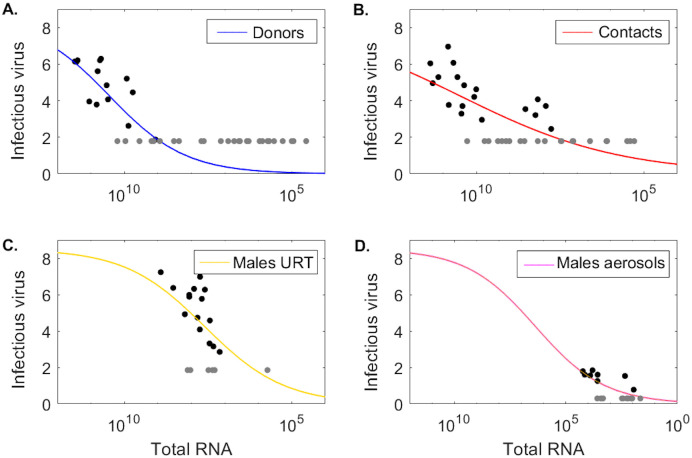
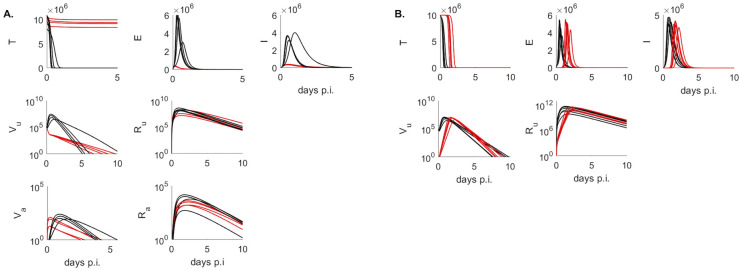
The relationship between transmission of severe acute respiratory syndrome coronavirus 2 (SARS-CoV-2) and the amount of virus present in the proximity of a susceptible host is not understood. Here, we developed a within-host and aerosol mathematical model and used it to determine the relationship between viral kinetics in the upper respiratory track, viral kinetics in the aerosols, and new transmissions in golden hamsters challenged with SARS-CoV-2. We determined that infectious virus shedding early in infection correlates with transmission events, shedding of infectious virus diminishes late in the infection, and high viral RNA levels late in the infection are a poor indicator of transmission. We further showed that viral infectiousness increases in a density dependent manner with viral RNA and that their relative ratio is time-dependent. Such information is useful for designing interventions.
Conflict of interest statement
The authors have declared that no competing interests exist.
Figures

Similar articles
-
Infectious Severe Acute Respiratory Syndrome Coronavirus 2 (SARS-CoV-2) in Exhaled Aerosols and Efficacy of Masks During Early Mild Infection.Clin Infect Dis. 2022 Aug 24;75(1):e241-e248. doi: 10.1093/cid/ciab797. Clin Infect Dis. 2022. PMID: 34519774 Free PMC article.
-
Exhaled Breath Aerosol Shedding of Highly Transmissible Versus Prior Severe Acute Respiratory Syndrome Coronavirus 2 Variants.Clin Infect Dis. 2023 Mar 4;76(5):786-794. doi: 10.1093/cid/ciac846. Clin Infect Dis. 2023. PMID: 36285523 Free PMC article.
-
Viral Load of Severe Acute Respiratory Syndrome Coronavirus 2 (SARS-CoV-2) in Respiratory Aerosols Emitted by Patients With Coronavirus Disease 2019 (COVID-19) While Breathing, Talking, and Singing.Clin Infect Dis. 2022 May 30;74(10):1722-1728. doi: 10.1093/cid/ciab691. Clin Infect Dis. 2022. PMID: 34358292 Free PMC article.
-
Transmission of SARS-CoV-2: A Review of Viral, Host, and Environmental Factors.Ann Intern Med. 2021 Jan;174(1):69-79. doi: 10.7326/M20-5008. Epub 2020 Sep 17. Ann Intern Med. 2021. PMID: 32941052 Free PMC article. Review.
-
SARS-CoV-2 viral load and shedding kinetics.Nat Rev Microbiol. 2023 Mar;21(3):147-161. doi: 10.1038/s41579-022-00822-w. Epub 2022 Dec 2. Nat Rev Microbiol. 2023. PMID: 36460930 Free PMC article. Review.
Cited by
-
Uncovering the impact of infection routes on within-host MPXV dynamics: Insights from a mathematical modeling study.PLoS Comput Biol. 2025 May 19;21(5):e1013073. doi: 10.1371/journal.pcbi.1013073. eCollection 2025 May. PLoS Comput Biol. 2025. PMID: 40388391 Free PMC article.
-
COVID-19 dynamics and immune response: Linking within-host and between-host dynamics.Chaos Solitons Fractals. 2023 Jun 26:113722. doi: 10.1016/j.chaos.2023.113722. Online ahead of print. Chaos Solitons Fractals. 2023. PMID: 38620099 Free PMC article.
-
Analysis of the risk and pre-emptive control of viral outbreaks accounting for within-host dynamics: SARS-CoV-2 as a case study.Proc Natl Acad Sci U S A. 2023 Oct 10;120(41):e2305451120. doi: 10.1073/pnas.2305451120. Epub 2023 Oct 3. Proc Natl Acad Sci U S A. 2023. PMID: 37788317 Free PMC article.
-
Identifiability investigation of within-host models of acute virus infection.Math Biosci Eng. 2024 Oct 28;21(10):7394-7420. doi: 10.3934/mbe.2024325. Math Biosci Eng. 2024. PMID: 39696868 Free PMC article.
-
Identifiability of parameters in mathematical models of SARS-CoV-2 infections in humans.Sci Rep. 2022 Aug 27;12(1):14637. doi: 10.1038/s41598-022-18683-x. Sci Rep. 2022. PMID: 36030320 Free PMC article.
References
-
- Pan J, Hawks SA, Prussin AJ, Duggal NK, Marr LC. SARS-CoV-2 on Surfaces and HVAC Filters in Dormitory Rooms. Environmental Science & Technology Letters. 2021;.
Publication types
MeSH terms
Substances
LinkOut - more resources
Full Text Sources
Medical
Miscellaneous
