. 2022 Aug 24;96(16):e0075522.
doi: 10.1128/jvi.00755-22. Epub 2022 Aug 1.

SUMO Modification of Histone Demethylase KDM4A in Kaposi's Sarcoma-Associated Herpesvirus-Induced Primary Effusion Lymphoma

Affiliations

SUMO Modification of Histone Demethylase KDM4A in Kaposi's Sarcoma-Associated Herpesvirus-Induced Primary Effusion Lymphoma

Wayne W Yeh et al. J Virol. .

Abstract

Primary effusion lymphoma (PEL) is a fatal B-cell lymphoma caused by Kaposi's sarcoma-associated herpesvirus (KSHV) infection. Inducing KSHV lytic replication that causes the death of host cells is an attractive treatment approach for PE; however, combination therapy inhibiting viral production is frequently needed to improve its outcomes. We have previously shown that the KSHV lytic protein K-bZIP can SUMOylate histone lysine demethylase 4A (KDM4A) at lysine 471 (K471) and this SUMOylation is required for virus production upon KSHV reactivation. Here, we demonstrate that SUMOylation of KDM4A orchestrates PEL cell survival, a major challenge for the success of PEL treatment; and cell movement and angiogenesis, the cell functions contributing to PEL cell extravasation and dissemination. Furthermore, integrated ChIP-seq and RNA-seq analyses identified interleukin-10 (IL-10), an immunosuppressive cytokine, as a novel downstream target of KDM4A. We demonstrate that PEL-induced angiogenesis is dependent on IL-10. More importantly, single-cell RNA sequencing (scRNA-seq) analysis demonstrated that, at the late stage of KSHV reactivation, KDM4A determines the fates of PEL cells, as evidenced by two distinct cell populations; one with less apoptotic signaling expresses high levels of viral genes and the other is exactly opposite, while KDM4A-K417R-expressing cells contain only the apoptotic population with less viral gene expression. Consistently, KDM4A knockout significantly reduced cell viability and virus production in KSHV-reactivated PEL cells. Since inhibiting PEL extravasation and eradicating KSHV-infected PEL cells without increasing viral load provide a strong rationale for treating PEL, this study indicates targeting KDM4A as a promising therapeutic option for treating PEL. IMPORTANCE PEL is an aggressive and untreatable B-cell lymphoma caused by KSHV infection. Therefore, new therapeutic approaches for PEL need to be investigated. Since simultaneous induction of KSHV reactivation and apoptosis can directly kill PEL cells, they have been applied in the treatment of this hematologic malignancy and have made progress. Epigenetic therapy with histone deacetylase (HDAC) inhibitors has been proved to treat PEL. However, the antitumor efficacies of HDAC inhibitors are modest and new approaches are needed. Following our previous report showing that the histone lysine demethylase KDM4A and its SUMOylation are required for lytic reactivation of KSHV in PEL cells, we further investigated its cellular function. Here, we found that SUMOylation of KDM4A is required for the survival, movement, and angiogenesis of lytic KSHV-infected PEL cells. Together with our previous finding showing the importance of KDM4A SUMOylation in viral production, KDM4A can be a potential therapeutic target for PEL.

Keywords: KDM4A; Kaposi's sarcoma-associated herpesvirus (KSHV); SUMOylation; histone lysine demethylase (KDM); primary effusion lymphoma (PEL).


Conflict of interest statement

The authors declare no conflict of interest.

Figures
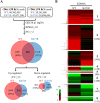
FIG 1
FIG 1
SUMO modification of KDM4A-regulated host genes differentially expressed in KSHV lytic reactivated BCBL-1 cells. (A) Summary of RNA-seq data. TREx-MH-K-Rta-shKDM4A-Flag-KDM4A-WT and -KDM4A-K471R cells were treated with 0.2 μg/mL Dox for 24 h. Cells cultured without any treatment were used as control (Ctrl). Total RNA was extracted and used for RNA-seq on the Illumina HiSeq2000 platform 24 h after treatment. Total reads of each sample were showed in the top boxes. Paired-end reads were aligned to the human reference genome (hg38) using CLC Genomics Workbench 11 (Qiagen) and annotated with RefSeq82 using Partek Genomics Suite 7 (Partek). RPKM greater than 0.1 in any one of the samples was considered as expressed and used for subsequent analysis. Pie chart shows mRNA expression data. The numbers (percentages) of mRNAs that were up- or downregulated more than 2-fold are shown. (B) Heatmap of hierarchical cluster analysis of the mRNA expression data from the treatment conditions described in Fig. 1A.
FIG 2
FIG 2
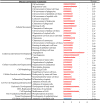
Pathway enrichment of differentially expressed genes (DEGs) between KDM4A-WT and -K471R BCBL-1 after KSHV reactivation. The numbers on the x axis indicate -log10 P-value.
FIG 3
FIG 3
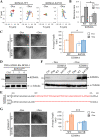
SUMOylation of KDM4A enhanced BCBL-1 cell movement and angiogenesis of HMEC-1 cells. (A) Trajectory tracking of TREx-MH-K-Rta-shKDM4A-Flag-KDM4A-WT and -KDM4A-K471R BCBL-1 cells treated with or without Dox cultivated on top of collagen. The amoeboid cell movement was recorded via a brightfield microscopy for 24 h at 5-min intervals. All the movement cells from 6 microscopic fields were shown. (B) The quantitative data of the directional migration distance was calculated with Image J software. (C) Representative images (×100 magnification) of in vitro tube formation assay in HMEC-1 cells treated with conditioned medium (CM) collected from TREx-MH-K-Rta-shKDM4A-Flag-KDM4A-WT and -KDM4A-K471R BCBL-1 cells treated with or without Dox (0.2 μg/mL) for 72 h (left panel). Quantification of tube length (right panel). (D) Generation of KDM4A knockout TREx-MH-K-Rta BCBL-1 cell line by CRISPR/Cas9 system. Immunoblotting of KDM4A in different TREx-MH-K-Rta BCBL-1 knockout clones. (E) The knockout clone (#6) was confirmed by Sanger sequencing of PCR amplicons. (F) Immunoblotting of KDM4A expression in the control (Ctrl), Flag-tag-expressing vector (Flag), KDM4A-WT, and KDM4A-K471R transduced TREx-MH-K-Rta-KDM4AKO BCBL-1 cells with or without Dox (0.2 μg/mL) treatment for 72 h. (G) Representative images (×100 magnification) of in vitro tube formation assay in HMEC-1 cells treated with CM collected from TREx-MH-K-Rta-KDM4Ako-Flag-KDM4A-WT and -KDM4A-K471R BCBL-1 cells treated with or without Dox (0.2 μg/mL) for 72 h (left panel). Quantification of tube length (right panel).
FIG 4
FIG 4
Identification of IL-10 as a novel target gene of KDM4A potentially involved in angiogenesis of endothelial HMEC-1 cells. (A) Real-time reverse transcriptase-quantitative PCR (RT-qPCR) analysis of the expression of angiogenesis-related genes in TREx-MH-K-Rta-shKDM4A-Flag-KDM4A-WT and KDM4A-K471R cells treated with Dox (0.2 μg/mL) for 0 and 24 h. The results are expressed as fold change (FC) compared to KDM4A-WT cells without Dox (assigned a value of 1). (B) The expression of IL-10 in the TREx-MH-K-Rta (WT) and TREx-MH-K-Rta-shKDM4A BCBL-1 cells was analyzed by RT-qPCR (left panel). Culture supernatants were collected, and levels of IL-10 were measured by ELISA (right panel). The results are expressed as FC compared to wild-type (WT) cells (assigned a value of 1). (C) Histograms of ChIP-seq profiles for KDM4A binding at IL-10 loci in TREx-MH-K-Rta-shKDM4A-Flag-KDM4A-WT and -KDM4A-K471R BCBL-1 cells. (D and E) ChIP assay was performed with chromatin prepared from TREx-MH-K-Rta-shKDM4A-Flag-KDM4A-WT and -KDM4A-K471R BCBL-1 cells (D) and from TREx-MH-K-Rta BCBL-1 cells (E) using rabbit IgG and anti-KDM4A antibody. ChIP DNA was quantified by RT-qPCR using primer pairs specific for promoter regions of IL-10. (F) ChIP-qPCR assay was performed on noninduced and Dox-induced TREx-MH-K-Rta-shKDM4A-Flag-KDM4A-WT and -KDM4A-K471R BCBL-1 cells using rabbit IgG and anti-H3K9me3 antibody. ChIP DNA levels were determined as described in (D) and (E). (G) Culture supernatants from TREx-MH-K-Rta-shKDM4A-Flag-KDM4A-WT and KDM4A-K471R cells with or without Dox (0.2 μg/mL) treatment for 72 h were collected and the levels of IL-10 were measured by ELISA. (H) TREx-MH-K-Rta BCBL-1 cells were transient transduced with lentivirus overexpressing shIL-10 (clone #1 and #2). Culture supernatants from the KSHV-reactivated control (Ctrl) and IL-10 knockdown (shIL-10) BCBL-1 cells were collected, and IL-10 levels were determined by ELISA. (I) Quantification of the tube length of HMEC-1 treated with CM collected from cells treated as described in (H). (J) IL-10 levels in KSHV-reactivated BCBL-1 cells with or without preincubation with 0.05, 0.15, and 0.2 μg/mL IL-10 nAb for 10 min at 25°C were determined by ELISA. (K) Quantification of the tube length of HMEC-1 treated with CM collected from TREx-MH-K-Rta BCBL-1 cells with or without preincubation with 0.2 μg/mL IL-10 nAb for 10 min at 25°C.
FIG 5
FIG 5
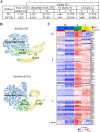
Dissection of KSHV lytic reactivation stages in TREx-MH-K-Rta-shKDM4A-Flag-KDM4A-WT and -KDM4A-K471R BCBL-1 cell lines treated with Dox (0.2 μg/mL) for 24 h. (A) The number (cell #) and percentage (%) of TREx-MH-K-Rta-shKDM4A-KDM4A-WT and -KDM4A-K471R BCBL-1 cells in single-cell RNA sequencing (scRNA-seq). (B) T-distributed stochastic neighbor embedding (t-SNE) plot demonstrating cells in different lytic stages (colored and labeled by their marker genes). (C) The heatmap shows the expression (standardized average count) of KSHV lytic genes in each cluster. Row: KSHV genes. Column: cells.
FIG 6
FIG 6
Trajectory analysis of TREx-MH-K-Rta-shKDM4A-Flag-KDM4A-WT and -KDM4A-K471R BCBL-1 cells. The trajectory plot of combined (left panel), TREx-MH-K-Rta-shKDM4A-KDM4A-WT (middle panel), and -KDM4A-K471R (right panel) BCBL-1 cells. (A) The trajectory plots are colored with purple, red, and orange, indicating states 1, 2, and 3, respectively. (B) The trajectory plots are colored with blue, green, and yellow, indicating immediate early (IE), early (E), and late (L), respectively. (C) The trajectory plots are colored with the expression of KSHV genes.
FIG 7
FIG 7
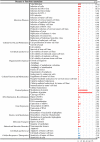
Pathway enrichment of DEGs between states 2 and 3 of the trajectory. The numbers of x axis indicate -log10 P-value.
FIG 8
FIG 8
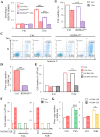
KDM4A is required for the survival and virus production of BCBL-1 cells after KSHV reactivation. (A) Proliferation of TREx-MH-K-Rta and TREx-MH-K-Rta KDM4A knockout (TREx-MH-K-Rta-KDM4AKO) BCBL-1 cell lines before after Dox treatment for 72 h were assessed by MTT assay. (B) Viable cells treated as described in (A) were counted by trypan blue dye exclusion assay using Countess 3 FL. (C) TREx-MH-K-Rta and TREx-MH-K-Rta-KDM4AKO cells were treated with Dox (0.2 μg/mL) for 0 and 72 h, followed by the stain of annexin V and propidium iodide using an apoptotic detection kit. The fluorescence intensity of the stained cells was analyzed using fluorescence-activated cell sorting (FACS). Cells without staining were used as negative control. (D) Supernatants from TREx-MH-K-Rta and KDM4AKO BCBL-1 cells treated as described in (A) for 72 h were collected, filtered, and the viral titers were determined by analyzing the virion-associated DNA levels using TaqMan qPCR. (E) TREx-MH-K-Rta BCBL-1 cells were treated with 0.2 μg/mL Dox, 60 μM NCDM-32B, or both for 0 and 72 h. Cell numbers were counted by trypan blue dye exclusion assay using Countess 3 FL. (F) TREx-MH-K-Rta BCBL-1 cells were treated with 500 ng/mL TSA, 1 mM NaB, 60 μM NCDM-32B/500 ng/mL TSA or 60 μM NCDM-32B/1 mM NaB. Cell numbers were counted as described in (E). Cells without treatment used as a control (Ctrl). (G) Supernatants from TREx-MH-K-Rta BCBL-1 cells treated as described in (F) were collected and filtered, and the viral titers were determined as described in (D). (Data represent mean±SEM; n = 3; *, P < 0.05; ***, P < 0.005).

References

    1. Cesarman E. 2002. The role of Kaposi's sarcoma-associated herpesvirus (KSHV/HHV-8) in lymphoproliferative diseases. Recent Results Cancer Res 159:27–37. 10.1007/978-3-642-56352-2_4. - DOI - PubMed
    1. Cesarman E. 2011. Gammaherpesvirus and lymphoproliferative disorders in immunocompromised patients. Cancer Lett 305:163–174. 10.1016/j.canlet.2011.03.003. - DOI - PMC - PubMed
    1. Guillet S, Gerard L, Meignin V, Agbalika F, Cuccini W, Denis B, Katlama C, Galicier L, Oksenhendler E. 2016. Classic and extracavitary primary effusion lymphoma in 51 HIV-infected patients from a single institution. Am J Hematol 91:233–237. 10.1002/ajh.24251. - DOI - PubMed
    1. Lurain K, Polizzotto MN, Aleman K, Bhutani M, Wyvill KM, Goncalves PH, Ramaswami R, Marshall VA, Miley W, Steinberg SM, Little RF, Wilson W, Filie AC, Pittaluga S, Jaffe ES, Whitby D, Yarchoan R, Uldrick TS. 2019. Viral, immunologic, and clinical features of primary effusion lymphoma. Blood 133:1753–1761. 10.1182/blood-2019-01-893339. - DOI - PMC - PubMed
    1. Rubinstein PG, Aboulafia DM, Zloza A. 2014. Malignancies in HIV/AIDS: from epidemiology to therapeutic challenges. AIDS 28:453–465. 10.1097/QAD.0000000000000071. - DOI - PMC - PubMed

Publication types

MeSH terms

Substances

LinkOut - more resources