Long-distance association of topological boundaries through nuclear condensates
- PMID: 35914133
- PMCID: PMC9371644
- DOI: 10.1073/pnas.2206216119
Long-distance association of topological boundaries through nuclear condensates
Abstract
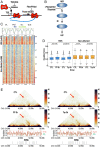
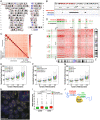
The eukaryotic genome is partitioned into distinct topological domains separated by boundary elements. Emerging data support the concept that several well-established nuclear compartments are ribonucleoprotein condensates assembled through the physical process of phase separation. Here, based on our demonstration that chemical disruption of nuclear condensate assembly weakens the insulation properties of a specific subset (∼20%) of topologically associated domain (TAD) boundaries, we report that the disrupted boundaries are characterized by a high level of transcription and striking spatial clustering. These topological boundary regions tend to be spatially associated, even interchromosomally, segregate with nuclear speckles, and harbor a specific subset of "housekeeping" genes widely expressed in diverse cell types. These observations reveal a previously unappreciated mode of genome organization mediated by conserved boundary elements harboring highly and widely expressed transcription units and associated transcriptional condensates.
Keywords: chromosome architecture; condensate biology; transcription.
Conflict of interest statement
The authors declare no competing interest.
Figures


Similar articles
-
[Compartmentalization of the cell nucleus and spatial organization of the genome].Mol Biol (Mosk). 2015 Jan-Feb;49(1):26-45. Mol Biol (Mosk). 2015. PMID: 25916108 Review. Russian.
-
Genome organization around nuclear speckles.Curr Opin Genet Dev. 2019 Apr;55:91-99. doi: 10.1016/j.gde.2019.06.008. Epub 2019 Aug 5. Curr Opin Genet Dev. 2019. PMID: 31394307 Free PMC article. Review.
-
Liquid-liquid phase separation: Galectin-3 in nuclear speckles and ribonucleoprotein complexes.Exp Cell Res. 2023 Jun 1;427(1):113571. doi: 10.1016/j.yexcr.2023.113571. Epub 2023 Mar 31. Exp Cell Res. 2023. PMID: 37003559 Free PMC article. Review.
-
The genome in space and time: does form always follow function? How does the spatial and temporal organization of a eukaryotic genome reflect and influence its functions?Bioessays. 2012 Sep;34(9):800-10. doi: 10.1002/bies.201200034. Epub 2012 Jul 6. Bioessays. 2012. PMID: 22777837 Free PMC article.
-
MrTADFinder: A network modularity based approach to identify topologically associating domains in multiple resolutions.PLoS Comput Biol. 2017 Jul 24;13(7):e1005647. doi: 10.1371/journal.pcbi.1005647. eCollection 2017 Jul. PLoS Comput Biol. 2017. PMID: 28742097 Free PMC article.
Cited by
-
Single-molecule characterization of target search dynamics of DNA-binding proteins in DNA-condensed droplets.Nucleic Acids Res. 2023 Jul 21;51(13):6654-6667. doi: 10.1093/nar/gkad471. Nucleic Acids Res. 2023. PMID: 37283050 Free PMC article.
-
Enhancer-promoter specificity in gene transcription: molecular mechanisms and disease associations.Exp Mol Med. 2024 Apr;56(4):772-787. doi: 10.1038/s12276-024-01233-y. Epub 2024 Apr 25. Exp Mol Med. 2024. PMID: 38658702 Free PMC article. Review.
-
Modulation of the high-order chromatin structure by Polycomb complexes.Front Cell Dev Biol. 2022 Oct 5;10:1021658. doi: 10.3389/fcell.2022.1021658. eCollection 2022. Front Cell Dev Biol. 2022. PMID: 36274840 Free PMC article. Review.
-
Through the lens of phase separation: intrinsically unstructured protein and chromatin looping.Nucleus. 2023 Dec;14(1):2179766. doi: 10.1080/19491034.2023.2179766. Nucleus. 2023. PMID: 36821650 Free PMC article. Review.
-
DNA regulatory element cooperation and competition in transcription.BMB Rep. 2024 Dec;57(12):509-520. doi: 10.5483/BMBRep.2024-0069. BMB Rep. 2024. PMID: 39523506 Free PMC article. Review.
References
-
- Agard D. A., Sedat J. W., Three-dimensional architecture of a polytene nucleus. Nature 302, 676–681 (1983). - PubMed
-
- Balbiani E. G., Sur la structure du noyau des cellules salivaires chez les larves de Chironomus. Zool. Anz. 4, 637–641 (1881).
-
- Cremer T., Cremer M., Cremer C., The 4D nucleome: Genome compartmentalization in an evolutionary context. Biochemistry (Mosc.) 83, 313–325 (2018). - PubMed
Publication types
MeSH terms
Substances
Grants and funding
LinkOut - more resources
Full Text Sources
Molecular Biology Databases

