. 2022 Aug 9;119(32):e2203247119.
doi: 10.1073/pnas.2203247119. Epub 2022 Aug 1.

T cells use distinct topographical and membrane receptor scanning strategies that individually coalesce during receptor recognition

Affiliations

T cells use distinct topographical and membrane receptor scanning strategies that individually coalesce during receptor recognition

En Cai et al. Proc Natl Acad Sci U S A. .

Abstract

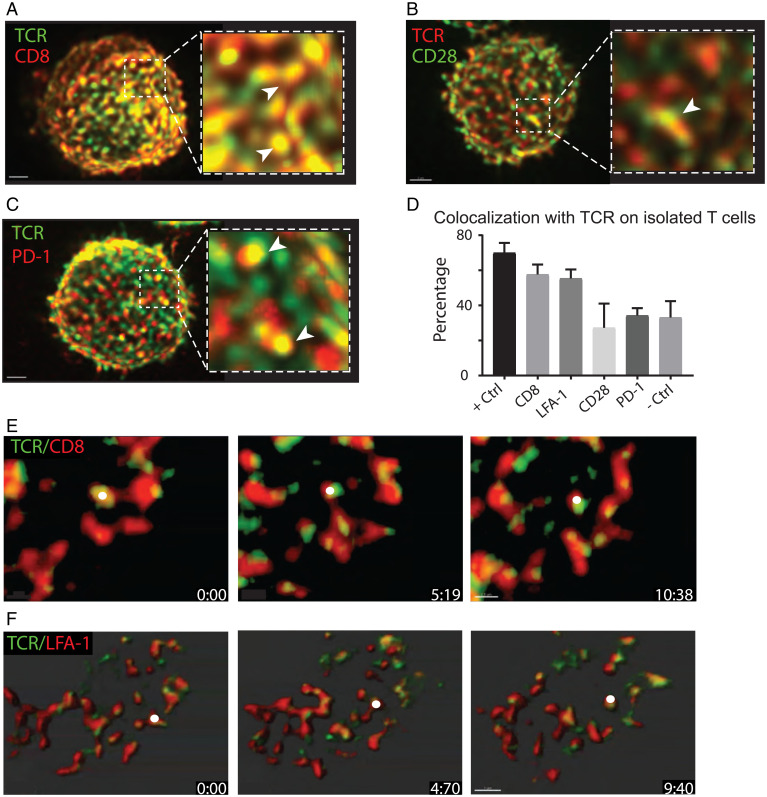
During immune surveillance, CD8 T cells scan the surface of antigen-presenting cells using dynamic microvillar palpation and movements as well as by having their receptors preconcentrated into patches. Here, we use real-time lattice light-sheet microscopy to demonstrate the independence of microvillar and membrane receptor patch scanning. While T cell receptor (TCR) patches can distribute to microvilli, they do so stochastically and not preferentially as for other receptors such as CD62L. The distinctness of TCR patch movement from microvillar movement extends to many other receptors that form patches that also scan independent of the TCR. An exception to this is the CD8 coreceptor which largely comigrates in patches that overlap with or are closely adjacent to those containing TCRs. Microvilli that assemble into a synapse contain various arrays of the engaged patches, notably of TCRs and the inhibitory receptor PD-1, creating a pastiche of occupancies that vary from microvillar contact to contact. In summary, this work demonstrates that localization of receptor patches within the membrane and on microvillar projections is random prior to antigen detection and that such random variation may play into the generation of many individually composed receptor patch compositions at a single synapse.

Keywords: T cell; T cell receptor; microvilli; synapse.


Conflict of interest statement

The authors declare no competing interest.

Figures

Fig. 1.
Fig. 1.
T cell receptors form high-density patches on previously activated T cells and distribute independent of microvilli. (A) LLSM image of a previously activated OT-I T cell stained with fluorescently labeled antibodies against CD45 (anti–CD45-Alexa647) and TCRαβ subunits (H57-Alexa488). The surface staining of TCR and CD45 is rendered in green and red, respectively. (Scale bar, 2 μm.) (B–D) Distribution of TCR patches relative to microvilli. Zoomed-in regions show examples of (B) TCR patches localized to the tip of a microvillus denoted by the yellow arrow, (C) a TCR patch localized outside of microvilli denoted by the green arrow, and (D) a microvillus with no TCR patches denoted by the red arrow. (E) Slice view of raw (Left) and thresholded (Right) TCR fluorescence intensity. (F) Thresholded data were used to create 3D surfaces, and TCR fluorescence intensity was summed within surfaces to define the thresholded patch integrated intensity where each point shown corresponds to a cell (n = 5). (G) Size distribution of patches in LLSM on an isolated T cell. The histogram of the patch surface area is obtained from a fixed OT-I T cell stained with fluorescently labeled antibodies against CD45 and TCRαβ subunits. Patch size was determined by using small triangles to cover the edge of the T cell in three dimensions and calculating the sum of the areas of small triangles that constitute the patch. TCR patch sizes are shown in green and CD45 patch sizes are shown in red. The black dashed line shows the patch size at the diffraction limit. (H) Patch size and intensity for TCR and CD45 on an isolated T cell. Patch surface area and intensity were measured from the same cell in G. Patch surface area and patch fluorescence intensity for TCR and CD45 patches are shown as green dots and red dots, respectively. The black dashed line shows the patch size at the diffraction limit. Solid lines are the linear fitted lines for the data. Fitting for TCR patches has a regression coefficient of 2.13 × 10⁵ with an R2 of 0.79. Fitting for CD45 patches has a regression coefficient of 5.24 × 10⁵ with an R2 of 0.89. (H, Inset) Zoomed-in view of the region in the light blue box. (I) Accumulation of CD62L in the microvilli. (I, Left) LLSM image of an OT-I T cell stained with anti–CD62L-Alexa488 (green) and anti–CD44-Alexa647 (red). (I, Right) Zoomed-in image of the cell region in the white dashed box. The white arrow points to a microvillus enriched with CD62L. (Scale bar, 2 μm.) (J) TCR patches localize independent of microvilli. (J, Left) LLSM image of an OT-I T cell stained with anti-TCRαβ (H57-Alexa488) and anti–CD62L-Alexa647. (J, Right) Zoomed-in image of the cell region in the white dashed box. The white arrow points to a microvillus enriched with CD62L but not TCR. (Scale bar, 2 μm.) (K) Relationship of TCR and CD62L patches. OT-I T cells (n = 3) were stained with anti-TCRαβ (H57-Alexa488) and anti–CD62L-Alexa647 at 4 °C and then fixed at 4 °C. Localizations of 266 CD62L patches over three cells were used to identify microvilli and measure colocalization of 121 TCR patches using a homebuilt algorithm described in Methods. Black bar: percentage of CD62L patches that overlapped with TCR patches (error bar: SD). Gray bar: percentage of TCR patches overlayed with CD62L patches (error bar: SD). (L) Comparison of TCR patch localization in relation to membrane curvature. T cells from OT-I mTmG mice that express membrane-targeted tdTomato were fixed and then stained with anti-TCRαβ (H57-Alexa488) and anti–CD45-Alexa647. (L, Top) TCR (green) intensity on the cell membrane in three dimensions. The coordinate system illustrates the vectors used for 2D projection. (L, Middle) Surface curvature obtained from CD45 intensity data. Local surface curvature is color-coded with a color map showing the relative curvature. A curvature scale bar that is close to binary (cyan: −0.5; magenta: 0.5) is used to indicate protrusions and valleys. (L, Bottom) Overlay of TCR intensity and surface curvature.The red arrow points to a microvillus with no TCR patches nearby; the green arrow points to a TCR patch on the flatter membrane region and the yellow arrow points to a TCR patch colocalizing with a microvillus. (M) Two-dimensional projections of cell volumes from J. For ease of visualization, overlay is shown with TCR in green and curvature in red. Arrows denote sites where TCR patches locate on microvilli (yellow) and on flatter membrane regions (green), and where microvilli contain no obvious TCR patches (red). The coordinates show the directions along which the 2D projection was generated from the 3D cell surface. (Scale bar, 2 μm. The pixel size is not uniform in the 2D projection due to morphing. This scale bar is an approximation.)
Fig. 2.
Fig. 2.
TCR high-density patches move independently relative to microvilli. (A) Time series of a TCR patch (yellow arrows) moving over a microvillus. The T cell surface is rendered based on fluorescent signals of CD45. TCR patches labeled with anti-TCRαβ are shown in green. The surface is color-coded to show the curvature, with cyan showing the concave regions and magenta showing the protrusions. (B) Time series of a TCR patch (yellow arrows) transiently interacting with a microvillus during the time course of 14 s. (C) Example trajectories of TCR patches that are independently associated (Left), transiently associated (Middle), or in prolonged association (Right) with microvilli. The trajectories are color-coded according to time. Data are extracted from the LLSM movie of a live OT-I T cell stained with anti–CD45-Alexa647 and anti–TCRαβ-Alexa488. TCR patches and microvilli were tracked using the particle tracking function in Imaris. (D) The trajectory of a TCR patch that sequentially interacts with two distinct microvilli. (E) Fluorescence intensity of TCR patches during interaction with microvilli. Blue: the fluorescence intensity of a TCR patch that is independent of microvilli. Red: the fluorescence intensity of a TCR patch that is transiently associated with a microvillus. Yellow: the fluorescent intensity of a TCR patch that is in prolonged association with a microvillus. (F) Decay graph of the association of microvilli with TCR patches. The graph represents TCR patches that have interactions with a microvillus within a 0.5-μm distance (n = 5 cells). Each data point represents the mean ± SEM of the percentage of TCR patches that remain in contact with microvilli at the specific time point.
Fig. 3.
Fig. 3.
Independent patch-like distributions of surface receptors relative to TCRs. (A) The LLSM image of a fixed OT-I T cell stained with anti–TCR-Alexa488 and anti–CD8-Alexa647. The image shows the front half of the cell to demonstrate the overlap between TCR (green) and CD8 (red). The region in the white box is zoomed-in to show more detail, and the white arrows mark examples of colocalization of CD8 patches (red) with TCR patches (green). (Scale bar, 2 μm.) (B) The LLSM image of a fixed OT-I T cell stained with anti–TCR-Alexa488 and anti–CD28-Alexa647. The image shows the front half of the cell to demonstrate the overlap between TCR (red) and CD28 (green). The region in the white box is zoomed-in to show more detail, and the white arrow marks an example of colocalization of CD28 patches with TCR patches. (Scale bar, 2 μm.) (C) The LLSM image of a fixed OT-I T cell stained with anti–TCR-Alexa488 and anti–PD-1-Alexa647. The image shows the front half of the cell to demonstrate the overlap between TCR (green) and PD-1 (red). The region in the white box is zoomed-in to show more detail, and the white arrows mark examples of colocalization of PD-1 patches (red) with TCR patches (green). (Scale bar, 2 μm.) (D) Percentage of patches colocalizing with TCR patches on isolated T cells for each receptor. Receptor patches are segmented from the surface of the cells and a coreceptor patch with over 20% surface area overlap with a TCR patch is considered as colocalized with the TCR patch. OT-I T cells stained with different clones of antibodies to TCR (H57-Alexa488 and TCR-Vα-Alexa647) are used as positive controls. OT-I T cells stained with antibodies to CD44 and CD62L are used as negative controls. Number of cells used for receptor–TCR colocalization analysis: positive control (n = 2), CD8 (n = 3), CD11a (n = 3), CD28 (n = 2), PD-1 (n = 4), and negative control (n = 5) (error bars: SD). (E) Time series of LLSM images of a live OT-I T cell stained with anti–TCR-Alexa488 and anti–CD8-Alexa647. TCRs are shown in green and CD8 patches are shown in red. The white dots denote an example of a CD8 patch that colocalizes and moves with a TCR patch. (Scale bar, 0.5 μm.) (F) Time series of LLSM images of a live OT-I T cell stained with anti–TCR-Alexa488 and anti–CD11a-Alexa647. TCRs are shown in green and LFA-1 patches are shown in red. The white dots denote an example of an LFA-1 patch that colocalizes and moves with a TCR patch. (Scale bar, 1 μm.)
Fig. 4.
Fig. 4.
TCR patches and PD-1 patches converge to microvillar tips upon antigen detection. (A) Principle of synaptic contact mapping. Fluorescent Qdot beads of ∼16-nm diameter are incorporated into lipid bilayers which are then seeded with ligands for T cells. Qdot exclusion from a region occurs when a microvillus approaches the bilayer, leading to exclusion of Qdots from this region and a “hole” in the otherwise flat fluorescent field formed by the Qdots. (B) SCM image of a synapse of an OT-I T cell formed on a lipid bilayer containing ICAM-1 and N4. OT-I T cells are stained with anti–TCR-Alexa488. TCR microclusters are in green; Qdot (QD) signal is in red. Dark spots (as indicated by white arrows) show the locations of microvilli contacting the bilayer where Qdots are sterically excluded. (C) TCR occupancy from SCM images for cells interacting with bilayer containing activating N4 pMHC (85.5 ± 3.5% [mean ± SEM], n = 7) and cells interacting with bilayer containing no activating N4 pMHC (25.6 ± 9.4% [mean ± SEM], n = 6). ***P = 0.0004, unpaired t test with Welch’s correction. (D) TCR occupancy of microvilli on an activating bilayer with N4 pMHC segmented by transient, persistent, and ultrapersistent microvilli. Transient microvillar contacts were defined as contacts with persistence times shorter than 3 sigma above the average persistence time of TCR contacts (cutoffs ranging from ≤4 to 10 s between cells). Persistent microvillar contacts were defined as contacts with persistence times greater than 3 sigma above the average persistence time of TCR contacts (cutoffs ranging from ≥4 to 10 s between cells). Ultrapersistent microvillar contacts were defined as contacts with persistence time over 90 s. *P = 0.0229 for the transient and persistent group, **P = 0.0034 for the persistent and ultrapersistent group, and **P = 0.0019 for the transient and ultrapersistent group. All statistical comparisons were made using paired t test (n = 5). (E) PD-1 accumulation at contacts during synapse formation by LLSM. Image of a Jurkat cell genetically expressing PD-1-mNeonGreen (green) interacting with a CHO cell expressing PD-L1-mScarlet (red) and the TCR activator. The synapse region in the white dashed box is zoomed-in and the time series of the region is shown (Right). White arrows in each panel mark the same patch of PD-1 at different time points. (Scale bar, 2 μm.) (F) Increase of fluorescence intensity of a PD-1 punctum from E. PD-1 puncta (n = 5) were tracked using Imaris and mean intensity was measured for each punctum over time (error bars: SD). (G) SCM image of a synapse of an OT-I T cell formed on a lipid bilayer containing ICAM-1, N4, and PD-L1. TCR signal is shown in green, PD-1 signal is shown in red, and Qdot signal is shown in cyan. Dark spots (as indicated by the white arrow) show the locations of microvilli contacting the bilayer where Qdots are sterically excluded. (H) Percentage of microvilli on synapses (n = 9) occupied by TCR clusters only (green) and both TCR and PD-1 clusters (blue). *P = 0.0336, paired t test. (I) Percentage of microvilli on synapses (n = 9) occupied by PD-1 clusters only (red) and both TCR and PD-1 clusters (blue). P = 0.2607, paired t test. n.s., not significant.

References

    1. Davis M. M., et al. , T cells as a self-referential, sensory organ. Annu. Rev. Immunol. 25, 681–695 (2007). - PubMed
    1. van der Merwe P. A., Dushek O., Mechanisms for T cell receptor triggering. Nat. Rev. Immunol. 11, 47–55 (2011). - PubMed
    1. Grakoui A., et al. , The immunological synapse: A molecular machine controlling T cell activation. Science 285, 221–227 (1999). - PubMed
    1. Fooksman D. R., et al. , Functional anatomy of T cell activation and synapse formation. Annu. Rev. Immunol. 28, 79–105 (2010). - PMC - PubMed
    1. Gérard A., et al. , Detection of rare antigen-presenting cells through T cell-intrinsic meandering motility, mediated by Myo1g. Cell 158, 492–505 (2014). - PMC - PubMed

Publication types

MeSH terms

Substances