

Random encounters and amoeba locomotion drive the predation of Listeria monocytogenes by Acanthamoeba castellanii
- PMID: 35914149
- PMCID: PMC9371647
- DOI: 10.1073/pnas.2122659119
Random encounters and amoeba locomotion drive the predation of Listeria monocytogenes by Acanthamoeba castellanii
Abstract
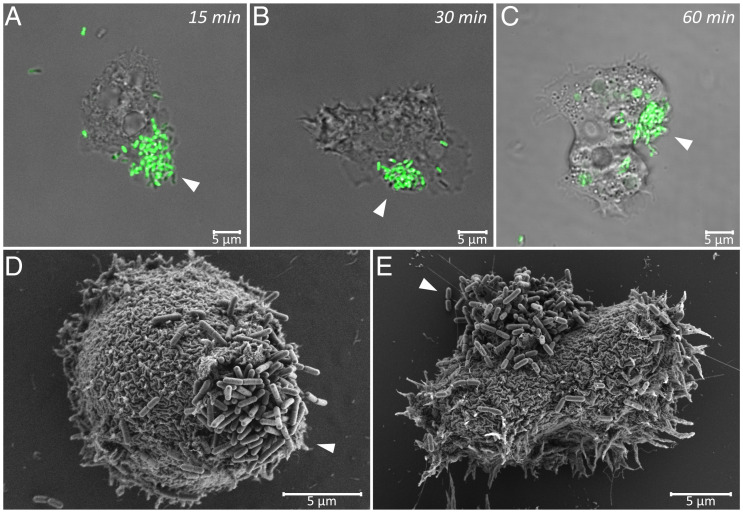
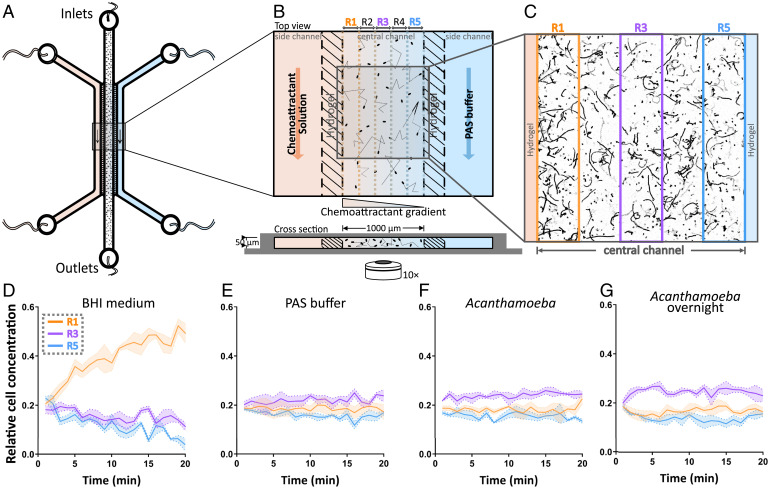
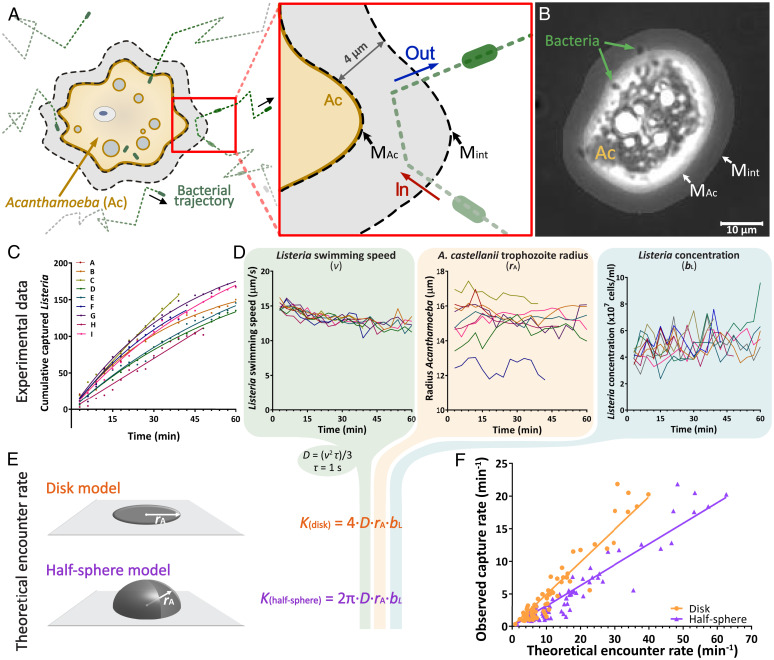
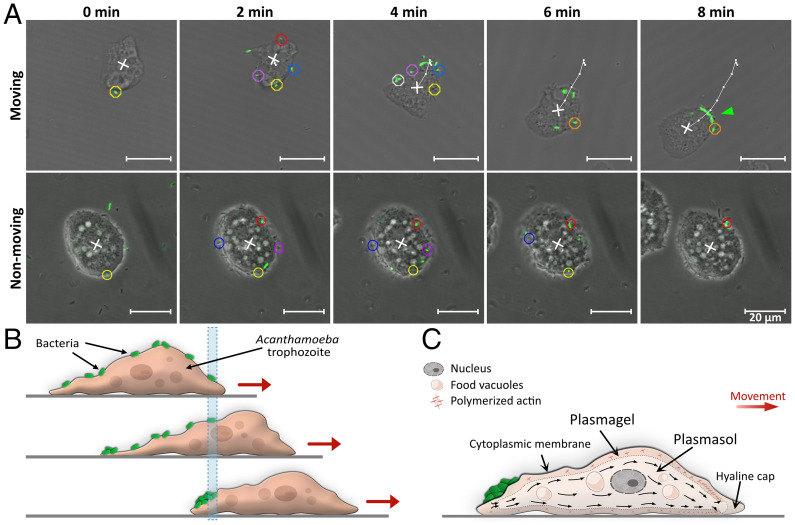
Predatory protozoa play an essential role in shaping microbial populations. Among these protozoa, Acanthamoeba are ubiquitous in the soil and aqueous environments inhabited by Listeria monocytogenes. Observations of predator-prey interactions between these two microorganisms revealed a predation strategy in which Acanthamoeba castellanii assemble L. monocytogenes in aggregates, termed backpacks, on their posterior. The rapid formation and specific location of backpacks led to the assumption that A. castellanii may recruit L. monocytogenes by releasing an attractant. However, this hypothesis has not been validated, and the mechanisms driving this process remained unknown. Here, we combined video microscopy, microfluidics, single-cell image analyses, and theoretical modeling to characterize predator-prey interactions of A. castellanii and L. monocytogenes and determined whether bacterial chemotaxis contributes to the backpack formation. Our results indicate that L. monocytogenes captures are not driven by chemotaxis. Instead, random encounters of bacteria with amoebae initialize bacterial capture and aggregation. This is supported by the strong correlation between experimentally derived capture rates and theoretical encounter models at the single-cell level. Observations of the spatial rearrangement of L. monocytogenes trapped by A. castellanii revealed that bacterial aggregation into backpacks is mainly driven by amoeboid locomotion. Overall, we show that two nonspecific, independent mechanisms, namely random encounters enhanced by bacterial motility and predator surface-bound locomotion, drive backpack formation, resulting in a bacterial aggregate on the amoeba ready for phagocytosis. Due to the prevalence of these two processes in the environment, we expect this strategy to be widespread among amoebae, contributing to their effectiveness as predators.
Keywords: Acanthamoeba; Listeria; capture dynamics; predation; random encounter.
Conflict of interest statement
The authors declare no competing interest.
Figures
Similar articles
-
Unravelling mechanisms of bacterial recognition by Acanthamoeba: insights into microbial ecology and immune responses.Front Microbiol. 2024 Aug 23;15:1405133. doi: 10.3389/fmicb.2024.1405133. eCollection 2024. Front Microbiol. 2024. PMID: 39247694 Free PMC article. Review.
-
Acanthamoeba feature a unique backpacking strategy to trap and feed on Listeria monocytogenes and other motile bacteria.Environ Microbiol. 2013 Feb;15(2):433-46. doi: 10.1111/j.1462-2920.2012.02858.x. Epub 2012 Aug 23. Environ Microbiol. 2013. PMID: 22925311
-
Acanthamoeba release compounds which promote growth of Listeria monocytogenes and other bacteria.Appl Microbiol Biotechnol. 2014 Apr;98(7):3091-7. doi: 10.1007/s00253-014-5534-9. Epub 2014 Feb 23. Appl Microbiol Biotechnol. 2014. PMID: 24562324
-
Interactions between the environmental pathogen Listeria monocytogenes and a free-living protozoan (Acanthamoeba castellanii).Environ Microbiol. 2007 Apr;9(4):913-22. doi: 10.1111/j.1462-2920.2006.01213.x. Environ Microbiol. 2007. PMID: 17359263
-
How the interaction of Listeria monocytogenes and Acanthamoeba spp. affects growth and distribution of the food borne pathogen.Appl Microbiol Biotechnol. 2014 Apr;98(7):2907-16. doi: 10.1007/s00253-014-5546-5. Epub 2014 Feb 21. Appl Microbiol Biotechnol. 2014. PMID: 24557567 Review.
Cited by
-
Risk-reward trade-off during carbon starvation generates dichotomy in motility endurance among marine bacteria.Nat Microbiol. 2025 Jun;10(6):1393-1403. doi: 10.1038/s41564-025-01997-7. Epub 2025 May 26. Nat Microbiol. 2025. PMID: 40419768 Free PMC article.
-
Enhanced transport of bacteria along root systems by protists can impact plant health.Appl Environ Microbiol. 2024 Apr 17;90(4):e0201123. doi: 10.1128/aem.02011-23. Epub 2024 Mar 27. Appl Environ Microbiol. 2024. PMID: 38534145 Free PMC article.
-
Multiplexed Microfluidic Platform for Parallel Bacterial Chemotaxis Assays.Bio Protoc. 2024 Sep 5;14(17):e5062. doi: 10.21769/BioProtoc.5062. eCollection 2024 Sep 5. Bio Protoc. 2024. PMID: 39282234 Free PMC article.
-
Flagellin O-linked glycans are required for the interactions between Campylobacter jejuni and Acanthamoebae castellanii.Microbiology (Reading). 2023 Aug;169(8):001386. doi: 10.1099/mic.0.001386. Microbiology (Reading). 2023. PMID: 37610804 Free PMC article.
-
Unravelling mechanisms of bacterial recognition by Acanthamoeba: insights into microbial ecology and immune responses.Front Microbiol. 2024 Aug 23;15:1405133. doi: 10.3389/fmicb.2024.1405133. eCollection 2024. Front Microbiol. 2024. PMID: 39247694 Free PMC article. Review.
References
-
- Estes J. A., et al. , Trophic downgrading of planet earth. Science 333, 301–306 (2011). - PubMed
-
- de Oliveira Calleia F., Rohe F., Gordo M., Hunting strategy of the margay (Leopardus wiedii) to attract the wild pied tamarin (Saguinus bicolor). Neotrop. Primates 16, 32–34 (2009).
-
- Meyer-Rochow V. B., Glowworms: A review of Arachnocampa spp. and kin. Luminescence 22, 251–265 (2007). - PubMed
-
- Stowe M. K., Tumlinson J. H., Heath R. R., Chemical mimicry: Bolas spiders emit components of moth prey species sex pheromones. Science 236, 964–967 (1987). - PubMed
-
- Johnke J., et al. , Multiple micro-predators controlling bacterial communities in the environment. Curr. Opin. Biotechnol. 27, 185–190 (2014). - PubMed
Publication types
MeSH terms
LinkOut - more resources
Full Text Sources
