. 2022 Aug 9;119(32):e2111726119.
doi: 10.1073/pnas.2111726119. Epub 2022 Aug 1.

Lymph-derived chemokines direct early neutrophil infiltration in the lymph nodes upon Staphylococcus aureus skin infection

Affiliations

Lymph-derived chemokines direct early neutrophil infiltration in the lymph nodes upon Staphylococcus aureus skin infection

Jingna Xue et al. Proc Natl Acad Sci U S A. .

Abstract

A large number of neutrophils infiltrate the lymph node (LN) within 4 h after Staphylococcus aureus skin infection (4 h postinfection [hpi]) and prevent systemic S. aureus dissemination. It is not clear how infection in the skin can remotely and effectively recruit neutrophils to the LN. Here, we found that lymphatic vessel occlusion substantially reduced neutrophil recruitment to the LN. Lymphatic vessels effectively transported bacteria and proinflammatory chemokines (i.e., Chemokine [C-X-C motif] motif 1 [CXCL1] and CXCL2) to the LN. However, in the absence of lymph flow, S. aureus alone in the LN was insufficient to recruit neutrophils to the LN at 4 hpi. Instead, lymph flow facilitated the earliest neutrophil recruitment to the LN by delivering chemokines (i.e., CXCL1, CXCL2) from the site of infection. Lymphatic dysfunction is often found during inflammation. During oxazolone (OX)-induced skin inflammation, CXCL1/2 in the LN was reduced after infection. The interrupted LN conduits further disrupted the flow of lymph and impeded its communication with high endothelial venules (HEVs), resulting in impaired neutrophil migration. The impaired neutrophil interaction with bacteria contributed to persistent infection in the LN. Our studies showed that both the flow of lymph from lymphatic vessels to the LN and the distribution of lymph in the LN are critical to ensure optimal neutrophil migration and timely innate immune protection in S. aureus infection.

Keywords: infection; lymph flow; lymph node; lymphatic vessel; neutrophil.


Conflict of interest statement

The authors declare no competing interest.

Figures

Fig. 1.
Fig. 1.
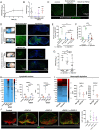
The first wave of neutrophil recruitment in the LN depends on lymph flow. (A) A representative picture of the procedure of suturing afferent lymphatic vessels. (B) FITC distribution in pLN cryosections of sham and sutured WT mice after they are i.d. injected with FITC at the footpad. n = 5 per group. (C) Schematic diagram of lymphatic suture before infection, 10 mpi, and 2 hpi. (D) Neutrophils (CD11b+Ly6G+) in the draining pLN were quantified by flow cytometry. n = 6 to 7. Data are mean ± SD (Mann–Whitney test). (E) Neutrophil (LysM-GFP+) accumulation on SCS by imaging whole-mount pLNs. n = 3 to 5 per group. (F) Cryosections of pLNs were stained with anti-Ly6G (green; neutrophils) and anti-Lyve1 (red; lymphatic endothelial cells). n = 4 to 5 per group. **P < 0.01; ns, no significance.
Fig. 2.
Fig. 2.
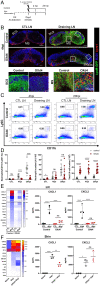
Chemokines but not bacteria in the LN are essential to recruit neutrophils within 4 hpi. (A) Kinetics of S. aureus accumulation (CFUs) in pLNs (10 mpi, 2 hpi, and 4 hpi). (B) S. aureus CFUs in the pLNs at 4 hpi in control, suture before infection, and suture at 10 mpi groups. (C) GFP S. aureus distribution in the SCS by imaging whole-mount LN. n = 3 to 5 per group. (D) Neutrophil accumulation in iLNs at 4 hpi with i.d. or i.n. injection of Evans Blue or S. aureus plus Evans Blue in phosphate buffered saline (PBS). Evans Blue showed lymph distribution. Arrows indicate i.n. injection site. (E and F) Image quantification of neutrophils on SCS of whole-mount LN (E) and LN cryosection (F). (G) S. aureus CFUs in the LNs at 4 hpi with i.d. or i.n. S. aureus infection. (H) Chemokine/cytokine array of pLNs from control, 2 hpi, 4 hpi, suture before, and suture at 2 hpi groups. n = 3 to 4. (I) Chemokine/cytokine array of the pLN at 4 hpi in mice treated with rat IgG or anti-Gr1 antibody. n = 4. (J) Neutrophil (green) distribution in pLN at 2 h after rCXCL1, rCXCL2, or combination injection. n = 5 to 7. (A, B, and EJ). Data are mean ± SD (unpaired one-way ANOVA [EH and J] or unpaired Student’s t test [I]). *P < 0.05; **P < 0.01; ***P < 0.001; ****P < 0.0005; ns, no significance.
Fig. 3.
Fig. 3.
OX skin inflammation interrupts neutrophil positioning when exposed to secondary infection. (A) The schematic diagram of the experimental design. Mice were treated with OX on their shaved abdomens. Four days after OX treatment (OXd4), control (uninflamed) and OXd4 (inflamed) mice were infected with 2.5 × 10⁷ S. aureus i.d. in the right flank. The contralateral (CTL) and the draining iLNs were collected at 4 or 24 hpi. (B) Neutrophil distribution (LysM-GFP+) at 4 hpi in iLN cryosections stained with anti-B220 (blue; B cells) and anti-Lyve1 (red). n = 5. (C) Representative flow cytometry scatterplots of neutrophil (CD11b+Ly6G+) at 4 and 20 hpi in control and OXd4 iLNs. (D) LN cell counts and neutrophil quantification at 4 and 20 hpi in control and OXd4 iLNs by flow cytometry. n = 7 to 9. Data are mean ± SD (multiple Student’s t test). (E and F) Chemokine/cytokine level in the LN (E) and skin (F) of control and OXd4 mice. n = 3 to 4 per group. Data are mean ± SD (unpaired one-way ANOVA). *P < 0.05; **P < 0.01; ***P < 0.001; ****P < 0.0005; ns, no significance.
Fig. 4.
Fig. 4.
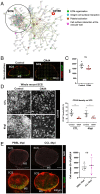
Neutrophil migration does not depend on SCS macrophages. (A) Proteomics analysis. LNs were collected from control and OXd4 mice at 4 hpi. Reactome pathway analysis using STRING-DB showed reduced ECM proteins and Siglec1 (CD169) in the OXd4 LNs compared with the control LNs. (B) CD169 (red) and Lyve1 (green) in control and OXd4 LNs. (C) MFIs of CD169 in control and OXd4 LNs quantified by flow cytometry. (D) Anti-CD169 IF staining on whole-mount iLNs collected at 4 hpi (gray; SCS macrophages; Left). CD169 density on SCS quantification per region of interest (ROI; Right). n = 7. (E) Neutrophil recruitment in macrophage depletion mice. (Upper Left) Anti-CD169 (red) and DAPI (gray; nuclei staining). (Lower Left) Anti-Lyve1 (green) and anti-Gr1 (red; neutrophils and monocytes). n = 4 per group. (CE) Data are mean ± SD (unpaired Student’s t test). CLL, clodronate liposome; PBSL, PBS liposome. *P < 0.05; **P < 0.01; ns, no significance.
Fig. 5.
Fig. 5.
OX skin inflammation impairs lymph flow in conduits. (A) Conduit (red) in control and OXd4 iLNs (Left). The density (Center) and the diameter (Right) of collagen I+ conduits in the iLNs of control and OXd4 mice. n = 4 to 5 per group. (B) The schematic diagram of the experimental design. Mice were treated with OX on their shaved abdomens. The control and OXd4 mice were treated with FITC on both flanks. After 2 or 24 h, the iLNs were collected for analysis. (C) FITC distribution with conduits in the iLNs at 2 h after FITC sensitization. LN cryosections were stained with anti-ERTR7 (red; FRCs) and anti-collagen I (blue; conduit). (D) FITC distribution (Left) and density (Right) at 24 h after FITC sensitization. Scale bar = 200 μm. (E) 3D-reconstructed images of FITC in whole-mount LN at 24 h after FITC sensitization (Left). FITC density with depth was quantified every 30 μm from the capsule (Right). n > 5 mice per group. (FI). Control and OXd4 LNs were collected at 2 and 24 h after FITC sensitization. (F) Representative flow cytometry plot of FITC+ DCs. (GI) FITC+cDC2, cDC1, and SCS macrophage quantification. n = 10 iLNs/group. (A, D, E, and GI) Data are mean ± SEM (unpaired one-way ANOVA [A and GI] or unpaired Student’s t test [D and E]). *P < 0.05; **P < 0.01; ***P < 0.001; ****P < 0.0005; ns, no significance.
Fig. 6.
Fig. 6.
OX skin inflammation interrupts lymph reaching HEVs and changes neutrophil migration in HEVs. (A) Distribution of HEVs in control and OXd4 iLNs. Cryosections were stained with anti-PNAd (red; HEV) and anti-Lyve1 (green) antibodies to show HEVs and sinuses (Left). The distance between HEVs with the SCS or MS in the control and OXd4 LNs (Right). n = 4. (B and C) FITC HEV distribution in control and OXd4 iLNs at 4 h after FITC treatment. (D) Quantification of FITC density per HEV near the SCS or MS in control and OXd4 iLNs. n = 5 to 6. Data are mean ± SD (unpaired Student’s t test). (E) Neutrophil (LysM-GFP) distribution around HEVs (PNAd) in control and OXd4 LN. (F) Neutrophil (GFP) intensity in luminal and abluminal areas of HEVs (PNAd). n = 4 to 5. Data are mean ± SD (unpaired Student’s t test). (G) Neutrophil (LysM-GFP) distribution in the pLNs 2 h after rCXCL1 injection. n = 4. *P < 0.05; **P < 0.01; ***P < 0.001; ****P < 0.0005; ns, no significance.
Fig. 7.
Fig. 7.
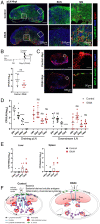
Delayed bacterial clearance in the OXd4 LNs. (A) Neutrophil distribution (LysM-GFP) in pLNs at 4 hpi in control and OXd4 mice. (B) The schematic diagram of the experimental design (Upper). S. aureus was injected in the footpad of control and OXd4 mice. The draining pLNs were collected at 4 hpi. S. aureus CFUs (Lower) in control and OXd4 pLNs. n = 6 per group. Data are mean ± SD (unpaired Student’s t test). (C) GFP S. aureus and neutrophil distribution in the control and OXd4 pLNs. (D and E) Bacterial load (CFUs) in control and OXd4 mice. The draining pLNs, downstream iLNs (D), spleen, and liver (E) were collected on different days postinfection. n = 6 to 8 per group. Data are mean ± SD (unpaired one-way ANOVA). (F) Schematic diagram of neutrophil positioning in the LN. At an early stage of infection, lymph flow transports S. aureus to the SCS. Soluble antigens and regulatory factors in lymph can reach the HEVs throughout the LN to direct neutrophils migration. Skin inflammation reduces the transport of lymph-borne factors (including chemokines) to the LN. LN cell expansion and conduit remodeling change lymph–HEV communication in LN. Lymph could reach HEVs in the MS but not those in the interfollicular and T cell zone (close to the SCS). Consequently, neutrophils preferentially transmigrate through the HEVs in the MS of the OXd4 LNs. *P < 0.05; ****P < 0.0005; ns, no significance.

Similar articles

Cited by

References

    1. Kolaczkowska E., Kubes P., Neutrophil recruitment and function in health and inflammation. Nat. Rev. Immunol. 13, 159–175 (2013). - PubMed
    1. Kastenmüller W., Torabi-Parizi P., Subramanian N., Lämmermann T., Germain R. N., A spatially-organized multicellular innate immune response in lymph nodes limits systemic pathogen spread. Cell 150, 1235–1248 (2012). - PMC - PubMed
    1. Gerner M. Y., Torabi-Parizi P., Germain R. N., Strategically localized dendritic cells promote rapid T cell responses to lymph-borne particulate antigens. Immunity 42, 172–185 (2015). - PubMed
    1. Liao S., von der Weid P. Y., Lymphatic system: An active pathway for immune protection. Semin. Cell Dev. Biol. 38, 83–89 (2015). - PMC - PubMed
    1. Qi H., Kastenmüller W., Germain R. N., Spatiotemporal basis of innate and adaptive immunity in secondary lymphoid tissue. Annu. Rev. Cell Dev. Biol. 30, 141–167 (2014). - PubMed

Publication types