

Alcohol-Attributable Deaths Help Drive Growing Socioeconomic Inequalities In US Life Expectancy, 2000-18
- PMID: 35914205
- PMCID: PMC9639704
- DOI: 10.1377/hlthaff.2021.01905
Alcohol-Attributable Deaths Help Drive Growing Socioeconomic Inequalities In US Life Expectancy, 2000-18
Abstract
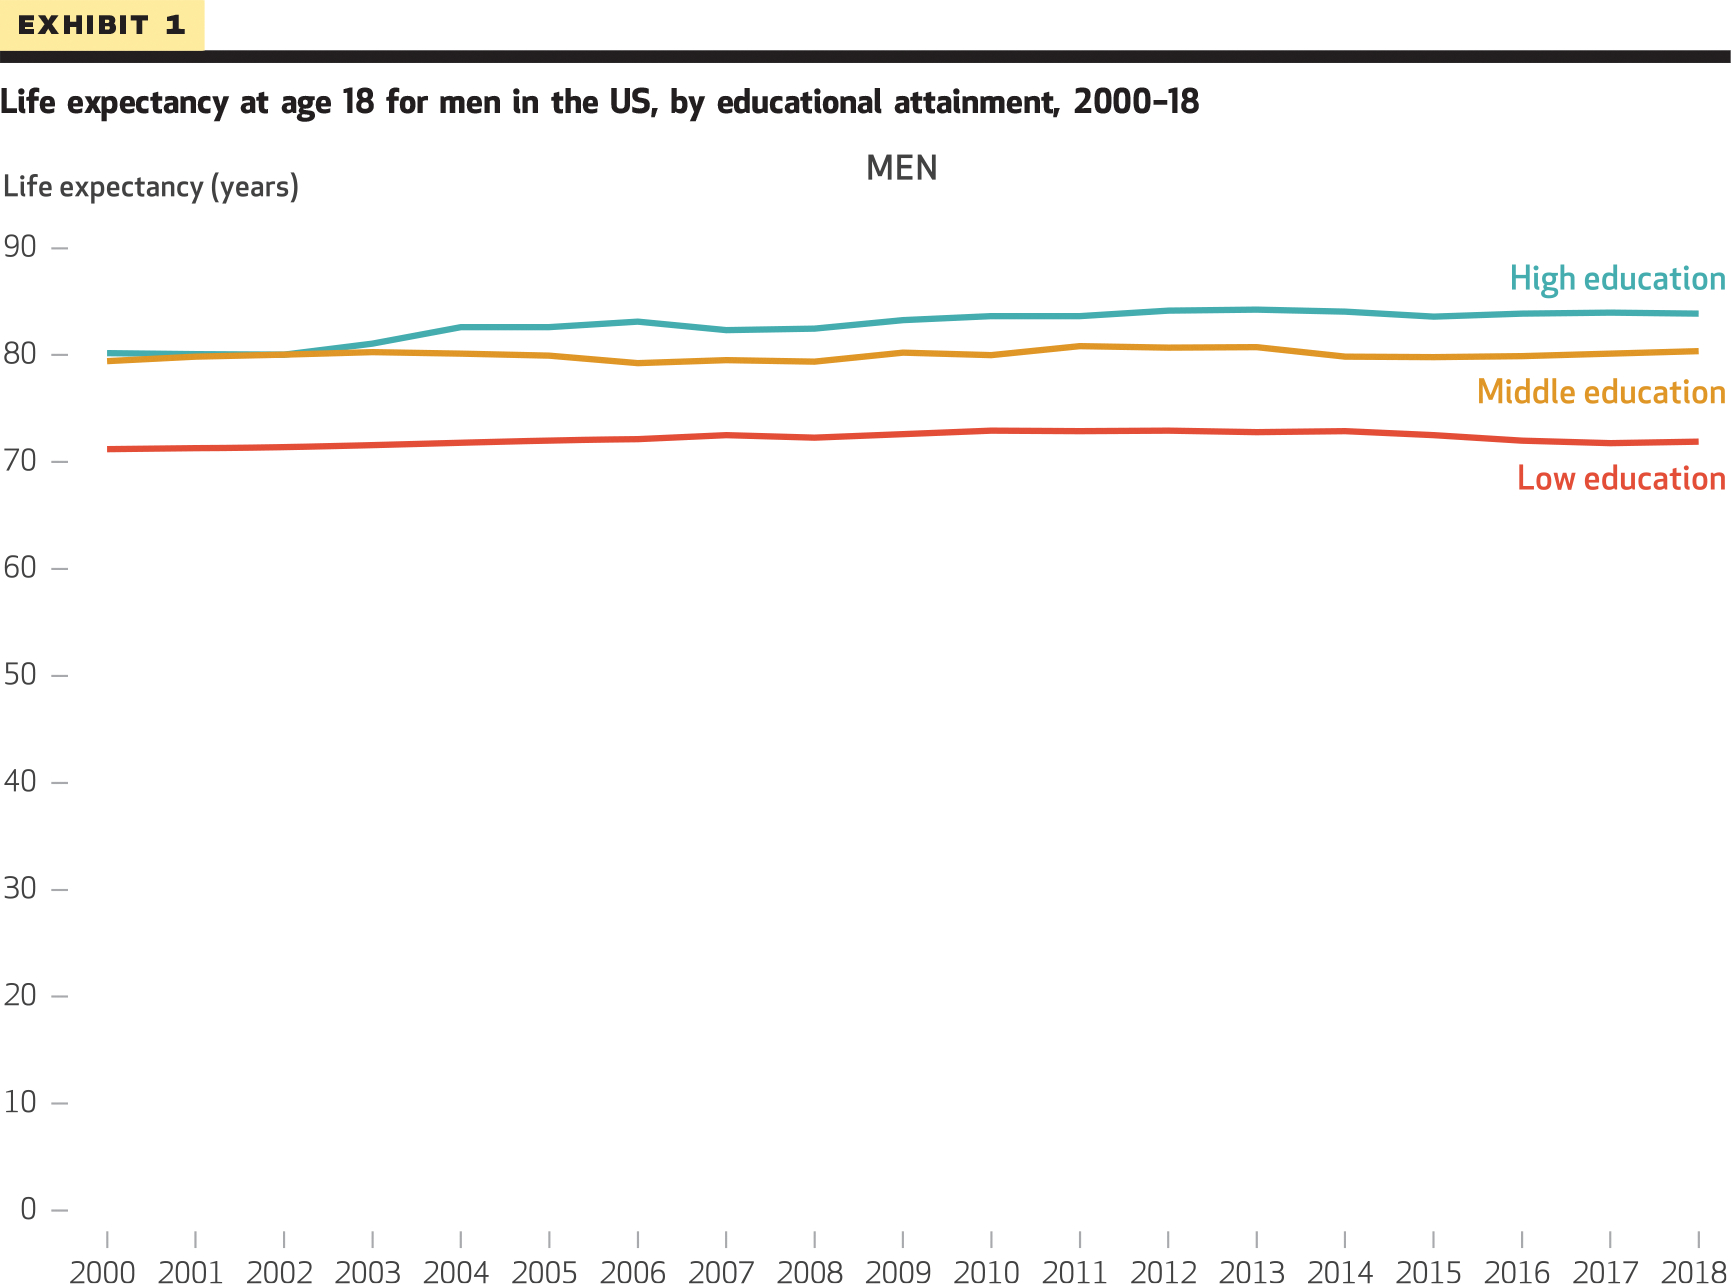
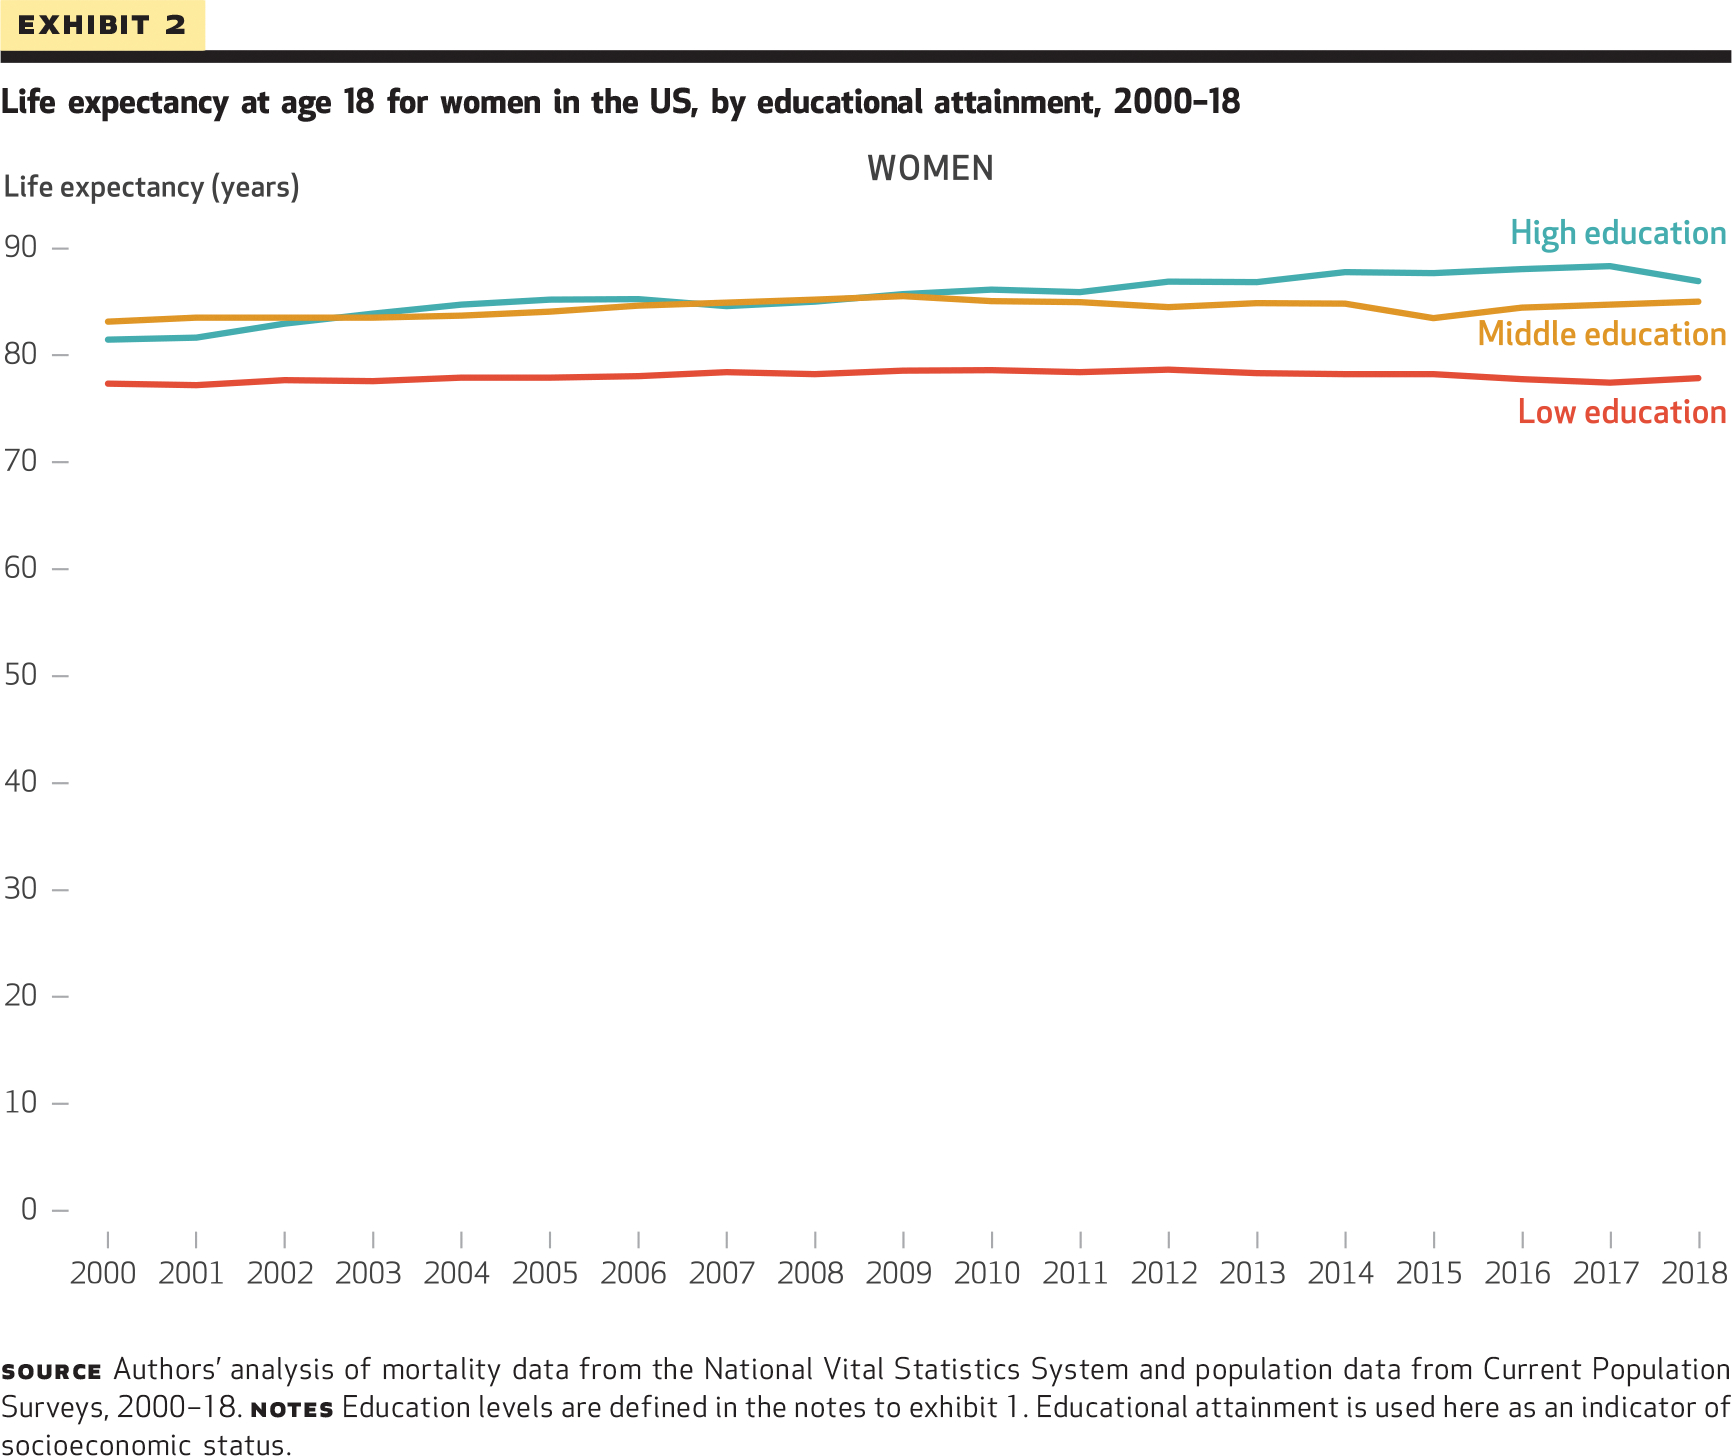
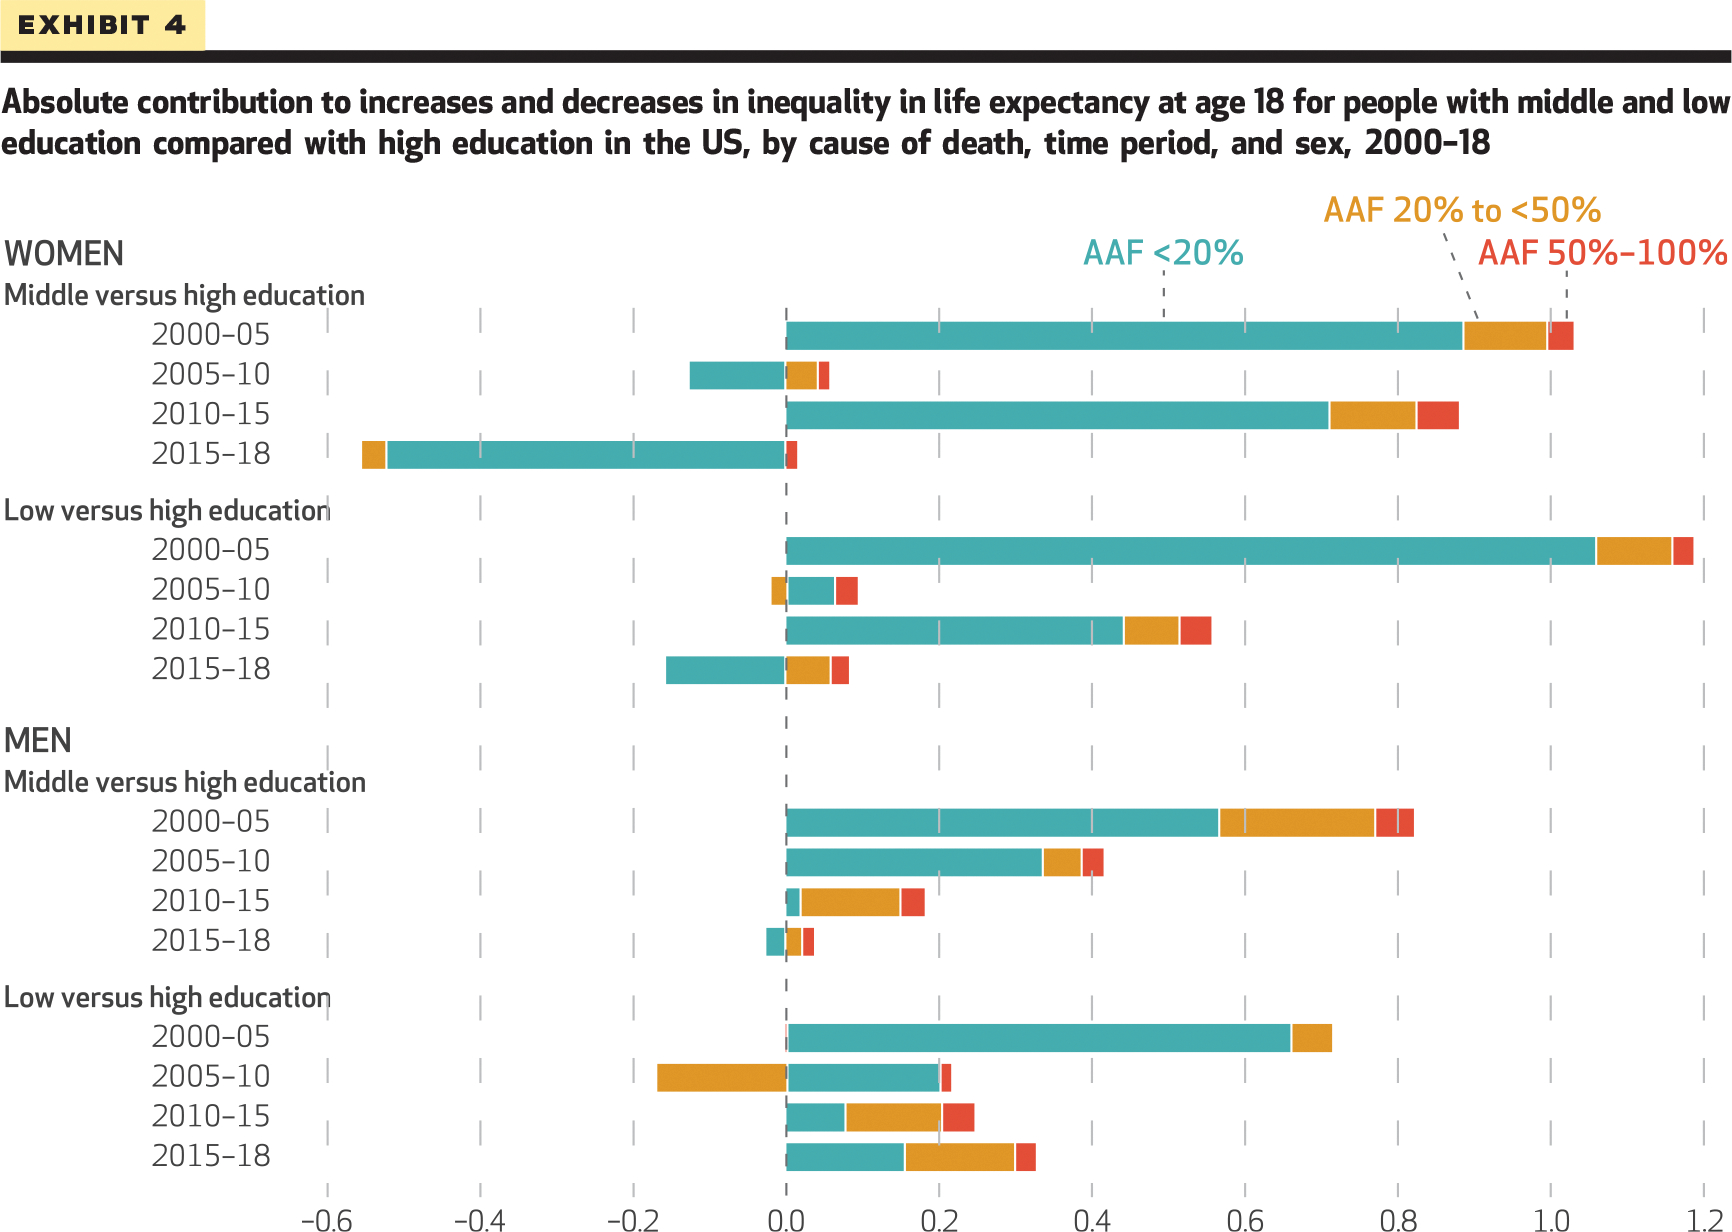
Socioeconomic gaps in life expectancy have widened substantially in the United States since 2000. Yet the contribution of specific causes to these growing disparities remains unknown. We used death records from the National Vital Statistics System and population data from Current Population Surveys to quantify the contribution of alcohol-attributable causes of death to changes in US life expectancy between 2000 and 2018 by sex and socioeconomic status (as measured by educational attainment). During the study period, the gap in life expectancy between people with low (high school diploma or less) compared with high (college degree) levels of education increased by three years among men and five years among women. Between 2000 and 2010 declines in cardiovascular disease mortality among people with high education made major contributions to growing inequalities. In contrast, between 2010 and 2018 deaths from a cause with an alcohol-attributable fraction of 20 percent or more were a dominant driver of socioeconomic divergence. Increased efforts to implement cost-effective alcohol control policies will be essential for reducing health disparities.
Figures
References
-
- Riley JC. Rising life expectancy: a global history. Cambridge: Cambridge University Press; 2001.
-
- Deaton A The great escape: health, wealth, and the origins of inequality. Princeton (NJ): Princeton University Press; 2013.
-
- Kochanek KD, Anderson RN, Arias E. Changes in life expectancy at birth, 2010–2018 [Internet]. Hyattsville (MD): National Center for Health Statistics; 2020. Jan 30 [cited 2022 June 16]. Available from: https://www.cdc.gov/nchs/data/hestat/life-expectancy/life-expectancy-201...
Publication types
MeSH terms
Grants and funding
LinkOut - more resources
Full Text Sources
Medical
Miscellaneous