. 2022 Aug 22;57(16):1995-2008.e5.
doi: 10.1016/j.devcel.2022.07.007. Epub 2022 Jul 31.

Variability of cross-tissue X-chromosome inactivation characterizes timing of human embryonic lineage specification events

Affiliations

Variability of cross-tissue X-chromosome inactivation characterizes timing of human embryonic lineage specification events

Jonathan M Werner et al. Dev Cell. .

Abstract

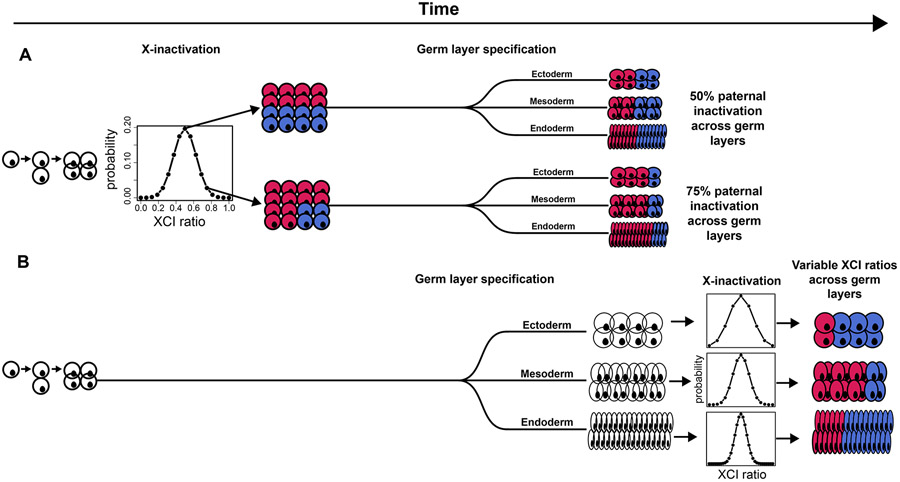
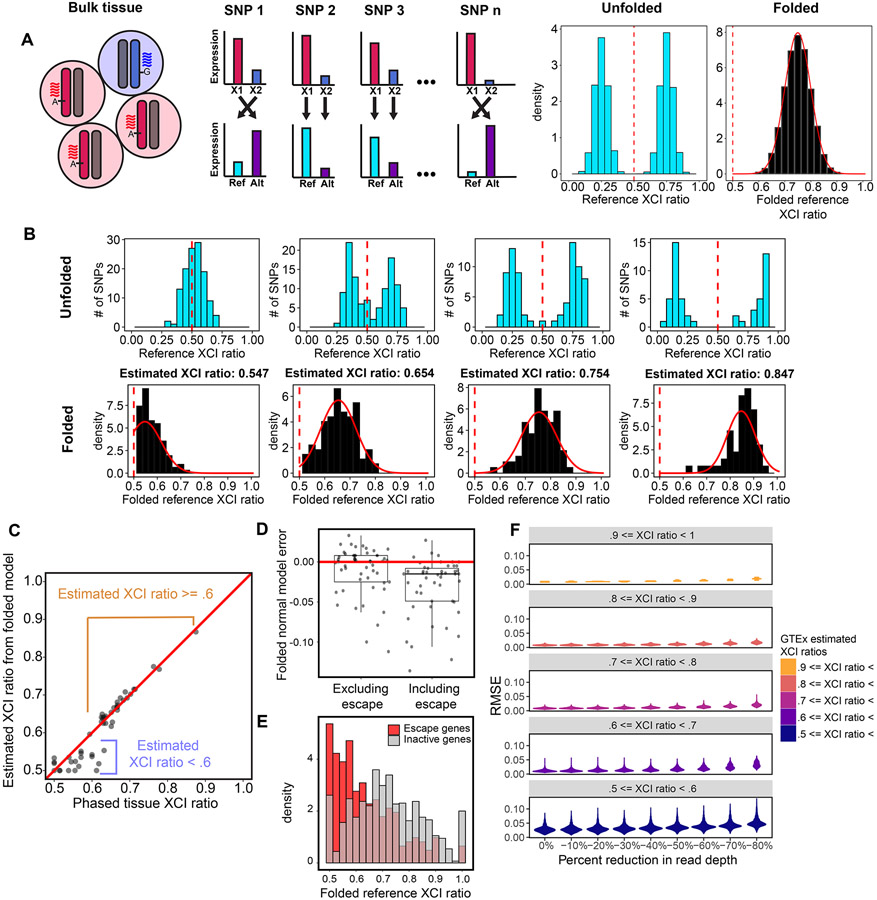
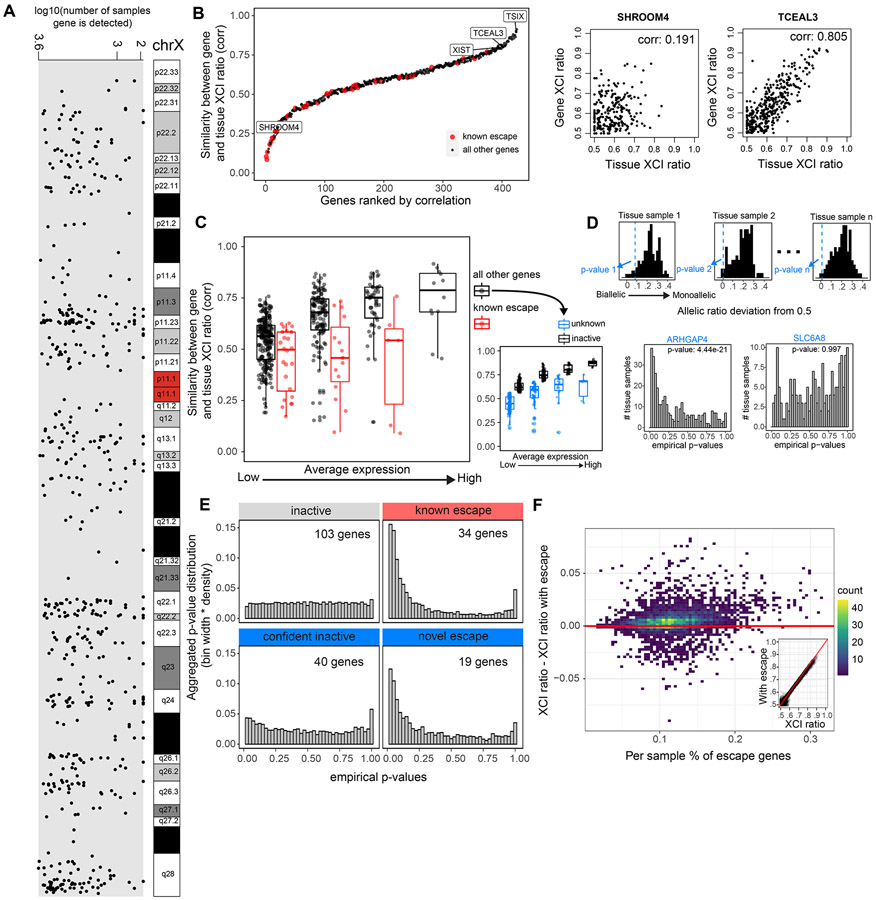
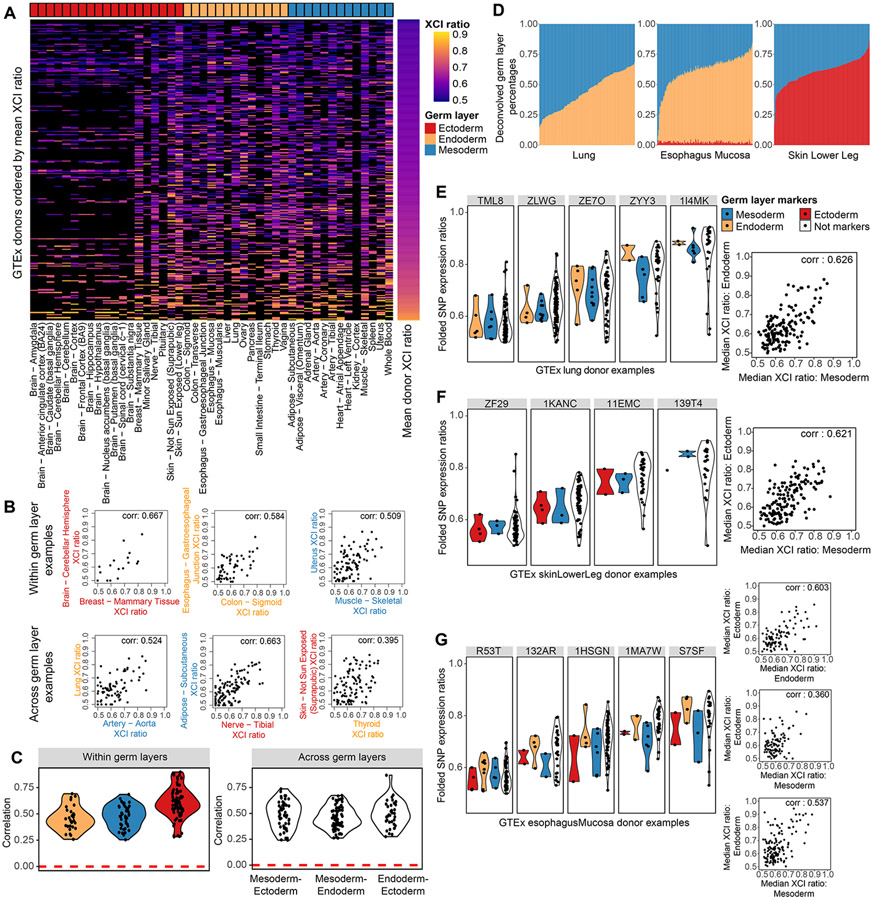
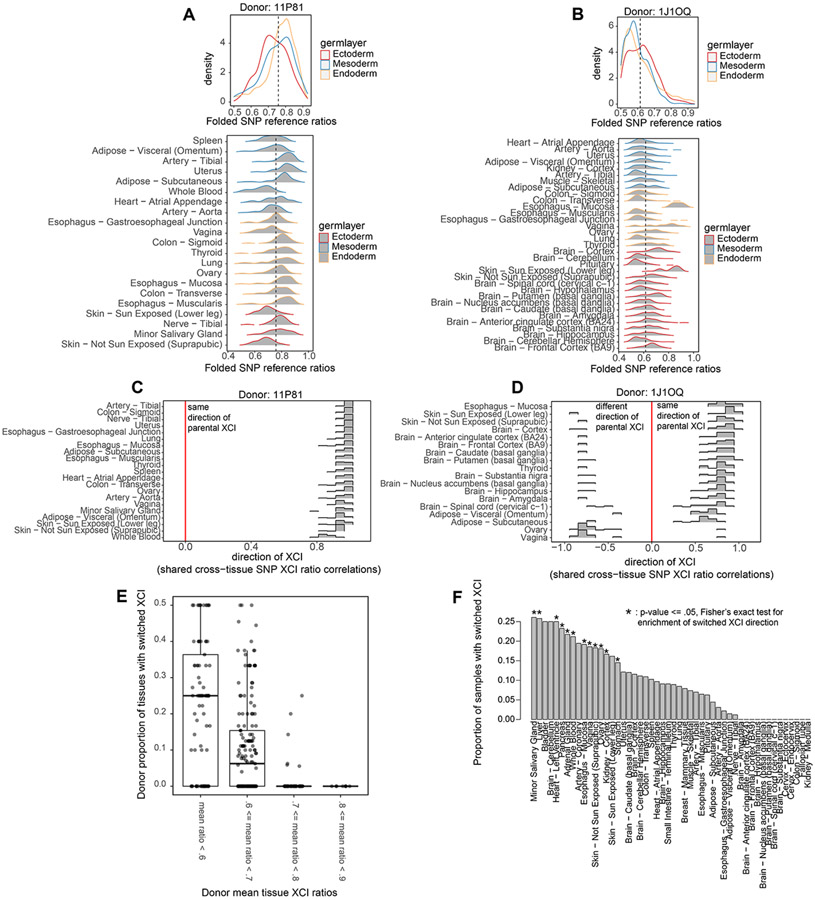
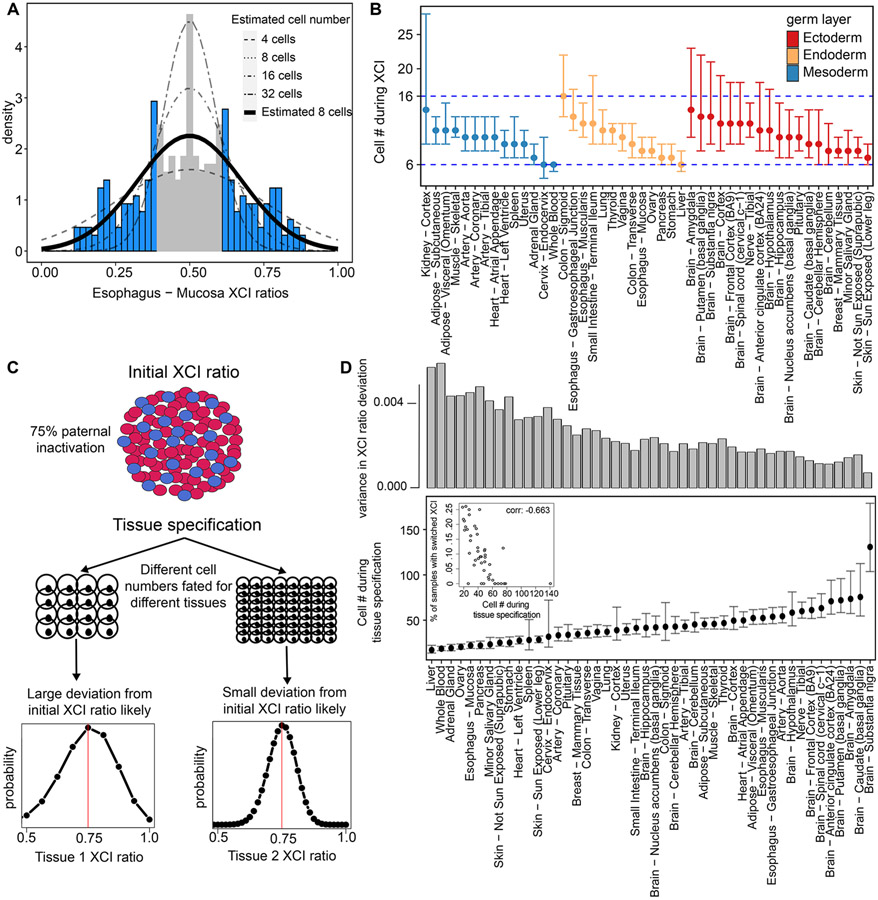
X-chromosome inactivation (XCI) is a random, permanent, and developmentally early epigenetic event that occurs during mammalian embryogenesis. We harness these features to investigate characteristics of early lineage specification events during human development. We initially assess the consistency of X-inactivation and establish a robust set of XCI-escape genes. By analyzing variance in XCI ratios across tissues and individuals, we find that XCI is shared across all tissues, suggesting that XCI is completed in the epiblast (in at least 6-16 cells) prior to specification of the germ layers. Additionally, we exploit tissue-specific variability to characterize the number of cells present during tissue-lineage commitment, ranging from approximately 20 cells in liver and whole blood tissues to 80 cells in brain tissues. By investigating the variability of XCI ratios using adult tissue, we characterize embryonic features of human XCI and lineage specification that are otherwise difficult to ascertain experimentally.

Keywords: X-chromosome inactivation; allele-specific expression; developmental lineage; embryonic stochasticity; escape from XCI; human development.


Conflict of interest statement

Declaration of interests The authors declare no competing interests.

Figures

Figure 1:
Figure 1:. Timing of XCI determines lineage-specific XCI ratio probability
A, Schematic representing completed XCI before germ layer specification. Each germ layer inherits the same randomly determined XCI ratio set prior to germ layer lineage specification. The probability distribution of XCI is determined by the number of cells present during inactivation. B, Schematic representing completed XCI after germ layer specification. The XCI ratio for each germ layer is set independent of one another, together along with variation in cell numbers fated for each germ layer results in variable XCI ratios across the germ layer lineages.
Figure 2:
Figure 2:. The folded-normal model accurately estimates XCI ratios from unphased bulk RNA-sequencing data
A, Schematic demonstrating how allelic expression of heterozygous SNPs reflect the XCI ratio of bulk tissue samples. Aligning expression data to a reference genome scrambles the parental haplotypes. Folding the reference allelic expression ratios captures the magnitude of the tissue XCI ratio. B, Distributions of reference allelic expression ratios for identified heterozygous SNPs across tissue samples exhibiting a range of bulk XCI ratios. Both the unfolded (top row) and folded distributions with the fitted folded normal model (bottom row) are shown. C, For the EN-TEx tissue samples, the phased median gene XCI ratio is plotted against the unphased XCI ratio estimate from the folded normal model. The folded normal model produces near identical XCI ratio estimates for samples with XCI ratios greater than or equal to 0.60. D, Deviation of the folded normal model from the phased median gene XCI ratio when excluding or including known escape genes. E, Aggregated folded reference allelic expression distributions for known escape and inactive genes in EN-TEx tissues with XCI ratios >= 0.70. F, Root mean squared error distributions for GTEx tissue samples binned by their original estimated XCI ratio as read depth per SNP is gradually reduced. See also Figure S1.
Figure 3:
Figure 3:. Genes that escape XCI exhibit balanced biallelic expression across XCI skewed tissues
A, The genomic location and number of GTEx samples each gene is detected for the 542 genes that pass our quality control filters. B, All 542 genes and 45 known escape genes ranked by the Pearson correlation coefficient for each gene’s allelic expression and the XCI ratio of the tissue for samples that detect that gene. C, Distributions of gene-tissue XCI ratio correlations for all 542 genes and 45 escape genes, binned by average expression. The range of average expression is binned into 4 equally spaced bins. We label the top 50% of ‘all other genes’ in each expression bin as ‘inactive genes’ and the bottom 50% as ‘unknown’ genes, as they are potentially a mix of inactive and unannotated escape genes. D, An example for how the empirical p-values are calculated for a given test gene across tissue samples. For a given tissue sample, we calculate each gene’s allelic expression ratio deviation from 0.5, where the black histogram represents the deviations from the inactive genes in the sample and the blue dotted line represents the deviation of the given test gene in the sample, ARHGAP4 in this example. We apply Fisher’s method to aggregate each test gene’s distribution of empirical p-values to calculate a meta-analytic p-value to determine significance (ARHGAP4 meta-analytic p-value: 4.44e−21, SLC6A8 meta analytic p-value: 0.997). E, The aggregated empirical p-value distributions for inactive, known escape, and the unknown genes now classified as confident inactive and novel escape are plotted. The unknown genes are classified as either confident inactive or novel escape by using a significance threshold of meta-analytic p-value < .001. F, The percent of genes previously annotated for escape per sample is plotted against the difference between the sample’s XCI ratio estimates derived when either including or excluding the previously annotated escape genes. The inset plot compares the XCI ratio estimates derived without the known escape genes (x-axis) or including the known escape genes (y-axis). See also Figure S2 and Table S1.
Figure 4:
Figure 4:. XCI ratios are shared across germ layer lineages
A, Heatmap of all estimated XCI ratios for the tissues of each donor, with donors ordered by their mean XCI ratio across tissues and tissues grouped by germ layer lineage. Black indicates no tissue donation for that donor-tissue pair. B, Examples of within and across germ layer lineage comparisons of XCI ratios. Each data point represents the estimated XCI ratios of the two indicated tissues for a single donor. C, All significant (FDR corrected p-value <= 0.5, permutation test n = 10000) Pearson correlation coefficients for within and across germ layer lineage comparisons. D, Stacked bar plots for the germ layer percentage composition for each sample in the Lung, Esophagus Mucosa, and Skin Lower Leg GTEx tissues. The deconvolved cell type percentages and their germ layer annotations are provided in Fig. S2. E-G, the folded allelic expression ratios for germ layer markers and all other genes (Not markers) are plotted for several example donors per tissue, E: Lung, F: Skin Lower Leg, G: Esophagus Mucosa. The adjacent scatter plots compare the median folded allelic expression between germ layer markers for all donors. E: Lung mesodermal and endodermal markers, Pearson correlation of 0.626 (p-value < .001), F: Skin Lower Leg mesodermal and ectodermal markers, Pearson correlation of 0.621 (p-value < .001), G: Esophagus Mucosa endodermal and ectodermal markers, Pearson correlation 0.603 (p-value < .001), mesodermal and ectodermal markers, Pearson correlation 0.360, (p-value < .001), mesodermal and endodermal markers Pearson correlation 0.537 (p-value < .001). See also Figure S3-4 and Table S2.
Figure 5:
Figure 5:. Individual tissue lineages exhibit increased variance in XCI ratios
A, Folded allele-specific expression distributions for individual tissues from the 11P81 donor with the aggregated germ layer distributions in the top panel. B, Folded allele-specific expression distributions for individual tissues from the 1J1OQ donor with the aggregated germ layer distributions in the top panel. C, Pearson correlation distributions calculated from all pairwise comparisons of shared heterozygous SNPs between two tissues for all of donor 11P81 ‘s tissues. Positive correlations indicate the same parental direction of XCI, negative correlations indicate opposite parental directions of XCI. D, Similar to C, displaying results for donor 1J1OQ’s tissues. E, Box plots of the per donor proportion of tissues that switched parental XCI directions with donors binned by their mean XCI ratio across tissues. F, Bar plot indicating the proportion of donors where the specified tissue switched directions compared to other tissues. Asterisks indicate significance from Fisher’s Exact test (FDR corrected p-value <= .05), identifying tissues enriched for switching XCI directions.
Figure 6:
Figure 6:. XCI and tissue lineage specification can be timed to a pool of cells by exploiting observed variability
A, Example tissue demonstrating the model for estimating cell numbers at the time of XCI using the population-level variance in XCI ratios. We fit normal distributions, as a continuous approximation of the underlying binomial distribution of XCI ratios, to the tails of tissue-specific XCI ratio distributions (shaded in blue), which accounts for the uncertain 0.40-0.60 unfolded XCI ratio estimates (shaded in grey). B, The resulting estimated cell numbers present during XCI derived from the XCI ratio variance of all tissues with at least 10 donors. Error bars are 95% confidence intervals and tissues are grouped by germ layer lineage. C, Schematic for our model of tissue lineage specification and the implications for tissue-specific XCI ratios. The XCI ratio of a tissue is dependent on the prior XCI ratio of the embryo and the number of cells selected for that tissue lineage. These two features define the binomial distribution for that tissue’s XCI ratio. D, Estimated number of cells selected for individual tissue lineage specification of 46 different tissues. Error bars represent 95% confidence intervals. The top bar graph plots the variance in the distribution of tissue XCI ratio deviation from the average XCI ratio of each donor for that tissue. The inset plot compares the estimated number of cells present at the time of tissue specification to the proportion of that tissue’s samples that switched parental XCI directions, Pearson correlation −0.663 (p-value < .001).

Similar articles

Cited by

References

    1. Amos-Landgraf JM, Cottle A, Plenge RM, Friez M, Schwartz CE, Longshore J, Willard HF, 2006. X Chromosome–Inactivation Patterns of 1,005 Phenotypically Unaffected Females. Am J Hum Genet 79, 493–499. - PMC - PubMed
    1. Balaton BP, Fornes O, Wasserman WW, Brown CJ, 2021. Cross-species examination of X-chromosome inactivation highlights domains of escape from silencing. Epigenetics Chromatin 14, 12. 10.1186/s13072-021-00386-8 - DOI - PMC - PubMed
    1. Berletch JB, Ma W, Yang F, Shendure J, Noble WS, Disteche CM, Deng X, 2015. Escape from X Inactivation Varies in Mouse Tissues. PLoS Genet 11, e1005079. 10.1371/journal.pgen.1005079 - DOI - PMC - PubMed
    1. Bittel DC, Theodoro MF, Kibiryeva N, Fischer W, Talebizadeh Z, Butler MG, 2008. Comparison of X-chromosome inactivation patterns in multiple tissues from human females. J Med Genet 45, 309–313. 10.1136/jmg.2007.055244 - DOI - PMC - PubMed
    1. Boudewijns M, van Dongen JJM, Langerak AW, 2007. The Human Androgen Receptor X-Chromosome Inactivation Assay for Clonality Diagnostics of Natural Killer Cell Proliferations. J Mol Diagn 9, 337–344. 10.2353/jmoldx.2007.060155 - DOI - PMC - PubMed

Publication types

LinkOut - more resources