. 2022 Aug 18;82(16):2982-2999.e14.
doi: 10.1016/j.molcel.2022.06.036. Epub 2022 Jul 31.

Systematic exploration of dynamic splicing networks reveals conserved multistage regulators of neurogenesis

Affiliations

Systematic exploration of dynamic splicing networks reveals conserved multistage regulators of neurogenesis

Hong Han et al. Mol Cell. .

Abstract

Alternative splicing (AS) is a critical regulatory layer; yet, factors controlling functionally coordinated splicing programs during developmental transitions are poorly understood. Here, we employ a screening strategy to identify factors controlling dynamic splicing events important for mammalian neurogenesis. Among previously unknown regulators, Rbm38 acts widely to negatively control neural AS, in part through interactions mediated by the established repressor of splicing, Ptbp1. Puf60, a ubiquitous factor, is surprisingly found to promote neural splicing patterns. This activity requires a conserved, neural-differential exon that remodels Puf60 co-factor interactions. Ablation of this exon rewires distinct AS networks in embryonic stem cells and at different stages of mouse neurogenesis. Single-cell transcriptome analyses further reveal distinct roles for Rbm38 and Puf60 isoforms in establishing neuronal identity. Our results describe important roles for previously unknown regulators of neurogenesis and establish how an alternative exon in a widely expressed splicing factor orchestrates temporal control over cell differentiation.

Keywords: RNA-binding proteins; alternative splicing; gene regulation; high-throughput screening; neurogenesis; single-cell profiling.


Conflict of interest statement

Declaration of interests B.J.B. and A.-C.G. are members of the Molecular Cell advisory board. The remaining authors declare no competing interests.

Figures
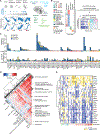
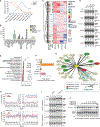
Figure 1.
Figure 1.. Neu-SPAR-seq screen
(A) Neu-SPAR-seq analyzed alternative splicing (AS) events include those with distinct patterns of inclusion level change during glutamatergic neuronal differentiation (upper left), indicated by temporal clusters C1–C8 (lower left). Black lines, median relative inclusion levels (scaled 0–1 for each event); dark and light blue shading, 25th–75th and 5th–95th percentiles, respectively, of relative inclusion levels across the neural differentiation time course; vertical dashed lines, differentiation day (DIV) 0 and DIV7 time points. Analyzed events selected based on regional specificity across different adult brain regions (right). (B) Neu-SPAR-seq screen overview: 108 transcript regions, encompassing 170 splicing and 108 expression events, were simultaneously profiled. Event types and their regulatory characteristics are indicated. PNS, peripheral nervous system; OPC, oligodendrocyte progenitor cell; AS, alternative splicing; GE, gene expression; Diff.cluster, dynamic neural differentiation clusters from (A). (C) Numbers of Neu-SPAR-seq screen knockdowns with a significant impact on splicing levels (measured using strictly standardized mean difference: |SSMD| > 3; top) and GE levels: (|log2FC| > log2(1.5) and FDR < 0.01; bottom) (see also Table S1 and STAR Methods). Event characteristics are indicated as in (B). Annotated and de-novo-detected alternative exons profiled are denoted by ‘‘E’’ and ‘‘e,’’ respectively, and numbered 5ʹ to 3ʹ within the amplicon. (D) Pairwise correlation heatmap of splicing changes detected in Neu-SPAR-seq screen, integrating additional data from Han et al. (2017). Significant screen hits, and selected significant terms from GO, CORUM, REACTOME, KEGG, TRANSFAC, and Human Protein Atlas annotations from representative sub-clusters of correlated AS changes, are indicated (see also Figure S1E, Table S2, and STAR Methods). (E) Heatmap showing unsupervised clustering of Neu-SPAR-seq detected AS changes as a consequence of knockdown of selected positive and negative regulators of neurogenesis-associated splicing. Event types as in (B).
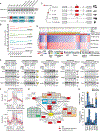
Figure 2.
Figure 2.. Rbm38 represses neural alternative splicing networks
(A) mRNA expression profiles of Rbm38, Ptbp1, and Srrm4 during glutamatergic neuronal differentiation, as measured using corrected (for mappability). Reads per kilobase and million mapped reads (cRPKM). RNA-seq data from Hubbard et al. (2013). (B) Rbm38 expression levels across adult tissues measured using RNA-seq data as in (A). (C) RNA-seq profiled PSI changes (dPSI) upon siRNA knockdown of Rbm38 in N2A, in comparison with changes following depletion of other neural regulators. Cassette exons (CEs) and microexons (MICs) are shown. Dynamic neural differentiation clusters (Diff.cluster) as well as neural- and ESC-differential AS events are indicated. (D) Representative RT-PCR validations of AS changes detected by SPAR-seq and/or RNA-seq upon siRbm38 knockdown with and without Dox-inducible ectopic expression of siRNA-resistant Rbm38 cDNA. Treatment with non-targeting control siRNA (siNTC) is shown as a control. Mean percent spliced in (PSI) changes and standard deviations (SDs) from three biological replicate experiments are shown. (E) GO enrichment analysis of genes with CE and MIC events that show increased AS levels following Rbm38 knockdown in N2A cells. Circle size, numbers of genes with changing AS associated with a GO term; circle color, adjusted p value of the enriched GO term. (F) Distribution of Rbm38 iCLIP-binding peaks, represented as their relative density (i.e., percent coverage) within the different gene regions indicated. (G) Rbm38 protein-protein interaction network detected by AP-MS in N2A cells. Interactors with average spectral counts >15 and Bayesian false discovery rate (BFDR) < 0.01 are depicted. Interactions based on evidence from the STRING database are indicated by blue edges. (H) Distributions of binding motifs for Ptbp1 and Srrm4 (STAR Methods) surrounding exons that are suppressed, enhanced, or unaffected by siRbm38, as analyzed by RNA-seq. (I) RT-PCR assays monitoring AS in N2A cells after ectopic expression of Rbm38 and/or double depletion of endogenous Ptbp1 and Ptbp2. (J) In vitro splicing assays monitoring effects on splicing of a Daam1 microexon minigene (Raj et al., 2014) transcripts upon addition of purified recombinant Rbm38, Ptbp1, and/or Srrm4 proteins, as indicated.
Figure 3.
Figure 3.. Puf60 isoforms regulate neural-differential alternative splicing
(A) RT-PCR assays monitoring Puf60 exon 5 splicing during neural differentiation of mouse ESCs (top). Schematics of Puf60 protein domain organization (bottom). Ex5, Exon 5; RRM, RNA recognition motif; UHM, U2AF homology motif. (B) Puf60 exon 5 PSI levels across mouse embryonic brain development, measured using RNA-seq data. Linear regression fit of data points and corresponding R2 values are shown. (C) Evolutionary conservation of Puf60 exon 5 and its neighboring introns (see also Figure S3B and STAR Methods). 0, paralogous intronic sequence. (D) RNA-seq profiled PSI changes (dPSI) upon siRNA knockdown of Puf60 in N2A cell lines expressing Puf60 with and without exon 5 under dox-inducible control. Measurements show knockdown of Puf60 relative to non-targeting siRNA treatment without induction of isoform cDNAs (siPuf60 [+Ex5] and siPuf60 [−Ex5]), and following induction of Puf60 + Ex5 (+Ex5 rescue) or Puf60 − Ex5 (−Ex5 rescue) isoforms. (E) RT-PCR validations of Puf60 ± Ex5-dependent and -independent differential AS regulation detected by RNA-seq profiling in (D). (F) Average iCLIP signal of Puf60 + Ex5 and Puf60 − Ex5 isoforms in N2A cells surrounding exons that are activated or repressed by Puf60, as analyzed by RNA-seq data in (D). Shaded area, SEM. (G) Puf60 + Ex5 and Puf60 − Ex5 protein-protein interaction networks detected by AP-MS in N2A cells. Puf60 − Ex5 specific interactors are highlighted in red. Interactors with Bayesian false discovery rate (BFDR) < 0.01 are depicted. (H) Overlap of 248 and 27 events selectively rescued by Puf60 − Ex5 (top) or Puf60 + Ex5 (bottom), respectively, with other factors. Direction of PSI change upon Puf60 knockdown is indicated. Only events changing in the same direction (more or less inclusion) upon depletion of other factors are indicated, except for Ptbp1, where change in the opposite direction was scored as overlap. Empirical p values are based on observed over expected overlap—as measured from 10,000 random label permutations (STAR Methods).
Figure 4.
Figure 4.. Puf60 isoforms and Rbm38 control cell fate
(A) Genotype characterization of CRISPR-edited CGR8 mouse ESC lines. Selective expression of Puf60 isoforms was confirmed by RT-PCR assays (left) and Rbm38 knockout was confirmed by PCR (genomic DNA) and western blot (right). (B) RNA-seq profiled PSI changes (dPSI) in CRISPR-edited cell lines at ESC, EB8, and DIV7 stages of neural differentiation relative to WT parental line. Homozygous and heterozygous cell lines with selective expression of Puf60 isoforms are indicated as −Ex5 (HOM), +Ex5 (HOM), and +Ex5 (HET), respectively. Homozygous knockout of Rbm38 is indicated as Rbm38 KO. Cassette exons (CEs) and microexons (MICs) are shown. Dynamic neuronal differentiation clusters (Diff.clusters) as well as neural- and ESC-differential regulations are also indicated. (C) Representative RT-PCR validations of differential AS regulation identified by RNA-seq at ESC, EB8, and DIV7 stages of differentiation. (D) GO enrichment analysis of genes with CE and MIC that show differential regulation by Puf60 ± Ex5 isoforms at ESC, EB8, and DIV7 stages of differentiation.
Figure 5.
Figure 5.. Single-cell maps reveal cell fate control by Rbm38 and Puf60 isoforms
(A and B) Uniform manifold approximation and projection (UMAP) visualization of sci-RNA-seq3 GE profiles integrated from data of all analyzed CGR8 mESC genotypes and two biological replicates (CGR8 parental WT, Rbm38 KO, or Puf60 − Ex5 [Hom], Puf60 + Ex5 [Hom] and Puf60 + Ex5 [Het]) at the ESC and DIV7 stages of neural differentiation, respectively. Main classes of cell types and corresponding clusters were colored and annotated based on variably expressed genes and specific markers. Black curves represent differentiation trajectories as determined by pseudotime inference. PSCs, pluripotent stem cells; OPC, oligodendrocyte progenitor cell. (C) ESC pluripotency gene module (top) and corresponding cell activity overlaid on ESC UMAP (bottom). (D) Pathway enrichment of genes that exhibit Puf60 exon 5 dose-dependent increases (red, Puf60 − Ex5 [Hom] < Puf60 + Ex5 [Het] < Puf60 + Ex5 [Hom]) or decreases (blue, Puf60 − Ex5 [Hom] > Puf60 + Ex5 [Het] > Puf60 + Ex5 [Hom]) in expression in ESCs (hypergeometric test, FDR < 0.05). (E) DIV7 EMT-related (top left) and ECM-related (top-right) gene modules and corresponding cell activities overlaid on DIV7 UMAPs (bottom). ECM, extracellular matrix; EMT, epithelial-to-mesenchymal transition. (F) Pathway enrichment of genes that exhibit Puf60 exon 5 dose-dependent increases (red) or decreases (blue) in expression in DIV7 (hypergeometric test, FDR < 0.05). (G) Differential abundance analysis of cell composition across genotypes at ESC (left) and DIV7 (right) stages using a modified version of the Milo method (Dann et al., 2022; see STAR Methods). Nodes represent cellular neighborhoods and size represents the number of cells in the neighborhood. Colors indicate differential abundance (red, over-represented; blue, under-represented populations in CRISPR-edited clones shown). Dashed oval, main PSC subpopulations; dashed triangle, vascular- and fibroblast-like populations.
Figure 6.
Figure 6.. Identification of tissue-dependent exons in general splicing factors and model for cell fate control by Rbm38 and Puf60 isoforms
(A) Widely expressed splicing factors with detected cell and tissue-type-dependent regulated exons (see STAR Methods). Color scale indicates PSI difference versus mean PSI across the indicated tissue groups. (B) Model for roles of Rbm38 and Puf60 isoforms in controlling protein interaction, splicing, and expression networks, and ultimately cell fate specification during neural differentiation. For Puf60, inclusion of exon 5 reduces interactions with both positive (yellow oval)- and negative-acting (green oval) factors to differentially regulate programs of alternative splicing associated with cell fate control.

References

    1. Baralle FE, and Giudice J (2017). Alternative splicing as a regulator of development and tissue identity. Nat. Rev. Mol. Cell Biol 18, 437–451. - PMC - PubMed
    1. Berriz GF, Beaver JE, Cenik C, Tasan M, and Roth FP (2009). Next generation software for functional trend analysis. Bioinformatics 25, 3043–3044. - PMC - PubMed
    1. Boutz PL, Stoilov P, Li Q, Lin CH, Chawla G, Ostrow K, Shiue L, Ares M Jr., and Black DL (2007). A post-transcriptional regulatory switch in polypyrimidine tract-binding proteins reprograms alternative splicing in developing neurons. Genes Dev 21, 1636–1652. - PMC - PubMed
    1. Braunschweig U, Barbosa-Morais NL, Pan Q, Nachman EN, Alipanahi B, Gonatopoulos-Pournatzis T, Frey B, Irimia M, and Blencowe BJ (2014). Widespread intron retention in mammals functionally tunes transcriptomes. Genome Res 24, 1774–1786. - PMC - PubMed
    1. Buljan M, Chalancon G, Eustermann S, Wagner GP, Fuxreiter M, Bateman A, and Babu MM (2012). Tissue-specific splicing of disordered segments that embed binding motifs rewires protein interaction networks. Mol. Cell 46, 871–883. - PMC - PubMed

Publication types