. 2022 Sep 12;32(17):3731-3744.e4.
doi: 10.1016/j.cub.2022.07.021. Epub 2022 Jul 31.

Mosquito cryptochromes expressed in Drosophila confer species-specific behavioral light responses

Affiliations

Mosquito cryptochromes expressed in Drosophila confer species-specific behavioral light responses

David D Au et al. Curr Biol. .

Abstract

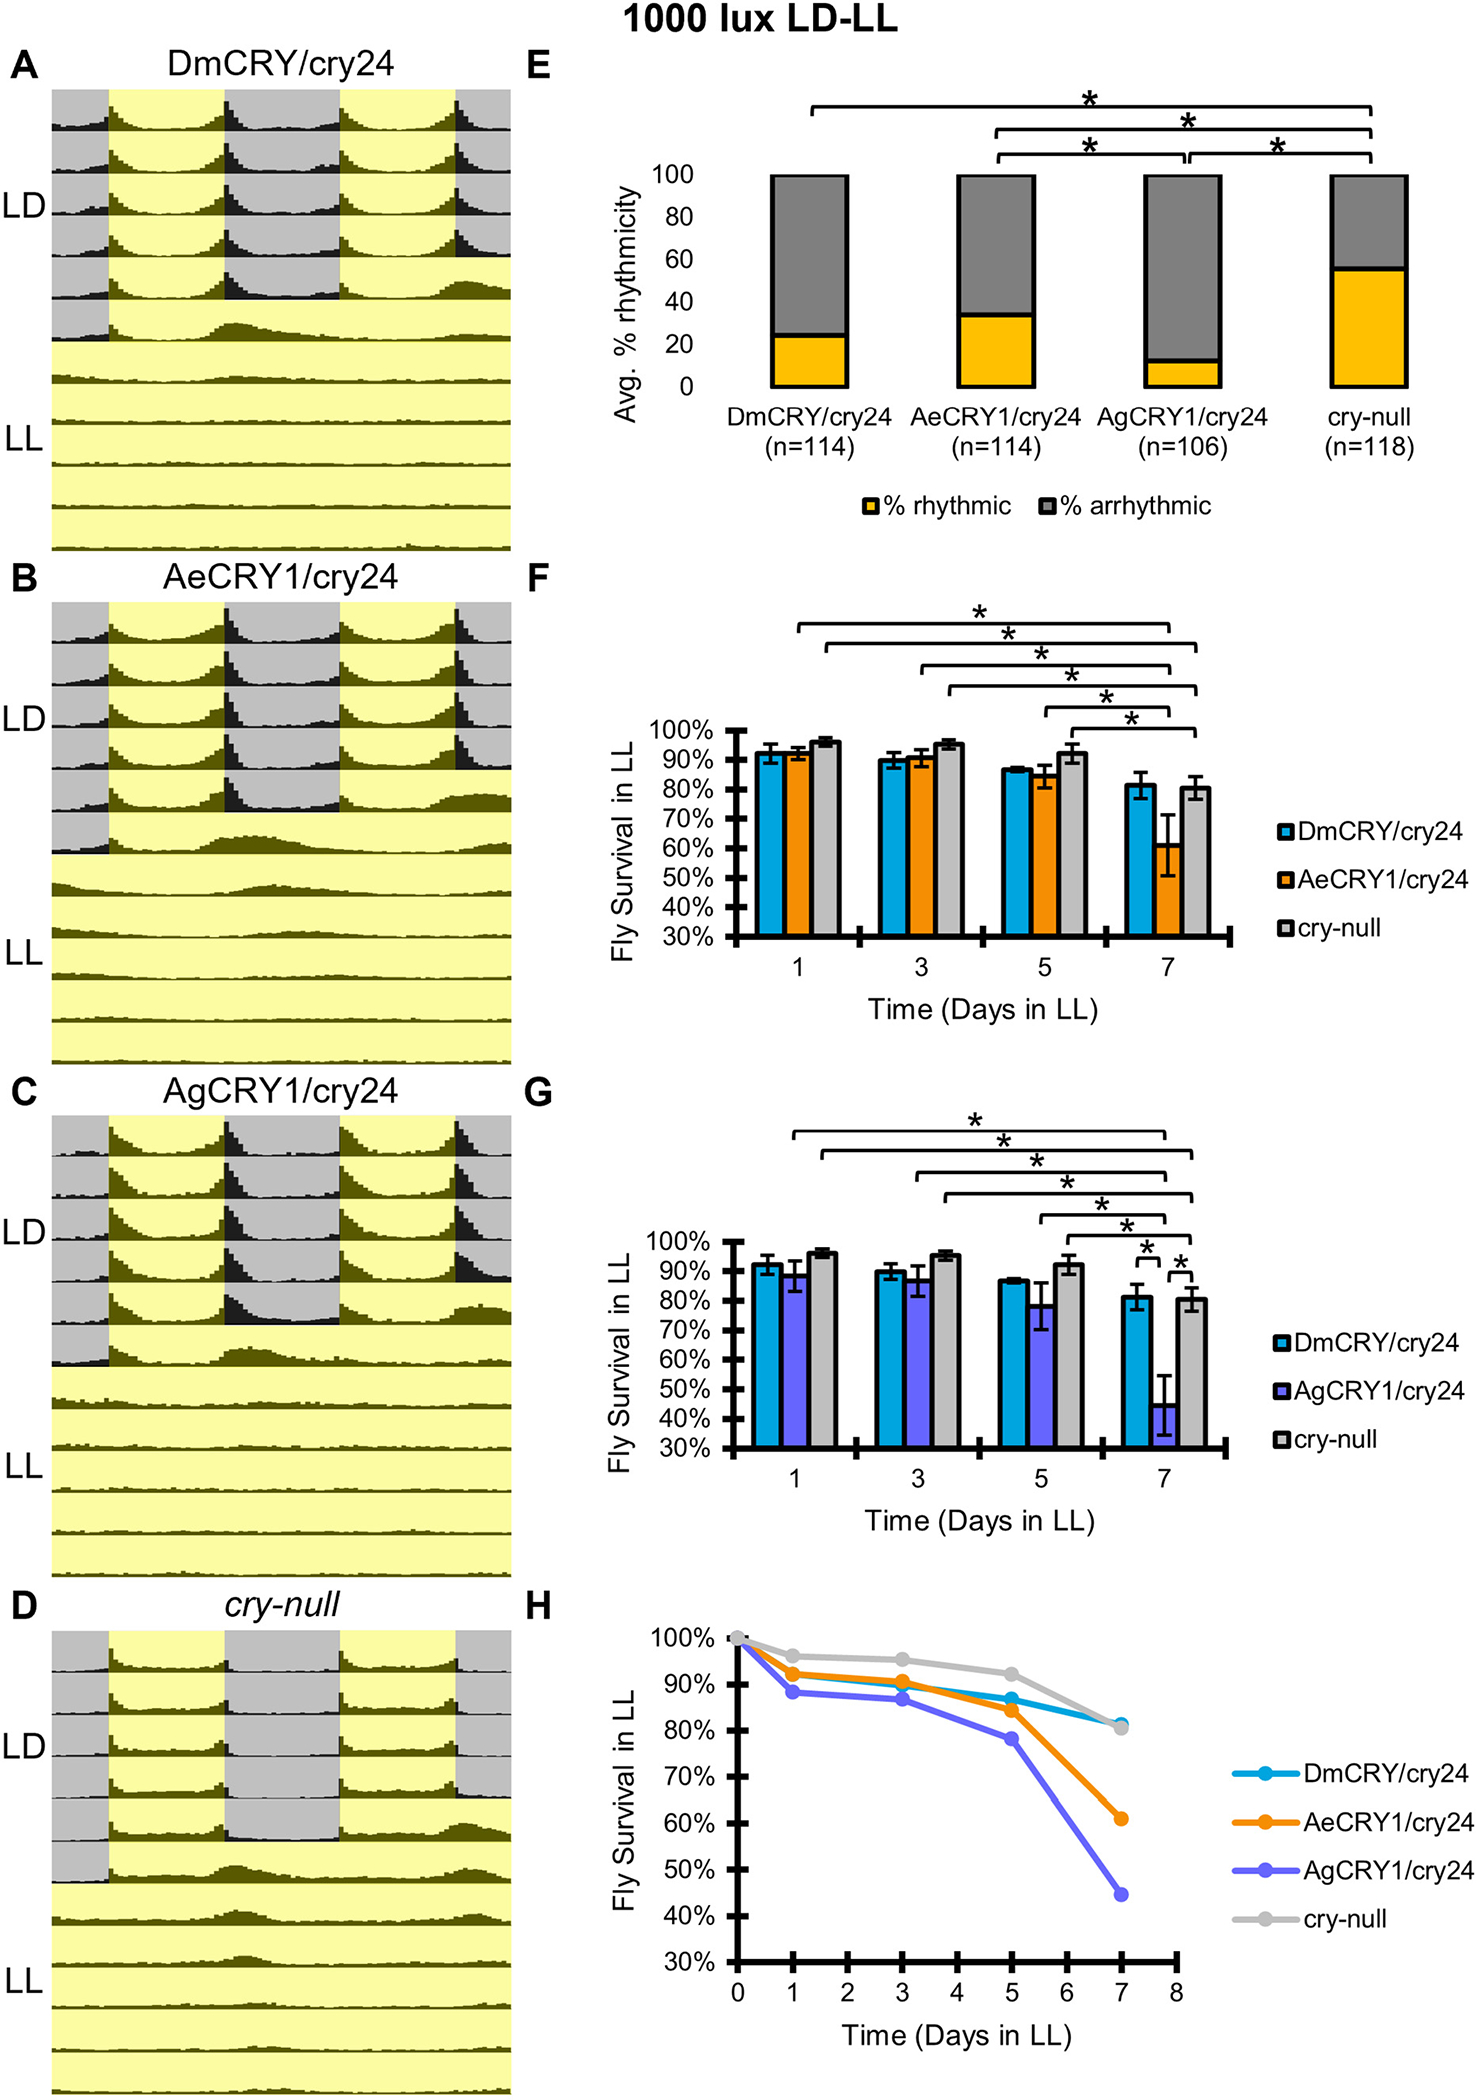
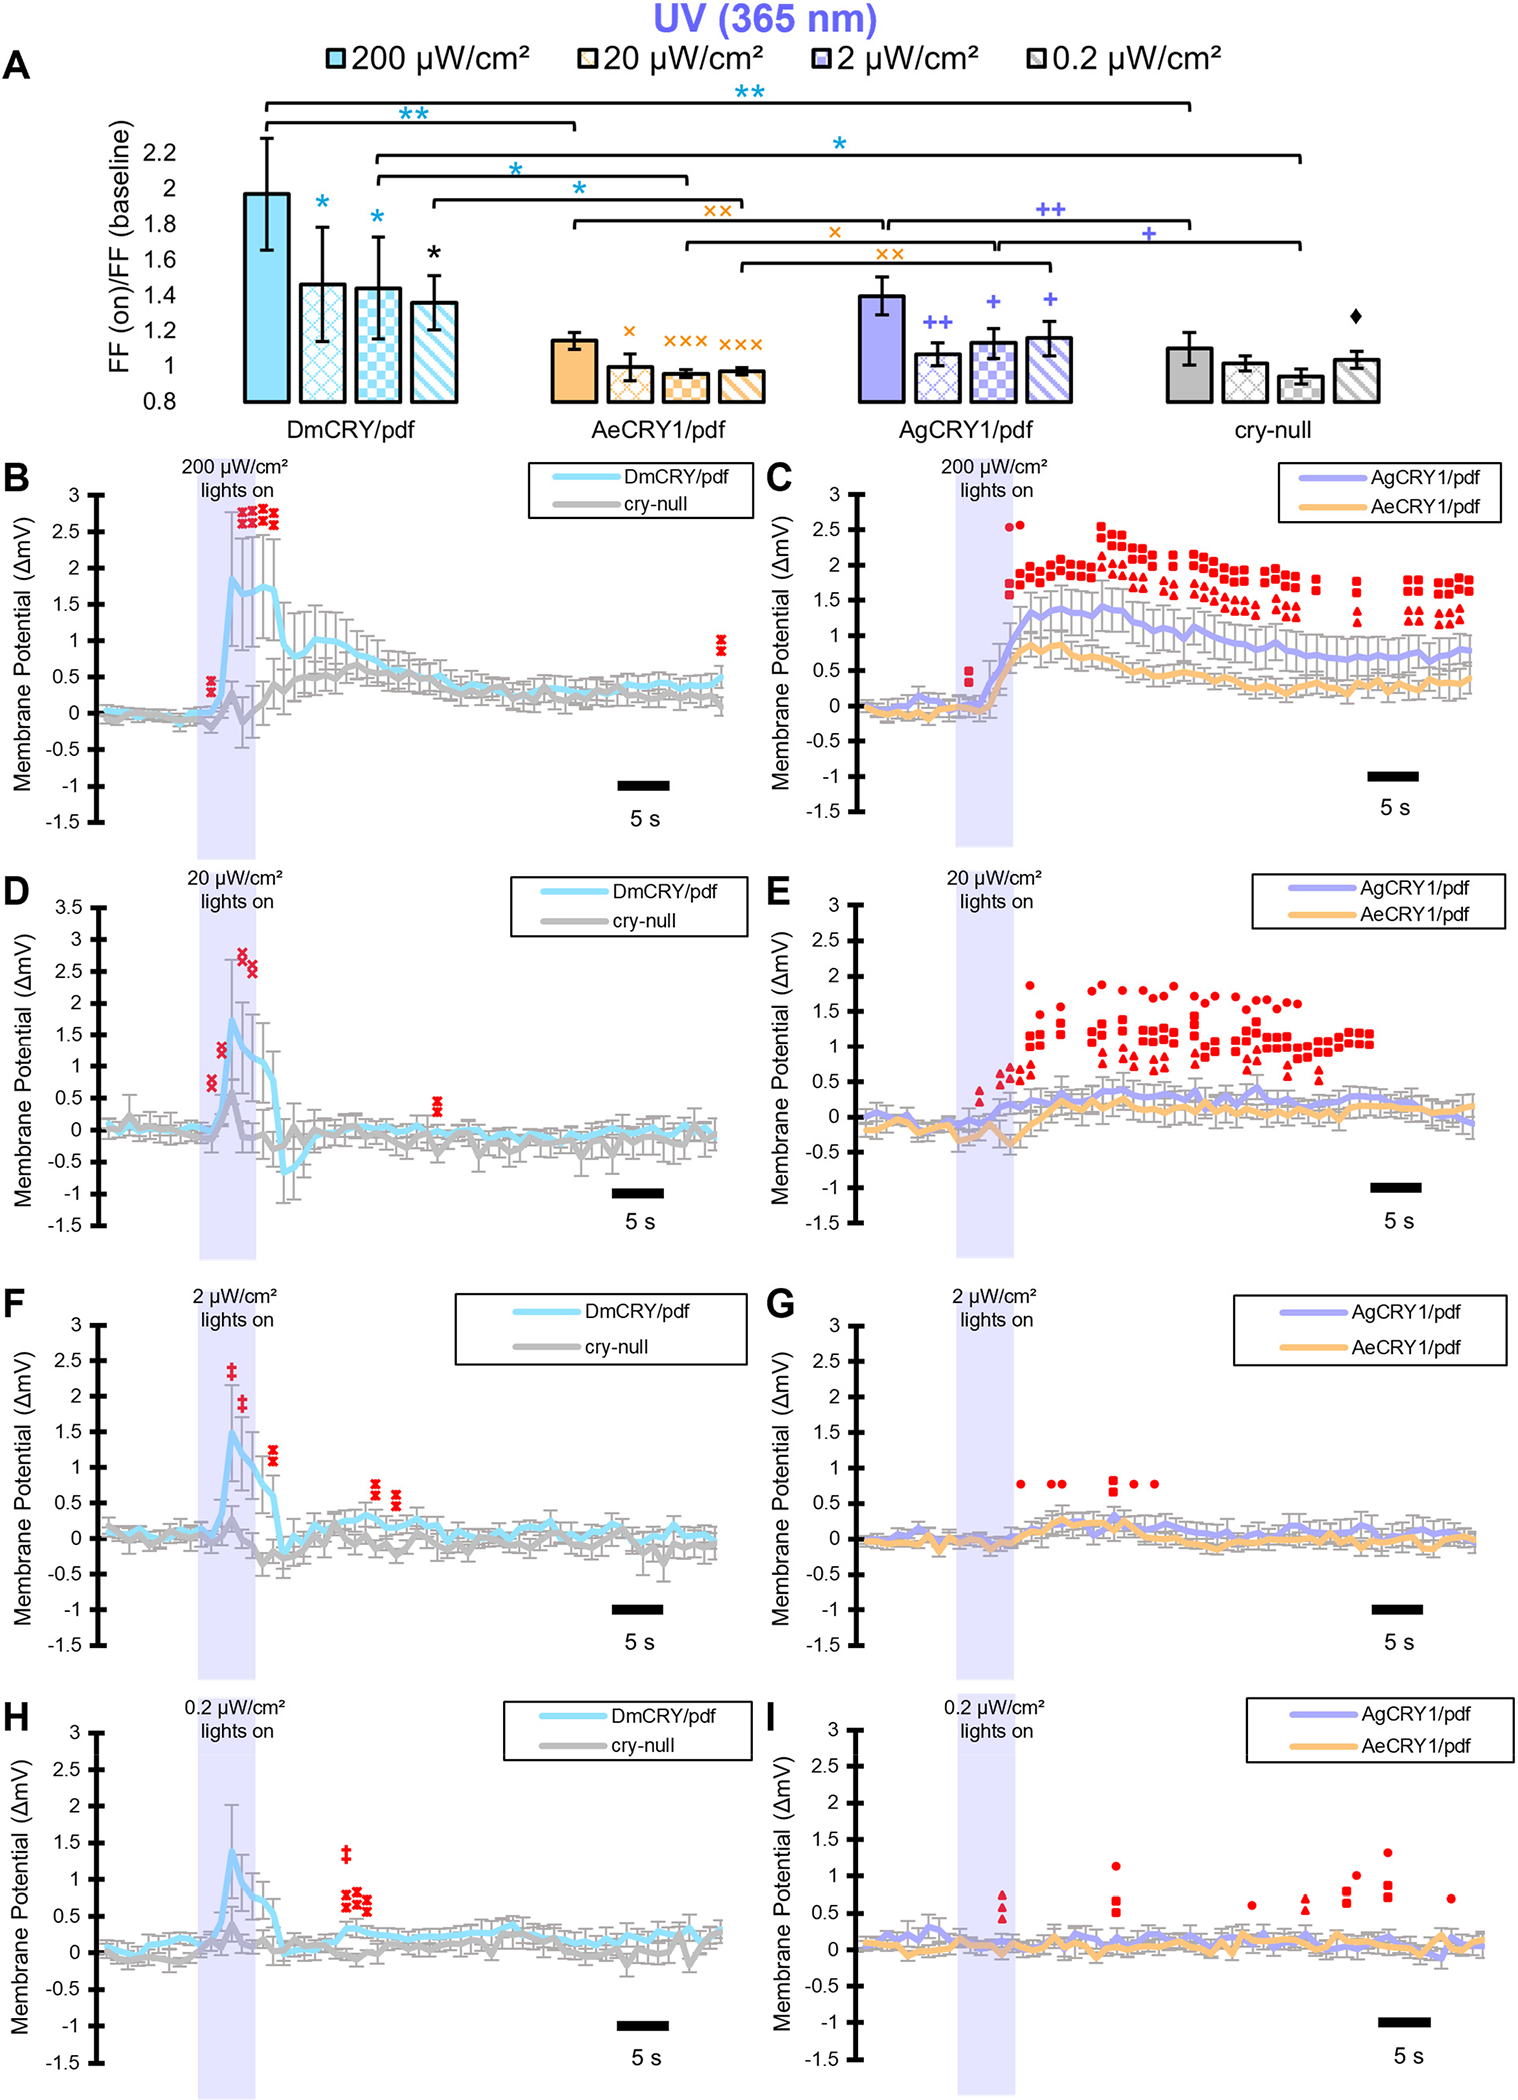
Cryptochrome (CRY) is a short-wavelength light-sensitive photoreceptor expressed in a subset of circadian neurons and eyes in Drosophila that regulates light-evoked circadian clock resetting. Acutely, light evokes rapid electrical excitation of the ventral lateral subset of circadian neurons and confers circadian-modulated avoidance behavioral responses to short-wavelength light. Recent work shows dramatically different avoidance versus attraction behavioral responses to short-wavelength light in day-active versus night-active mosquitoes and that these behavioral responses are attenuated by CRY protein degradation by constant light exposure in mosquitoes. To determine whether CRY1s mediate species-specific coding for behavioral and electrophysiological light responses, we used an "empty neuron" approach and transgenically expressed diurnal Aedes aegypti (AeCRY1) versus nocturnal Anopheles gambiae (AgCRY1) in a cry-null Drosophila background. AeCRY1 is much less light sensitive than either AgCRY1 or DmCRY as shown by partial behavioral rhythmicity following constant light exposure. Remarkably, expression of nocturnal AgCRY1 confers low survival to constant white light as does expression of AeCRY1 to a lesser extent. AgCRY1 mediates significantly stronger electrophysiological cell-autonomous responses to 365 nm ultraviolet (UV) light relative to AeCRY1. AgCRY1 expression mediates electrophysiological sensitivity to 635 nm red light, whereas AeCRY1 does not, consistent with species-specific mosquito red light responses. AgCRY1 and DmCRY mediate intensity-dependent avoidance behavior to UV light at different light intensity thresholds, whereas AeCRY1 does not, thus mimicking mosquito and fly behaviors. These findings highlight CRY as a key non-image-forming visual photoreceptor that mediates physiological and behavioral light responses in a species-specific fashion.

Keywords: Aedes aegypti; Anopheles gambiae; Cryptochrome; Drosophila melanogaster; circadian neurons; electrophysiology; light-evoked behavior; mosquito sensory biology; non-image forming vision; phototransduction.


Conflict of interest statement

Declaration of interests The authors declare no competing interests.

Figures

Figure 1.
Figure 1.. AeCRY1 and AgCRY1 expression does not disrupt the peak time of the circadian clock in transgenic flies
Immunocytochemistry average fluorescent value of TIM expression over 12:12 hr LD at ZT 5, 11, 17, and 23 timepoints in LNvs expressing (A, B) DmCRY with representative image, (C, D) AeCRY1 with representative image, (E, F) AgCRY1 with representative image over cry-null background, and (G, H) negative control cry-null. All representative images are at ZT 23, have a 100-micron scale bar for reference, and have been modified for clarity with 40% brightness and −20% contrast. Data are represented as mean ± SEM. * p ≤ 0.05, ** p ≤ 0.005, ***p ≤ 0.001. See also Figures S2 and S3.
Figure 2.
Figure 2.. AgCRY1 and control DmCRY expressing flies are arrhythmic in high intensity constant light (1000 lux LL), AeCRY1 expressing flies are partial arrhythmic and cry-null flies remain rhythmic in LL
(A-D) Actograms plots containing 5 days of 12:12 hr LD entrainment followed by 5 days of high intensity constant light (1000 lux LL) conditions for flies expressing: (A) DmCRY (n=114; τavg≈25.2, poweravg≈51.0, widthavg≈3.4), (B) AeCRY1 (n=114; τavg≈25.4, poweravg≈47.6, widthavg≈4.2), (C) AgCRY1 (n=106; τavg≈25.1, poweravg≈34.4, widthavg≈2.4), (D) cry-null (n=118; τavg≈25.1, poweravg≈67.4, widthavg≈3.6). (E) Quantification of fly rhythmicity (orange) to arrhythmicity (grey) in LL. (F-H) Fly survival plots over an extended 7-day period of high intensity LL exposure: (F) Bar charts of the average survival percentage at days 1, 3, 5, and 7 in LL of DmCRY (blue) vs AeCRY1 (orange) vs cry-null (grey) groups. (G) Bar charts of the average survival percentage at days 1, 3, 5, and 7 in LL of DmCRY vs AgCRY1 (purple) vs cry-null groups. (H) Line plot summary of LL survivability for both AeCRY1 and AgCRY1 groups compared with DmCRY and cry-null. Data are represented as mean ± SEM. *p ≤ 0.05, **p ≤ 0.005, ***p ≤ 0.001.
Figure 3.
Figure 3.. AeCRY1 and control DmCRY expressing flies are partial arrhythmic in low intensity constant light (1 lux LL), AgCRY1 and cry-null flies remain highly rhythmic in LL
(A-D) Actograms plots containing 5 days of 12:12 hr LD entrainment followed by 5 days of low intensity constant light (1 lux LL) conditions for flies expressing: (A) DmCRY (n=118; τavg≈24.9, poweravg≈62.5, widthavg≈3.2), (B) AeCRY1 (n=119; τavg≈26.0, poweravg≈118.0, widthavg≈5.6), (C) AgCRY1 (n=109; τavg≈26.0, poweravg≈68.0, widthavg≈4.3), (D) cry-null (n=122; τavg≈25.2, poweravg≈109.8, widthavg≈5.2). (E) Quantification of fly rhythmicity (orange) to arrhythmicity (grey) in LL. (F-H) Fly survival plots over an extended 7-day period of low intensity LL exposure: (F) Bar charts of the average survival percentage at days 1, 3, 5, and 7 in LL of DmCRY (blue) vs AeCRY1 (orange) vs cry-null (grey) groups. (G) Bar charts of the average survival percentage at days 1, 3, 5, and 7 in LL of DmCRY vs AgCRY1 (purple) vs cry-null groups. (H) Line plot summary of LL survivability of both AeCRY1 and AgCRY1 groups compared with DmCRY and cry-null. Data are represented as mean ± SEM. *p ≤ 0.05, **p ≤ 0.005, ***p ≤ 0.001.
Figure 4.
Figure 4.. Transgenic PDF+ Drosophila Neurons Expressing either AeCRY1 or AgCRY1 Show Intensity-Dependent Light-Evoked Excitation to UV Light
(A) pdfGAL4 driven DmCRY (light blue) and cry-null (grey) comparison of AeCRY1 (light orange) and AgCRY1 (light purple) expressing l-LNvs FF upon five seconds of UV (365 nm) light exposure over 50 seconds of baseline FF at varying intensities light intensities of 200 (solid color), 20 (crisscrossed pattern), 2 (checkered pattern), and 0.2 (diagonally striped pattern) μW/cm2. Black * indicates p ≤ 0.05 for comparisons against DmCRY/pdf. Black ♦ indicates p ≤ 0.05 for comparisons against cry-null. Light blue * indicates FDR adjusted p ≤ 0.1 for comparisons against DmCRY/pdf. Light orange × indicates FDR adjusted p ≤ 0.1 for comparisons against AeCRY1/pdf. Light purple + indicates FDR adjusted p ≤ 0.1 for comparisons against AgCRY1/pdf. (B-I) Light-evoked change in membrane potential at: 200 μW/cm2 UV stimulus for (B) DmCRY (light blue, n=9) vs cry-null (grey, n=6) and (C) AeCRY1 (light orange, n=10) vs AgCRY1 (light purple, n=9); 20 μW/cm2 UV stimulus for (D) DmCRY (n=8) vs cry-null (n=6) and (E) AeCRY1 (n=10) vs AgCRY1 (n=9); 2 μW/cm2 UV stimulus for (F) DmCRY (n=8) vs cry-null (n=6) and (G) AeCRY1 (n=10) vs AgCRY1 (n=8); and 0.2 μW/cm2 UV stimulus for (H) DmCRY (n=8) vs cry-null (n=5) and (I) AeCRY1 (n=10) vs AgCRY1 (n=8). Purple bar on membrane potential plots indicates the timing of the 5 seconds of UV-light stimuli and black scale-bar indicates 5 seconds. Traces represent the average last 60 seconds of each recording. Red * indicates FDR adjusted p ≤ 0.1 between DmCRY/pdf and cry-null. Red × indicates FDR adjusted p ≤ 0.1 between AeCRY1/pdf and DmCRY/pdf. Red + indicates FDR adjusted p ≤ 0.1 between AgCRY1/pdf and DmCRY/pdf. Red ▲ indicates FDR adjusted p ≤ 0.1 between AgCRY1/pdf and AeCRY1/pdf. Red ■ indicates FDR adjusted p ≤ 0.1 between AgCRY1/pdf and cry-null. Red ● indicates FDR adjusted p ≤ 0.1 between AeCRY1/pdf and cry-null. Data are represented as mean ± SEM. For black significance symbols: One symbol; p ≤ 0.05, two symbols; p ≤ 0.005, three symbols; p ≤ 0.001. For colored significance symbols: One symbol; p ≤ 0.1, two symbols; p ≤ 0.05, three symbols; p ≤ 0.01. See also Figure S5.
Figure 5.
Figure 5.. AeCRY1 and AgCRY1 mediate electrophysiological responses to short-wavelength UV light
Light-evoked (A) FF ratio, (B-D) post-stimulus FF, and (E-G) membrane potential responses to UV light stimulus (5 seconds, 365 nm, 200 μW/cm2) of l-LNvs expressing: (A, B, E) DmCRY (blue, crypGAL4–24 (n=19); light blue, pdfGAL4 (n=12); grey, cry-null (n=19)), (A, C, F) AeCRY1 (orange, crypGAL4–24 (n=11); light orange, pdfGAL4 (n=10)), and (A, D, G) AgCRY1 (purple, crypGAL4–24 (n=8); light purple, pdfGAL4 (n=9)) driven by crypGAL4–24 versus pdfGAL4 drivers over a cry-null background. (E-G) Purple bar on membrane potential plots indicates the timing of the 5 seconds of UV-light stimuli and black scale-bar indicates 5 seconds. Traces represent the average last 60 seconds of each recording. (A) Red * indicates FDR adjusted p ≤ 0.1 compared to DmCRY/cry24. Red × indicates FDR adjusted p ≤ 0.1 compared against AeCRY1/cry24. Red + indicates FDR adjusted p ≤ 0.1 compared to AgCRY1/cry24. Light red * indicates FDR adjusted p ≤ 0.1 compared to DmCRY/pdf. Light red + indicates FDR adjusted p ≤ 0.1 compared to AgCRY1/pdf. (B-G): Black * indicates p ≤ 0.05 between DmCRY/cry24 and cry-null. Black ■ indicates p ≤ 0.05 between AgCRY1/cry24 and cry-null. Red * indicates FDR adjusted p ≤ 0.1 between DmCRY/cry24 and cry-null. Red ■ indicates FDR adjusted p ≤ 0.1 between AgCRY1/cry24 and cry-null. Red ● indicates FDR adjusted p ≤ 0.1 between AeCRY1/cry24 and cry-null. Light red * indicates FDR adjusted p ≤ 0.1 between DmCRY/pdf and cry-null. Light red ■ indicates FDR adjusted p ≤ 0.1 between AgCRY1/pdf and cry-null. Light red ● indicates FDR adjusted p ≤ 0.1 between AeCRY1/pdf and cry-null. Blue − indicates FDR adjusted p ≤ 0.1 between DmCRY/cry24 and DmCRY/pdf. Orange − indicates FDR adjusted p ≤ 0.1 between AeCRY1/cry24 and AeCRY1/pdf. Purple − indicates FDR adjusted p ≤ 0.1 between AgCRY1/cry24 and AgCRY1/pdf. Data are represented as mean ± SEM. For black significance symbols: One symbol; p ≤ 0.05, two symbols; p ≤ 0.005, three symbols; p ≤ 0.001. For colored significance symbols: One symbol; p ≤ 0.1, two symbols; p ≤ 0.05, three symbols; p ≤ 0.01. See also Figures S4, S5, and S6.
Figure 6.
Figure 6.. AgCRY1 elicits a strong and robust red-light response, while AeCRY1 does not
Light-evoked (A) FF ratio, (B, C) post-stimulus FF, and (D, E) membrane potential comparison of red-light (635 nm, 200 μW/cm2) excited l-LNvs expressing: (A, B, D) DmCRY (blue, n=24) and negative control cry-null (grey, n=15), (A, C, E) AeCRY1 (orange, n=11) and AgCRY1 (purple, n=14). (D, E) Red bar on membrane potential plots indicates the timing of the 5 seconds of red-light stimuli and black scale-bar indicates 5 seconds. Traces represent the average last 60 seconds of each recording. (A-E) Black × indicates p ≤ 0.05 between AeCRY1/cry24 and DmCRY/cry24. Black ▲ indicates p ≤ 0.05 between AgCRY1/cry24 and AeCRY1/cry24. Black ■ indicates p ≤ 0.05 between AgCRY1/cry24 and cry-null. Black ● indicates p ≤ 0.05 between AeCRY1/cry24 and cry-null. Red * indicates FDR adjusted p ≤ 0.1 between DmCRY/cry24 and cry-null. Red ▲ indicates FDR adjusted p ≤ 0.1 between AgCRY1/cry24 and AeCRY1/cry24. Red ■ indicates FDR adjusted p ≤ 0.1 between AgCRY1/cry24 and cry-null. Data are represented as mean ± SEM. For black significance symbols: One symbol; p ≤ 0.05, two symbols; p ≤ 0.005, three symbols; p ≤ 0.001. For colored significance symbols: One symbol; p ≤ 0.1, two symbols; p ≤ 0.05, three symbols; p ≤ 0.01. See also Figure S7.
Figure 7.
Figure 7.. Mosquito CRY1s confer species-specific and intensity-dependent behavioral attraction and avoidance to UV light
(A-C) UV attraction/avoidance behavior is measured by % activity in a dark shaded environment versus (A) very low-intensity (1 μW/cm2), (B) moderately low-intensity (10 μW/cm2), and (C) high-intensity (400 μW/cm2) UV-exposed environments (365 nm) during the light phase of a standard 12:12 hr LD cycle. Preference is calculated by percentage of activity in each environment over total activity for each time bin. (A) DmCRY (blue, n=76) vs. diurnal AeCRY1 (orange, n=65) vs. nocturnal AgCRY1 (purple, n=65) expressing flies show a strong attraction to very low-intensity (1 μW/cm2) UV light in the first 30 minutes of UV light exposure. (B) Daytime-active DmCRY (blue, n=76) and AeCRY1 (orange, n=76) flies show a maintained, slightly stronger attraction to low-intensity (10 μW/cm2) UV light in the first 30 minutes of UV light exposure, whereas nocturnal AgCRY1 (purple, n=78) expressing flies show a fast, strong negative phototaxis after a few minutes of UV light exposure. (C) DmCRY (blue, n=73) and AgCRY1 (purple, n=72) expressing flies show a strong and very fast negative phototaxis to high-intensity (400 μW/cm2) UV light in the first couple minutes of UV light exposure, whereas diurnal AeCRY1 (orange, n=63) remain strongly attracted to the UV environment. All plots are shown from ZT 0–30 min in 1-min bins. (D-F) Quantified mean % activity of flies in UV environment across the first 30 minutes for (D) very low-intensity, (E) moderately low-intensity, and (F) high-intensity UV light environments. Black + indicates p ≤ 0.05 between AgCRY1/cry24 and DmCRY/cry24. Black × indicates p ≤ 0.05 between AeCRY1/cry24 and DmCRY/cry24. Black ▲ indicates p ≤ 0.05 between AgCRY1/cry24 and AeCRY1/cry24. Data are represented as mean ± SEM. One significance symbol; p ≤ 0.05, two significance symbols; p ≤ 0.005, three significance symbols; p ≤ 0.001.

Similar articles

Cited by

References

    1. Whitfield J Portrait of a serial killer. Nature (2002) 10.1038/news021001-6 - DOI
    1. Bidlingmayer WL (1994) How Mosquitoes See Traps: Role of Visual Responses. J. Am. Mosq. Control Assoc. 10, 272–279. - PubMed
    1. Ditzen M, Pellegrino M, and Vosshall LB (2008) Insect Odorant Receptors Are Molecular Targets of the Insect Repellent DEET. Science 319, 1838–1842. - PubMed
    1. Lazzari CR (2009) Chapter 1 Orientation Towards Hosts in Haematophagous Insects. In Advances in Insect Physiology; Elsevier; 37, 1–58.
    1. McMeniman CJ, Corfas RA, Matthews BJ Ritchie SA, and Vosshall LB (2014) Multimodal Integration of Carbon Dioxide and Other Sensory Cues Drives Mosquito Attraction to Humans. Cell 156, 1060–1071. - PMC - PubMed

Publication types