. 2022 Aug 1;5(12):e202201377.
doi: 10.26508/lsa.202201377.

PFKFB4 interacts with ICMT and activates RAS/AKT signaling-dependent cell migration in melanoma

Affiliations

PFKFB4 interacts with ICMT and activates RAS/AKT signaling-dependent cell migration in melanoma

Méghane Sittewelle et al. Life Sci Alliance. .

Abstract

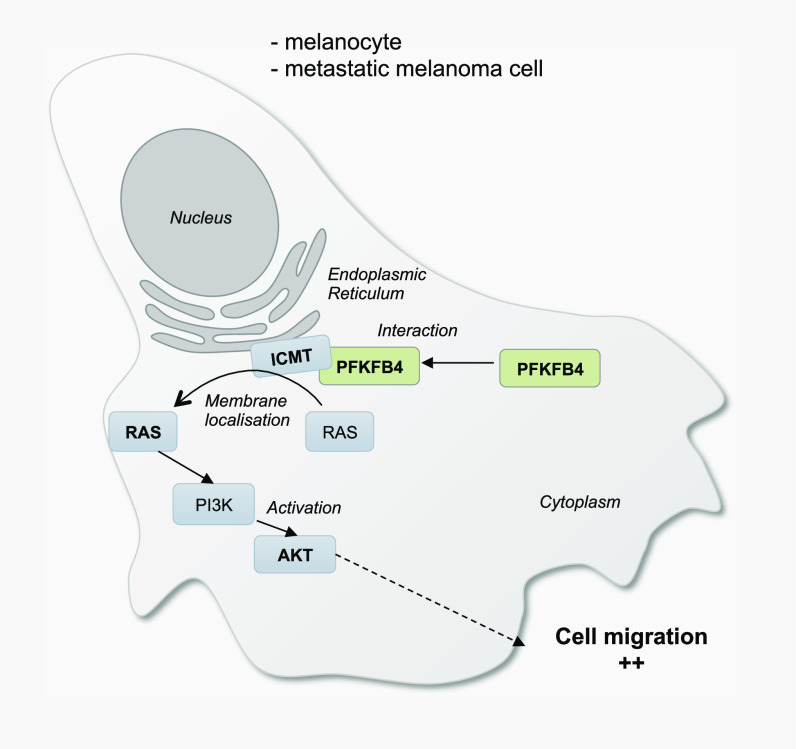
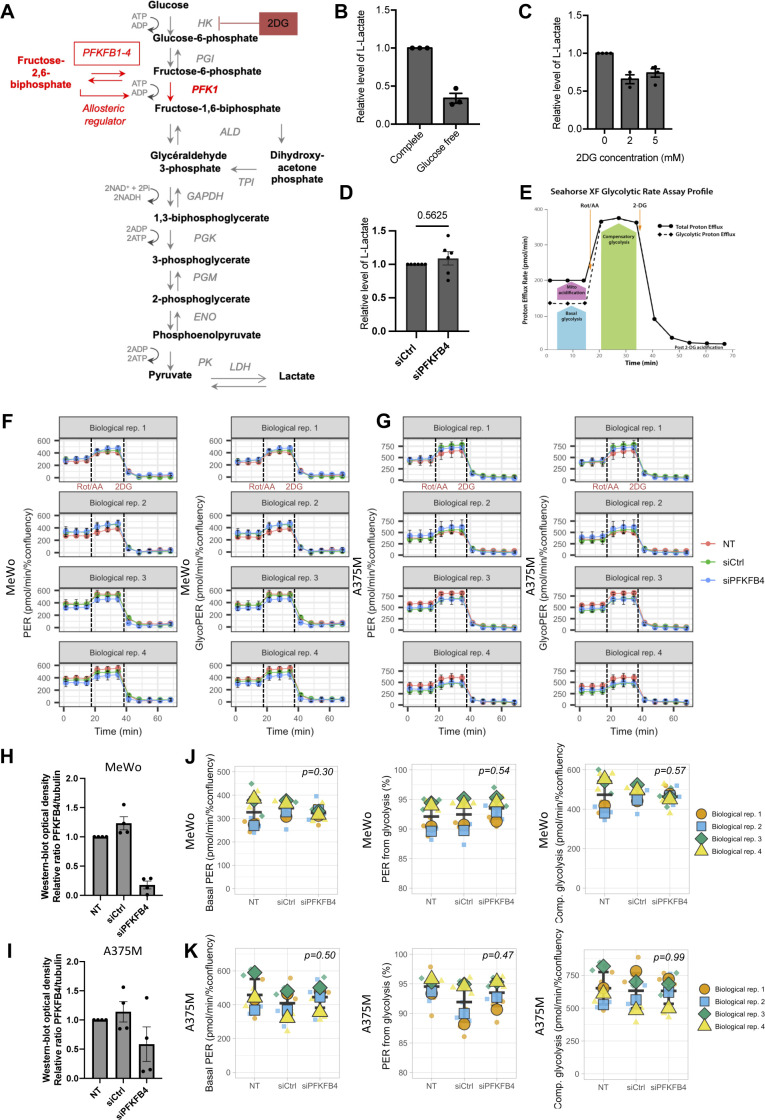
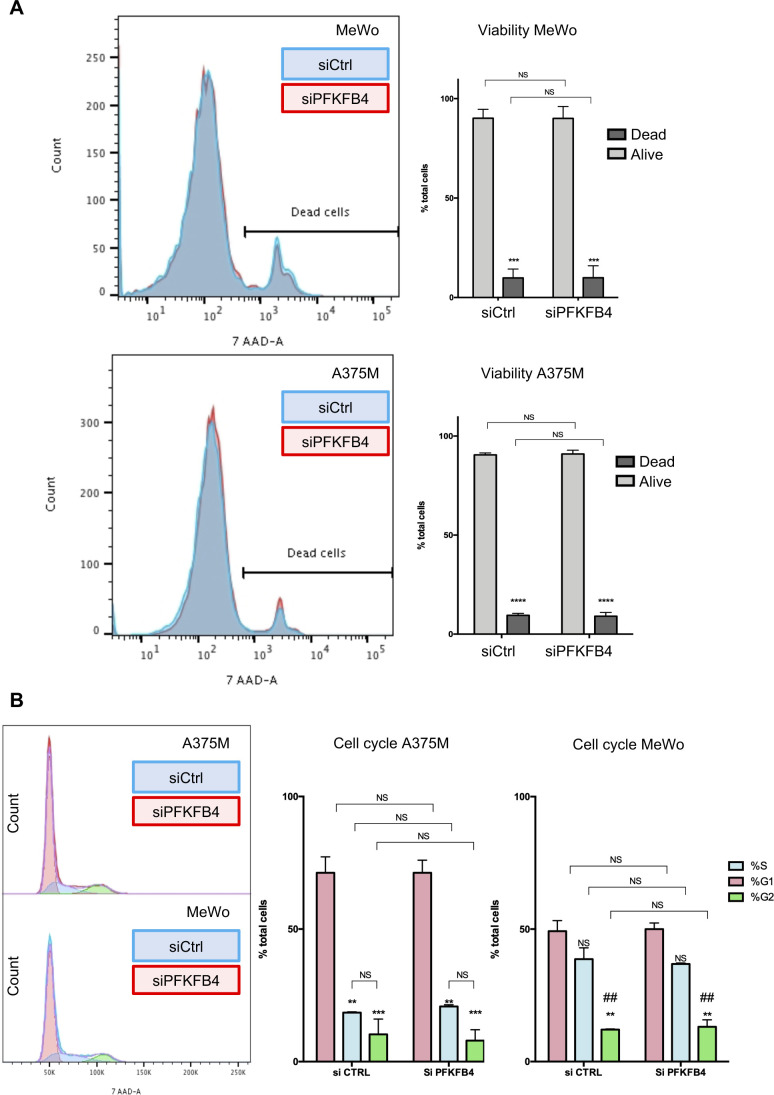
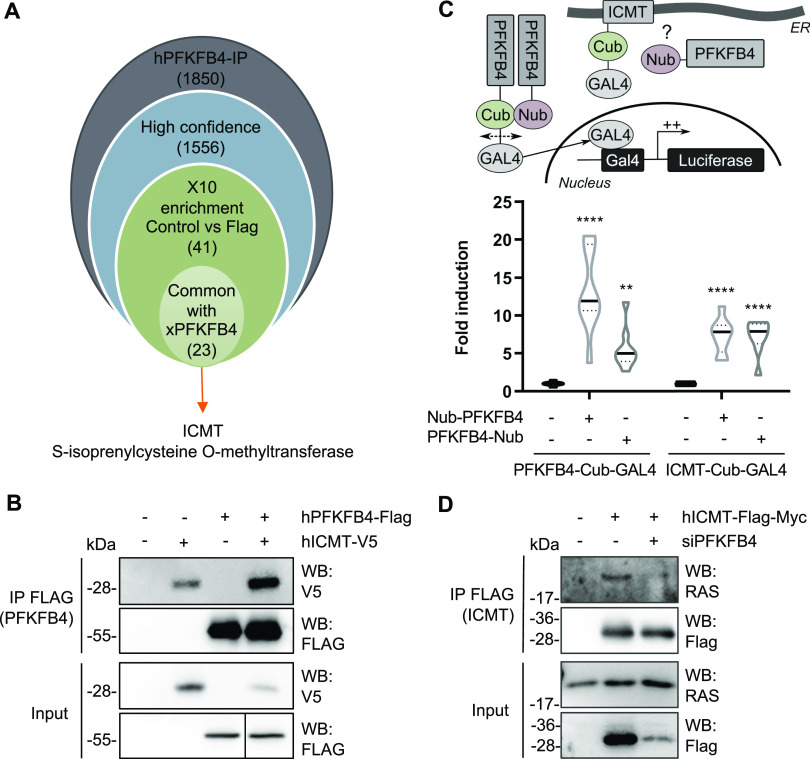
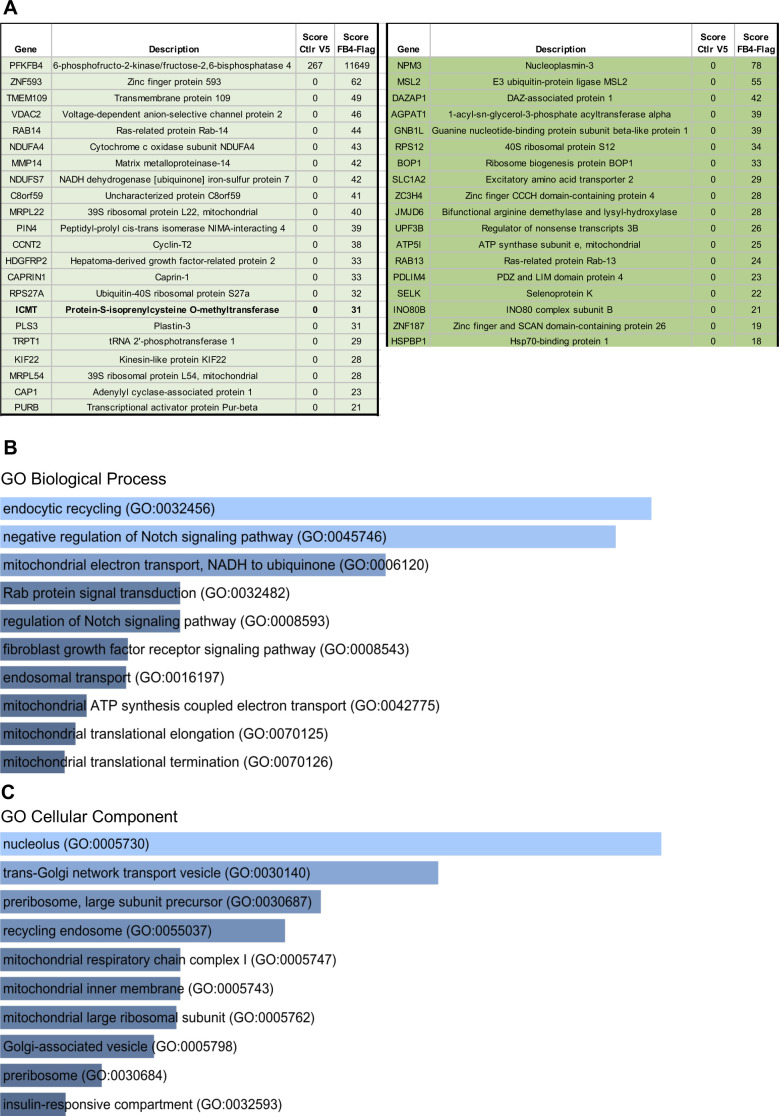
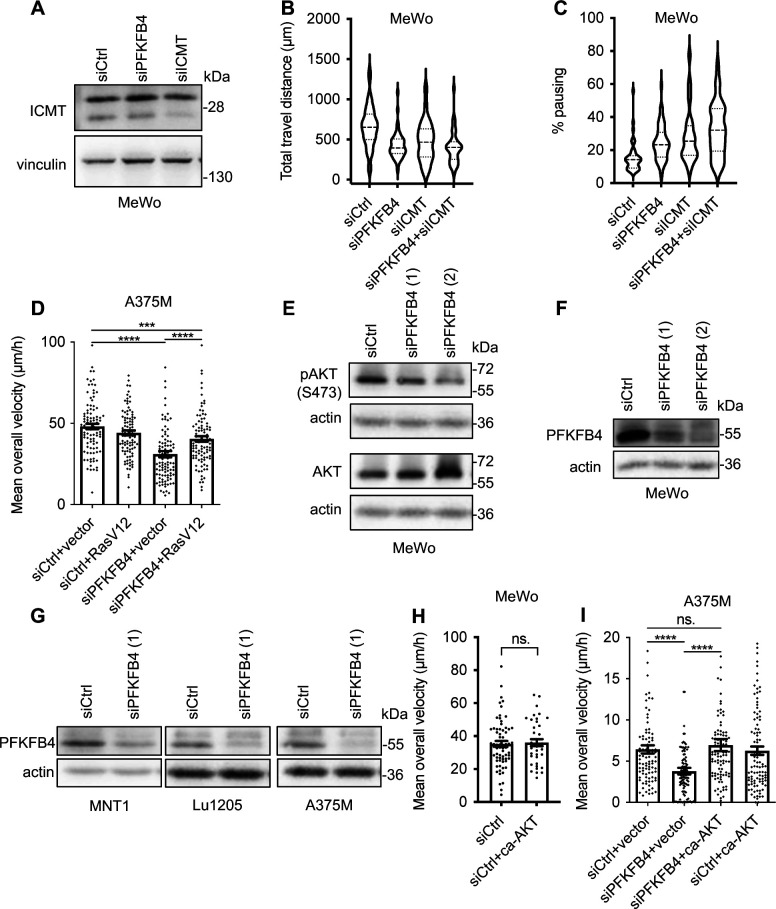
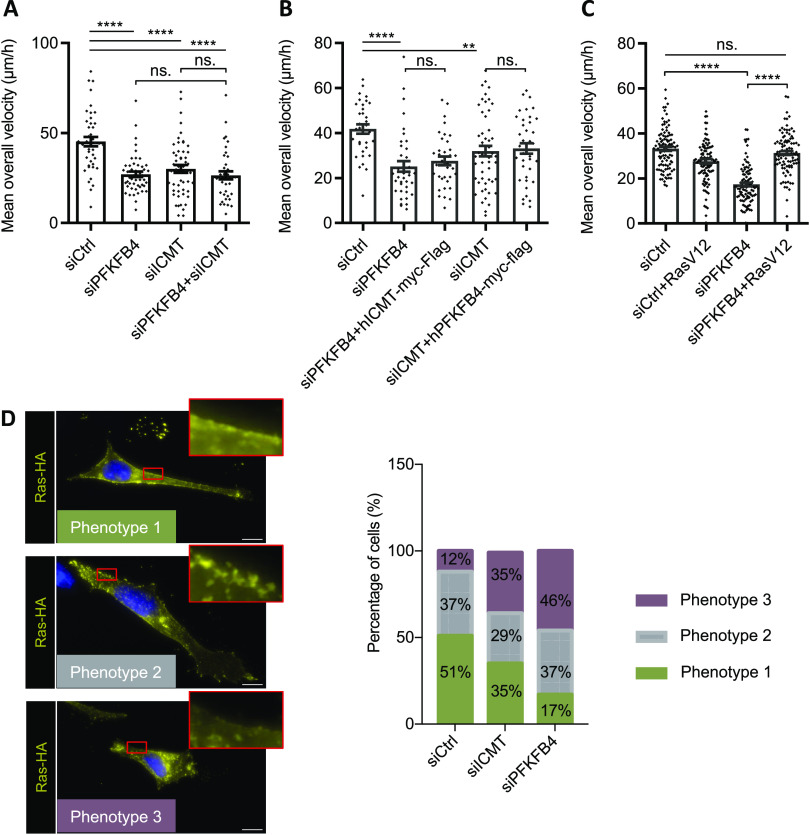
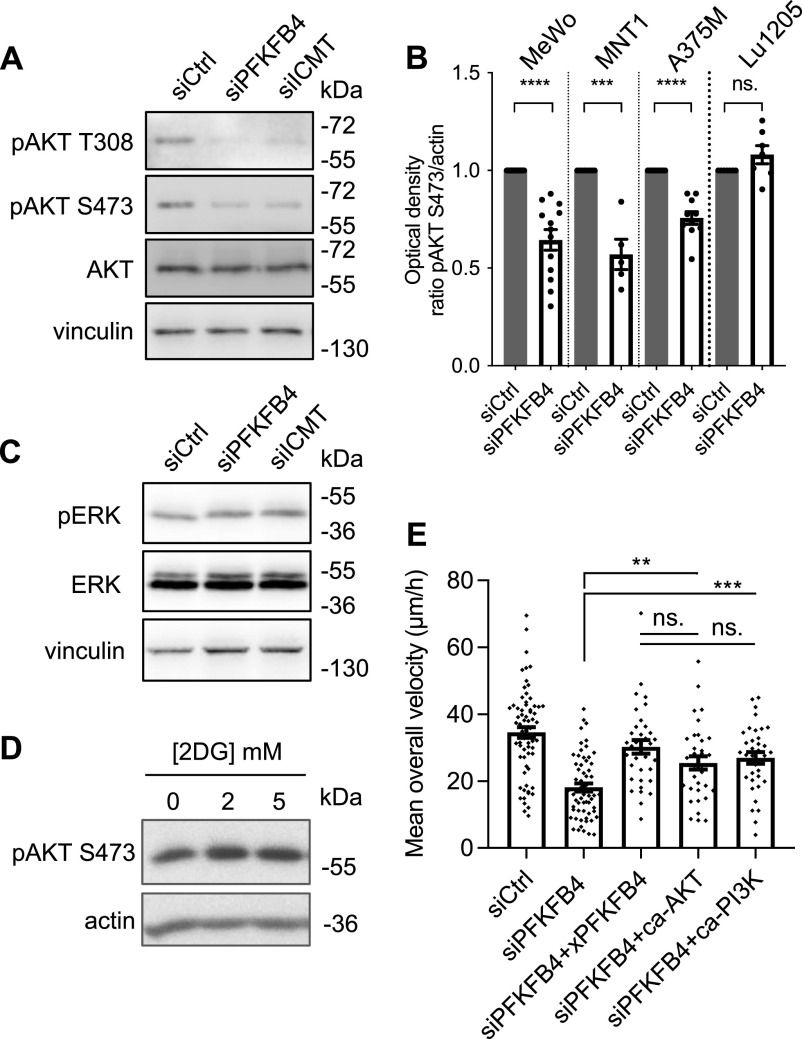
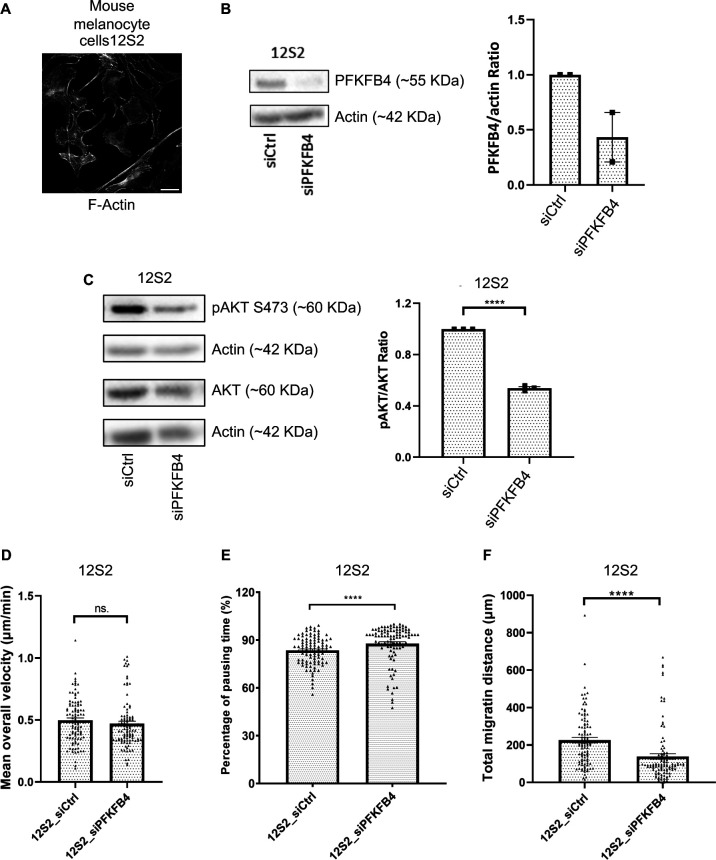
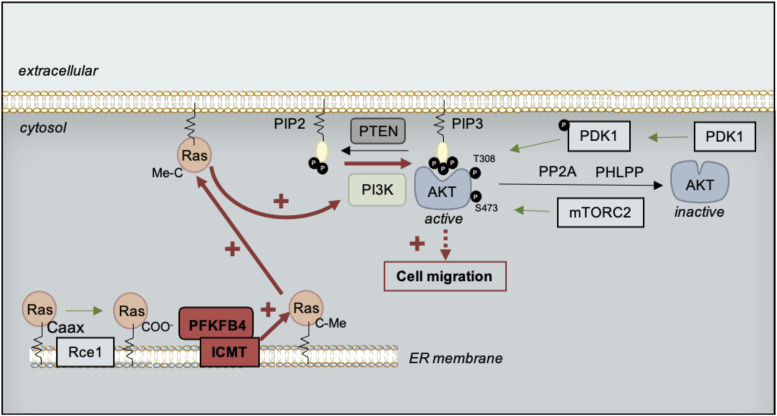
Cell migration is a complex process, tightly regulated during embryonic development and abnormally activated during cancer metastasis. RAS-dependent signaling is a major nexus controlling essential cell parameters including proliferation, survival, and migration, utilizing downstream effectors such as the PI3K/AKT signaling pathway. In melanoma, oncogenic mutations frequently enhance RAS, PI3K/AKT, or MAP kinase signaling and trigger other cancer hallmarks among which the activation of metabolism regulators. PFKFB4 is one of these critical regulators of glycolysis and of the Warburg effect. Here, however, we explore a novel function of PFKFB4 in melanoma cell migration. We find that PFKFB4 interacts with ICMT, a posttranslational modifier of RAS. PFKFB4 promotes ICMT/RAS interaction, controls RAS localization at the plasma membrane, activates AKT signaling and enhances cell migration. We thus provide evidence of a novel and glycolysis-independent function of PFKFB4 in human cancer cells. This unconventional activity links the metabolic regulator PFKFB4 to RAS-AKT signaling and impacts melanoma cell migration.


Conflict of interest statement

The authors declare that they have no conflict of interest.

Figures

None
Graphical abstract
Figure S1.
Figure S1.. Melanomas exhibit high expression of PFKFB4 mRNA.
Compared to other tumors, melanomas express high levels of PFKFB4, followed by gliomas. https://portals.broadinstitute.org/ccle/.
Figure 1.
Figure 1.. PFKFB4 controls in vitro cell migration in metastatic melanoma in a glycolysis-independent manner.
(A, B) Quantification of PFKFB4 mRNA and protein levels in four human melanoma cell lines: MNT1, A375M, MeWo, and Lu1205. (A) Relative PFKFB4 mRNA levels measured by RT-qPCR and normalized by the expression of 18S and TBP housekeeping genes. Error bars: SEM. (B) PFKFB4 protein levels detected by Western-blotting, with PFKFB4/actin relative quantification (optical density). (C) PFKFB4 protein levels in MeWo and A375M cells 48 h after transfection with siRNA targeting PFKFB4 with or without co-transfection with Xenopus laevis PFKFB4 plasmid. (D) Starting 48 h after transfection, cell migration was tracked for 16 h from phase-contrast images. Scale bar is 20 μm. Each point corresponds to the average speed of one cell. (E, F, G, H, I) MeWo (E, G, H, I) or A375M (F) cells were co-transfected either with siControl/empty plasmid, siPFKFB4/empty plasmid, or with siPFKFB4 together with a X. laevis PFKFB4 plasmid in its wild-type form (E, F, I) or mutant forms (I). 27 independent biological replicates were performed, with 50–100 cells counted in each condition. Velocity reduction was in average of 33% for MeWo cells and of 42% for A375M cells. (G, H) The average speed was also measured when cells were cultured in glucose-free medium (G) or complete medium supplemented with 2DG (H). In each panel, a representative experiment is shown (n > 3), and displays mean ± SEM. P-values were calculated using the Mann–Whitney test. n.s.: P > 0.05; *P < 0.05; **P < 0.01; ***P < 0.001; ****P < 0.0001. Source data are available for this figure.
Figure S2.
Figure S2.. PFKFB4 controls metastatic melanoma cell migration in vitro.
(A) Metastasis properties and mutational status of the cell lines used in this study. Sequencing results for key melanoma driver mutations BRafV600E and RasQ61/G12 locus were retrieved from Rambow et al (2015) and Ranzani et al (2015) and ATCC database. NA: nonavailable data. (B) Schematic structure of the Xenopus laevis PFKFB4 wild-type protein (xPFKFB4) and V5-tagged xPFKFB4 mutants. The xPFKFB4-DBM-V5 (G48A; H258A) mutant is both kinase-dead and phosphatase-dead. The xPFKFB4-Nter-V5 is a truncated form of PFKFB4 with the kinase domain conserved. xPFKFB4-Cter-V5 is a truncated form of PFKFB4 with the domain phosphatase domain conserved. (C, D, E, F) Violin plots showing the travel distance (C, E) and pausing (D, F) parameters measured in MeWo (C, D) and A375M (E, F) cells, 48 h after transfection either with siControl+empty vector, siPFKFB4+empty vector or siPFKFB4+xenopus PFKFB4 wild-type. The violin plots represent the probability density at each value; lines are plotted at the median and quartiles. Each graph represents one experiment performed more than three times. (G, H) Wound healing scratch assay on MeWo cells transfected either with siCtrl or siPFKFB4. (G) Representative images of the segmented wound after 0, 24 and 48 h. Yellow: cell confluence, purple: initial wound area. (H) Relative percentage of cell density in the wound measured every 3 h (n = 2 biological replicates including in total six technical replicates for siCtrl and five technical replicates for siPFKFB4).
Figure S3.
Figure S3.. PFKFB4 controls metastatic melanoma cell migration in a glycolysis-independent manner.
(A) Summary of glycolysis. The rate-limiting step of glycolysis is the second irreversible reaction, catalyzed by phosphofructokinase-1 (PFK1). PFK1 activity depends on the availability of its allosteric regulator, fructose-2,6-bisphosphate. PFKFB4 catalyzes the synthesis or degradation of fructose-2,6-bisphosphate. The 2-deoxyglucose (2DG) is a glucose analog that cannot be metabolized. 2DG blocks glycolysis by competition with cellular glucose. At the end of the glycolysis, pyruvate is transformed into lactate, which is secreted in the extracellular medium. Lactate levels are a readout for the rate of glycolysis. (B, C, D) Relative extracellular L-lactate levels in MeWo cells cultured either in a complete medium or in glucose-free medium (B), treated with different concentrations of 2DG (C) or transfected either with siCtrl or siPFKFB4 (D). P-value was calculated using the Mann–Whitney test. (E) Seahorse XF glycolytic rate assay profile highlighting different glycolytic parameters measurement after sequential addition of rotenone/antimycin A mitochondrial respiration inhibitors and 2-DG glycolysis inhibitor. (F, G) Real-time proton efflux rate (PER) and glycoPER calculated from extracellular acidification rate and oxygen consumption rate measurements performed and analyzed by Seahorse in MeWo (F) and A375M (G) cells, in four different biological replicates non transfected (NT, red), or transfected with siCrl (green) or siPFKFB4 (blue). Bars represent mean ± SD of technical replicates. (H, I) Normalized PFKFB4/tubulin levels in MeWo (H) or A375M (I) determined by Western blot of the four biological replicates used for the Seahorse experiments. One point represents one biological replicate. (F, G, J, K) SuperPlots of mean values of the total basal PER, percentage of glycoPER, and compensatory glycolysis deduced from real-time Seahorse experiments presented in (F) and (G) for MeWo (J) and A375M (K) cells. Each small shape represents a technical replicate, and large shapes represent the mean value of each biological replicate. Bars represent mean ± SD. P-value was calculated using t test.
Figure S4.
Figure S4.. PFKFB4 depletion does not alter cell viability nor cell death.
(A) Cells (MeWo or A375M) were stained with 7-AAD and counted after siCo (blue curve) and siPFKFB4 (red curve) transfection. In both cell lines, cell death was minimal and the two conditions overlapped perfectly. Thus, PFKFB4 depletion did not increase cell death rate. (B) Similarly, the relative number of cells in each of the phase of the cell cycle was counted. In either cell line, global curves overlapped perfectly and the relative ratio of G1 (red), S (blue), and G2 (green) phase was unchanged. ## indicates difference between G2 and both G1 and S.
Figure 2.
Figure 2.. PFKFB4 interacts with ICMT, a major posttranslational modifier of RAS GTPases.
(A) Workflow used to select candidates after PFKFB4 immunoprecipitation followed by mass spectrometry analysis (see text for details). (B) Enrichment of ICMT tagged with V5 after immunoprecipitation by FLAG PFKFB4 from MeWo cell extracts. (C) Scheme of the MaMTH strategy used to validate PFKFB4/ICMT protein–protein interactions. Violin plot showing the luciferase activity measured and normalized from MaMTH-modified HEK293T cells extracts (n = 3). The violin represents the probability density at each value; lines are plotted at the median and quartiles (Two-way ANOVA test. **P < 0.01 and ****P < 0.0001). (D) The interaction between tagged ICMT and endogenous RAS was evaluated with or without PFKFB4 depletion (n = 2). Immunoprecipitation of FLAG-ICMT from MeWo cells followed by Western blotting with antibody against V5, FLAG, or endogenous RAS. Source data are available for this figure.
Figure S5.
Figure S5.. Results of IP PFKFB4 followed by mass spectrometry.
(A) List of the top-40 candidate interactants of PFKFB4. We divided the result list into two parts. On the left, common targets found when the immunoprecipitation is done with xenopus or human PFKFB4 (22 targets in light green). On the right, targets only found with human PFKFB4 (18 targets in dark green). (B, C) Gene ontology analysis of potential partners of PFKFB4 – EnrichR results. (B) GO Biological process 2018 of EnrichR datas, sorted by P-value ranking. (C) GO Cellular component 2018 of EnrichR datas, sorted by P-value ranking.
Figure S6.
Figure S6.. PFKFB4 and ICMT control AKT signaling in melanoma.
(A) Control of the efficiency of siRNA targeting ICMT in MeWo cells. (B, C) Violin plots showing the travel distance (B) and pausing (C) parameters measured in MeWo cells, 48 h after transfection either with siControl, siPFKFB4, siICMT, or both. The violin plots represent the probability density at each value; lines are plotted at the median and quartiles. (D) Average speed of MeWo cells transfected with siRNA (siCtrl or siPFKFB4) and plasmid (empty vector or RasV12). (E) Protein levels pAKT S473, AKT, and actin in MeWo cells transfected with two different siRNA targeting PFKFB4. (F, G) Control of the efficiency of siRNAs targeting PFKFB4 in different melanoma cell lines by Western-blot 48 h after transfection. (H) Average speed of MeWo cells 48 h after transfection either with siControl+empty vector or siCtrl+caAKT. This experiment shows that caAKT alone does not increase the average speed of MeWo cells. (I) Average speed of A375M cells transfected either with siControl+empty vector, siPFKFB4+empty vector, siPFKFB4+xenopus PFKFB4 wild-type, and siPFKFB4+caAKT. (D, H, I) In (D, H, I): Graphs show the mean ± SEM. P-values were calculated using the Mann–Whitney test. n.s. P > 0.05, **P < 0.01, ***P < 0.001, and ****P < 0.0001.
Figure 3.
Figure 3.. ICMT and PFKFB4 both control RAS addressing at the plasma membrane and melanoma cell migration.
(A, B, C) Average speed of MeWo cells transfected with siRNA (siCtrl, siPFKFB4, or siICMT) and plasmid (empty vector, hICMT-myc-Flag, hPFKFB4-myc-Flag, or RasV12). (A, B, C) Graphs show the mean calculated in one experiment with at least 30 cells in each condition (A: n = 1, B: n = 1, C: n = 3), Error bars are calculated with SEM. P-values are calculated using the Mann–Whitney test. n.s.: P > 0.05; *P < 0.05; **P < 0.01; ***P < 0.001; and ****P < 0.0001. (D) Detection of RAS subcellular localization by immunostaining on MeWo cell transfected with RasV12-HA (yellow). Nuclei were stained with DAPI (blue). At the plasma membrane, RAS was found distributed according to three main phenotypes: either a clear and homogeneous membrane localization (Phenotype 1), or the absence of signal (Phenotype 3), or an intermediate phenotype with intermittent RAS expression at the membrane (Phenotype 2). Insets show enlargements of the areas framed in red. Scale bar is 10 μm. The proportion of each phenotypes was quantified after transfection of either siControl (nbcell = 43), or siICMT (nbcell = 51), or siPFKFB4 (nbcell = 46). A representative experiment is shown, n = 3. Source data are available for this figure.
Figure 4.
Figure 4.. PFKFB4 and ICMT both control AKT signaling activation in melanoma cells.
(A) Protein levels of pAKT T308, pAKT S473, AKT, and actin in MeWo cells transfected with siRNA targeting PFKFB4 or ICMT. (B) Normalized pAKT S473/actin levels in MeWo, MNT1, A375, or Lu1205 cells transfected with siRNA targeting PFKFB4 and analyzed as in A; one point represents one biological replicate. (C) Protein levels of pERK, ERK, and vinculin in MeWo cells transfected with siRNA targeting PFKFB4. (D) Protein levels of pAKT S473 in MeWo cells treated with different concentrations of 2DG for 24 h. (E) Average speed of MeWo cells transfected either with siControl+empty vector, siPFKFB4+empty vector, siPFKFB4+xenopus PFKFB4 wild-type, siPFKFB4+caAKT, and siPFKFB4+ca-PI3K. In (A, C, D, E): a representative experiment is shown, n > 3. Graphs show the mean ± SEM. P-values were calculated using the Mann–Whitney test. n.s. P > 0.05, **P < 0.01, ***P < 0.001, and ****P < 0.0001. Source data are available for this figure.
Figure S7.
Figure S7.. PFKFB4 depletion affects AKT activation and cell migration in 12S2 mouse melanocytes.
(A) Wild-type Mouse melanocytes (12S2) were used as a non-tumorigenic migratory cell type closely related to melanoma cells. Scale bar is 20 μm. (B) PFKFB4 was efficiently depleted using siRNA. (C) AKT phosphorylation was defective (S473) after PFKFB4 depletion. (D, E, F) Random single cell migration tracking showed that cell velocity was not significantly changed but that pausing time was significantly increased, resulting in a diminished total migrated distance. Graphs show the mean ± SEM. P-values were calculated using the Mann–Whitney test. n.s. P > 0.05, **P < 0.01, ***P < 0.001, and ****P < 0.0001.
Figure 5.
Figure 5.. Model of cell migration control by a noncanonical function of PFKFB4, modulating RAS signaling.
We propose that the interaction between PFKFB4 and ICMT would promote the ICMT/RAS interaction needed for RAS trafficking to the plasma membrane, where RAS would activate PI3K-mediated AKT phosphorylation on T308. In turn, AKT activation would then modulate cell migration. PTEN, Phosphatase and Tensin homolog; PI3K, phosphoinositide 3-kinase; PIP2, phosphatidylinositol-4,5-bisphosphate; PDK1, Phosphoinositide-dependent kinase 1; PP2A, Protein phosphatase 2; PHLPP, PH domain and Leucine rich repeat Protein Phosphatase; mTORC2, mTOR complex 2; Rce1, Ras converting enzyme 1; ICMT, isoprenylcysteine carboxyl O-methyl transferase.

Similar articles

Cited by

References

    1. Ali Z, Yousaf N, Larkin J (2013) Melanoma epidemiology, biology and prognosis. EJC Suppl 11: 81–91. 10.1016/j.ejcsup.2013.07.012 - DOI - PMC - PubMed
    1. Bertolotto C (2013) Melanoma: From melanocyte to genetic alterations and clinical options. Scientifica (Cairo) 2013: 635203. 10.1155/2013/635203 - DOI - PMC - PubMed
    1. Bruni P, Vandoolaeghe P, Rousseau GG, Hue L, Rider MH (1999) Expression and regulation of 6-phosphofructo-2-kinase/fructose- 2, 6-bisphosphatase isozymes in white adipose tissue. Eur J Biochem 259: 756–761. 10.1046/j.1432-1327.1999.00104.x - DOI - PubMed
    1. Cancer Genome Atlas Network (2015) Genomic classification of cutaneous melanoma. Cell 161: 1681–1696. 10.1016/j.cell.2015.05.044 - DOI - PMC - PubMed
    1. Cansado J (2018) To finish things well: Cysteine methylation ensures selective GTPase membrane localization and signalling. Curr Genet 64: 341–344. 10.1007/s00294-017-0756-x - DOI - PubMed

Publication types