. 2022 Aug 1;5(12):e202101205.
doi: 10.26508/lsa.202101205.

Chr21 protein-protein interactions: enrichment in proteins involved in intellectual disability, autism, and late-onset Alzheimer's disease

Affiliations

Chr21 protein-protein interactions: enrichment in proteins involved in intellectual disability, autism, and late-onset Alzheimer's disease

Julia Viard et al. Life Sci Alliance. .

Abstract

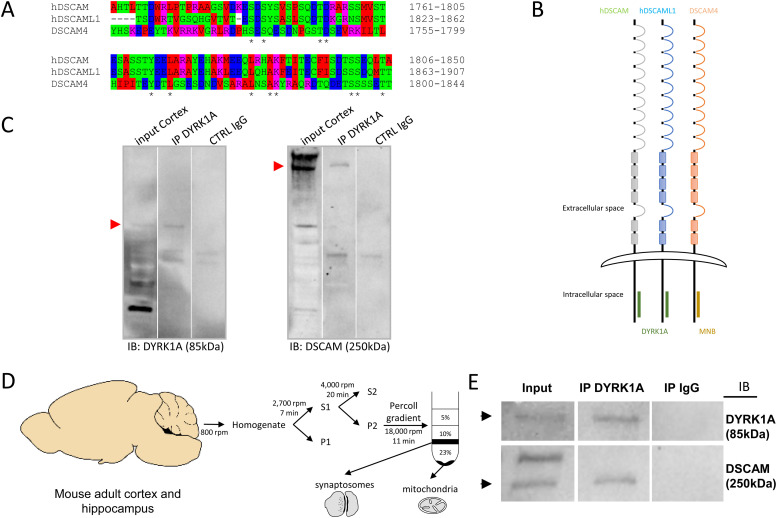
Down syndrome (DS) is caused by human chromosome 21 (HSA21) trisomy. It is characterized by a poorly understood intellectual disability (ID). We studied two mouse models of DS, one with an extra copy of the <i>Dyrk1A</i> gene (189N3) and the other with an extra copy of the mouse Chr16 syntenic region (Dp(16)1Yey). RNA-seq analysis of the transcripts deregulated in the embryonic hippocampus revealed an enrichment in genes associated with chromatin for the 189N3 model, and synapses for the Dp(16)1Yey model. A large-scale yeast two-hybrid screen (82 different screens, including 72 HSA21 baits and 10 rebounds) of a human brain library containing at least 10<sup>7</sup> independent fragments identified 1,949 novel protein-protein interactions. The direct interactors of HSA21 baits and rebounds were significantly enriched in ID-related genes (<i>P</i>-value < 2.29 × 10<sup>-8</sup>). Proximity ligation assays showed that some of the proteins encoded by HSA21 were located at the dendritic spine postsynaptic density, in a protein network at the dendritic spine postsynapse. We located HSA21 DYRK1A and DSCAM, mutations of which increase the risk of autism spectrum disorder (ASD) 20-fold, in this postsynaptic network. We found that an intracellular domain of DSCAM bound either DLGs, which are multimeric scaffolds comprising receptors, ion channels and associated signaling proteins, or DYRK1A. The DYRK1A-DSCAM interaction domain is conserved in <i>Drosophila</i> and humans. The postsynaptic network was found to be enriched in proteins associated with ARC-related synaptic plasticity, ASD, and late-onset Alzheimer's disease. These results highlight links between DS and brain diseases with a complex genetic basis.


Conflict of interest statement

The authors declare that they have no conflict of interest.

Figures

Figure 1.
Figure 1.. STRING Protein–Protein Interaction (PPI) Networks Functional Enrichment for proteins encoded by deregulated genes identified in E17 hippocampus of 189N3 and Dp(16)1Yey transgenic mouse models, respectively.
We performed RNA sequencing on embryonic E17 hippocampi of these two DS models. We identified 84 deregulated genes (50 down-regulated and 34 up-regulated) in 189N3 (Table S1) and 142 deregulated genes (77 down-regulated; 65 up-regulated) in Dp(16)1Yey/+ (Table S2) compared with their littermate controls. (A) For the 50 down-regulated differentially expressed genes of 189N3 mice, we found a PPI enrichment P-value < 1.0 × 10⁻¹⁶ with an enrichment in Gene ontology (GO) GO:0006334∼nucleosome assembly including Hist1h1a, Hist1h1d, Hist4h4, and Hist2h2bb (in green in the PPI network). (B) For the 77 down-regulated differentially expressed genes of Dp(16)1Yey/+, we found a PPI enrichment P-value = 5.83 × 10⁻¹⁰. Are overrepresented in the PPI network: In red, 10 genes (Rph3a, Adora2a, Clstn3, Gabra5, Htr2c, Tac1n Pdyn, Penk, Lypd1, and Otof) GO:0007268 Chemical synaptic transmission (P = 2.77 × 10⁻¹¹). In blue, three genes (Gabra5, Tac1, and Nrgn) GO:0008305 Associative learning (P = 0.00173). In yellow, two genes (Gabra5 and Clstn3) GO:0051932 Synaptic transmission, Gabaergic (P = 0.0210). In green: two genes (Dnm1; Nrgn) GO: 0044327 Dendritic spine head (P = 0.0034).
Figure 2.
Figure 2.. SynGO analysis of differentially expressed genes (DEGs) identified in E17 hippocampus of Dp(16)1Yey transgenic mouse model.
SynGO, Synaptic Gene Ontologies, is an evidence-based, expert-curated resource for synapse function and gene enrichment studies. We identified 142 and DEGs (77 down-regulated and 65 up-regulated) in Dp(16)1Yey/+ (Table S2) compared with their littermate wild-type controls, using a False Discovery Rate < 0.05. We analyzed the 77 down-regulated DEGs using SynGO. 25 of 77 DEGs were mapped to 25 unique SynGO annotated genes. The enriched cellular component ontology terms are: Synapse (n = 23) P = 9.42 × 10⁻¹¹. Presynapse (n = 14) P = 6.22 × 10⁻⁸. Postsynapse (n = 12) P = 1.38 × 10⁻⁵. Neural dense core vesicle (n = 4) P = 1.60 × 10⁻⁵. Integral component of presynaptic membrane (n = 5) P = 1.71 × 10⁻⁴. Postsynaptic specialization (n = 7) P = 4.04 × 10⁻⁴. Integral component of presynaptic membrane (n = 4) P = 4.92 × 10⁻⁴. Synaptic vesicle (n = 4) P = 1.87 × 10⁻³. Postsynaptic density (n = 5) P = 4.69 × 10⁻³.
Figure S1.
Figure S1.. Protein–Protein Interaction Network generated from proteins encoded by deregulated genes identified in E17 hippocampus of 189N3 and Dp(16)1Yey transgenic mouse models, respectively.
We performed RNA sequencing on embryonic E17 hippocampi of these two DS models. We identified 84 deregulated genes in 189N3 (Table S1) and 142 deregulated genes in Dp(16)1Yey/+ (Table S2) compared with their littermate controls. They were included as an input to DAPPLE. Disease Association Protein–Protein Link Evaluator (DAPPLE), which uses high-confidence pairwise protein interactions and tissue-specific expression data to reconstruct a protein–protein interaction network (Rossin et al, 2011). The network is conservative, requiring that interacting proteins be known to be coexpressed in a given tissue. Proteins encoded by deregulated genes are represented as nodes connected by an edge if there is in vitro evidence for high-confidence interaction. (A) For 189N3 mice, we found an enrichment in Gene Ontology (GO) process analyses of differentially expressed genes revealed a deregulation of chromatin proteins for 189N3 mice with: GO:0006334∼nucleosome assembly. (P-value = 1.17 × 10⁻⁸). The DAPPLE network based on the analysis of 75 genes is statistically significant for direct and indirect connectivity more than would be expected by chance. For direct connectivity, Direct edges Count 26; expected 5.5; permuted 9.99 × 10⁻⁴; Seed Direct Degrees Mean 2.26: expected 1.27; permuted P = 9.99 × 10⁻³. For indirect connectivity, Seed Indirect Degrees Mean 52.54; expected 29.43; permuted 9.99 × 10⁻⁴; CI Degrees Mean 2.51; expected 2.28; permuted P = 2.99 × 10⁻³. (B) For Dp(16)1Yey/+, we found a deregulation of proteins involved in synaptic function:GO:0007268∼chemical synaptic transmission (P-value = 6.87 × 10⁻⁹). The network based on the analysis of 131 genes is statistically significant for direct connectivity more than would be expected by chance (Direct edges count, 16; expected 7.933; permuted P = 1.09 × 10⁻²).
Figure S2.
Figure S2.. Products of deregulated genes in Dp(16)1Yey/+ are enriched in proteins linked to glutamate receptor signaling pathway and in proteins involved in an ARC–PSD95 complex linked to ID and intelligence.
We found 142 deregulated genes in Dp(16)1Yey/+ with 77 up-regulated. (A, B) Using Webgestalt suite, we identified two significant networks (A) and (B). (A) A network that includes eight genes from the 70 up-regulated list with an enrichment in Gene Ontology Biological Process: chemical synaptic transmission (P = 220446 × 10−16). (B) A network that includes four genes from the 77 up-regulated list with an enrichment in Gene Ontology Biological Process: Biological Process: glutamate receptor signaling pathway (P = 220446 × 10−16). Note that the three genes (Camk2a, Gda, and Dlgap3) are part of a protein network of ARC-dependent DLG4 interactors that include 20 proteins (Fernández et al, 2017), indicating an over enrichment of 43.85-fold compared with expectations (hypergeometric P-value = 4.20 × 10⁻⁵). (parameters: 3, 20, 77, and 22,508 number of mouse genes from Mouse Ensembl [GRCm38.p6]).
Figure 3.
Figure 3.. High-throughput Y2H identifies 3,636 novel direct interactions with their enrichment in proteins involved in Intellectual Disabilities.
72 screens with HSA21 protein as baits and 82 screens against their direct interactors (rebounds) have been performed using a human brain library. 1,687 and 1,949 novel direct interactions have been identified. These interactions were ranked by category (a–f), using a Predicted Biological Score (Formstecher et al, 2005). (A, B, C) Analysis of direct interactors from 72 HSA21 baits screens (A, B, C). (A, B) 1,687 novel interactions were identified (A) and 76 already known (Biogrid) interactions confirmed (B). (D, E, F) Analysis of direct interactors from 82 rebound screens (D, E, F). (D, E) 1,949 novel interactions were identified (D) and 100 already known (Biogrid) interactions confirmed (E). We compared these direct interactors with three lists of genes involved in Intellectual Disability (Gilissen et al, 2014; Deciphering Developmental Disorders Study, 2015). (C, F) Both HSA21 direct interactors (C) and rebound direct interactors (F) are enriched in ID proteins (see text) suggesting that these two types of interactors are part of a large ID network.
Figure 4.
Figure 4.. Biological processes network interactions from Yeast two-hybrid protein–protein interaction data.
A biological processes analysis using gene ontology (GO) DAVID was realized (see the Materials and Methods section). The colored nodes correspond to the most significative results: GO:0022008∼Neurogenesis; GO:0048812∼Neuron projection morphogenesis; GO:0050767∼Regulation of neurogenesis; GO:0043632∼Modification-dependent macromolecule catabolic process; GO:0051962∼Positive regulation of nervous system development; GO:0045665∼Negative regulation of neuron differentiation with P-value 3.06 × 10⁻¹⁷, 2.91 × 10⁻¹³, 2.66 × 10⁻⁶, 6.46 × 10⁻⁵, 6.29 × 10−6,1.55 × 10−7, respectively. A color corresponds to a cluster of several biological processes. The multi-colored nodes correspond to genes presents in different annotation clusters.
Figure S3.
Figure S3.. Analysis of the STX1A–DYRK1A and LIMK1–HUNK interactions.
(A) Schematic representation of the ∼1.6 Mb locus hemizygous deletion, involved in Williams syndrome, containing ∼28 genes, on chromosome 7q11.23 and including STX1A and LIMK1. (B, C) In situ proximity ligation assays (red dots) were obtained on primary hippocampal neurons fixed at DIC21 (red fluorescence) for STX1A–DYRK1A (B) and LIMK1–HUNK (C). STX1A–TOMM20 is also presented as control. HUNK–AGAP3 proximity ligation assay is also illustrated. Neuronal membranes including dendritic spines were labelled using phalloidin staining (green fluorescence). (D) Quantification of DYRK1A–STX1A interaction with DYRK1A–TOMM20 as a negative control. (E) Quantification of HUNK–LIMK1 and HUNK–AGAP3 interactions with HUNK–BAF155 as a negative control. Mean interaction point numbers were calculated for 100 μm of dendrites of at least 26 cortical neurons at DIC21 (from three different embryos per genotype). ***P < 0.001.
Figure S4.
Figure S4.. Nuclear protein–protein interactions: DYRK1A-E300, DYRK1A-CREBBP and DYRK1A-FAM53 interaction.
(A) Schematic representation of nuclear protein–protein interactions between DYRK1A–E300, DYRK1A–CREBBP, and DYRK1A–FAM53, performed by yeast two-hybrid. The DYRK1A–FAM53 interaction was validated using either DYRK1A and FAM53 as bait. (B) DYRK1A interactome obtained using the generation of 57 isogenic HEK293 cell lines for inducible expression of SH-tagged CMGC bait kinases (Varjosalo et al, 2013). Note the identification of DYRK1A–E300, DYRK1A–CREBBP, and DYRK1A–FAM53 interactions. (C) HEK293 cells were immunoprecipitated (IP) using anti-EP300 and anti-CREBBP antibodies and using anti-IgG antibody as a negative control. The precipitated fractions were then resolved by sodium dodecyl sulphate–polyacrylamide gel electrophoresis (SDS–PAGE) and analyzed by Western blot using anti-EP300, anti-Dyrk1a, and anti-CREBBP antibodies (B2). Red arrows indicate protein bands at the expected size. Note that no cross-reaction was found with the IgGs. (D) In situ proximity ligation assays on primary hippocampal neurons fixed at DIC21 (red fluorescence) using anti-DYRK1A and anti-FAM53C antibodies, anti-DYRK1A, and anti-TOMM20 antibodies as a negative control. Membranes were labelled using phalloidin staining (green fluorescence). Nuclear bodies were labelled using Topro 3 staining (blue fluorescence). Scale bars = 10 μm. *** < P < 0.0005. (E) Mean interaction point numbers were calculated in nuclear body (n = 44 for control; n = 102 for DYRK1A–FAM53C interactions > 25 hippocampal neurons at DIC21).
Figure S5.
Figure S5.. KEGG pathway (hsa04720; llong-term potentiation—Homo sapiens) involving EP300 and CREBBP.
Hippocampal long-term potentiation (LTP), a long-lasting increase in synaptic efficacy, is the molecular basis for learning and memory. The convergence of these pathways, illustrated here, at the level of the CREB/CRE transcriptional pathway may increase expression of a family of genes required for late-phase LTP (L-LTP). (Lynch MA (2004) long-term potentiation and memory; Physiol Rev 84: 87–136) (Blitzer RD, Iyengar R, Landau EM (2005); Postsynaptic signaling networks: Cellular cogwheels underlying long-term plasticity; Biol Psychiatry 57: 113–119).
Figure S6.
Figure S6.. Genomic locus including FAM53C, KDM3B, and Snp 35131895.
From UCSC human genome browser (GRCh38/hg38). Snp 35131895 is associated to Autism Spectrum Disorders.
Figure 5.
Figure 5.. Interactions of HSA21 proteins with proteins involved in late-onset Alzheimer’s disease, intellectual disability, and neuropsychiatric diseases.
(A). Schematic representation of protein–protein interactions identified by yeast two-hybrid using a human brain library. Dark blue circles indicate HSA21-encoded proteins; orange circle indicates a late-onset Alzheimer’s disease-related protein. (B). In situ proximity ligation assay (PLA) on primary cortical neurons transfected at DIC5 and fixed 48 h later at DIC7 (red fluorescence) using anti-GFP and anti-Clu antibodies. PLA using anti-GFP and anti-Fibrillarin antibodies were performed as a negative control. Green fluorescent protein was visualized on green channel and heterochromatin was labelled using Topro3 (blue fluorescence). (C, D) DYRK1A interaction with DROSHA/RNASEN. (C) HEK293 cells were immunoprecipitated (IP) using anti-RNASEN antibody and anti-IgG antibody as a negative control. The input and precipitated fractions were then resolved by sodium dodecyl sulphate–polyacrylamide gel electrophoresis (SDS–PAGE) and analyzed by Western blot using anti-Rnasen, anti-Dgcr8, and anti-Dyrk1a antibodies. The arrows indicate protein bands at the expected size. Note that no cross-reaction was found with the IgGs. (D) In situ PLAs on primary cortical neurons transfected at DIC5 with Dyrk1a-GFP construct (green fluorescence) and fixed at DIC7, using anti-GFP and anti-Rnasen antibodies (red fluorescence). Non-transfected neurons were used as a negative control. Nuclei were labelled using Toprol staining (blue fluorescence). Mean interaction point numbers were calculated in heterochromatin of at least 25 transfected cortical neurons. ***P < 0.0005.
Figure S7.
Figure S7.. Nuclear protein–protein interaction: unedited and high resolution data from gels used in.
Fig 5CHEK293 cells were immunoprecipitated (using anti-RNASEN antibody and anti-IgG antibody as a negative control). The input and precipitated fractions were then resolved by sodium dodecyl sulphate polyacrylamide gel electrophoresis (SDS–PAGE) and analyzed by Western blot using anti-RNASEN, anti-DGRC8, and anti-DYRK1A antibodies. Red arrows indicate protein bands at the expected size. Note that no cross-reaction was found with the IgGs.
Figure 6.
Figure 6.. Chr21-encoded proteins have direct interactors in dendritic spine PSD.
(A, B, C, D, E, F, G). In situ proximity ligation assays (PLA) on primary cortical neurons fixed at DIC21 (red fluorescence). Dendritic network and dendritic spines were labelled using phalloidin staining (green fluorescence). (A). PLA of GRIK1 with direct interactors, HCN1, KCNQ2, SEPT7, KALRN, and DLG4. (B). PLA of TIAM1 with direct interactors DLG4, BIN1, and DLG1. PLA of HUNK with LIMK1, AGAP3, and SYNPO. (C, D) In situ PLA on transgenic Dp(16)1Yey and WT primary cortical neurons fixed at DIC21 (red fluorescence) using anti-Dlg2 and anti-Kcnj6 or anti-Grin2ab antibodies. Quantification of interactions. Mean interaction point numbers were calculated in dendrites of at least 30 cortical neurons at DIC21 (from three different embryos per genotype). *P < 0.05 Scale bars = 10 μm. Mean interaction point numbers were calculated in dendrites of 25–30 cortical neurons at DIC21. (E). PLA of ITSN1 with direct interactors SNAP25 and DLGAP1. (F) Quantification of interactions between DSCAM and DLG1, DLG2 or DLG4; Quantification of interactions between DLG2 and GRIN2A/B. (G) PLA of DSCAM with direct interactors DLG4, DLG1, and DLG2. PLA of DYRK1A with its direct interactor SIPA1L1, of DLG2 with GRIN2A/B and of DLG4 with SIPA1L1 as direct interactors. (H) Yeast two-hybrid one-by-one assays revealed DSCAM and NR2B as interactors of some of DLGs. Lane 1 is the positive control. Lanes 2 and 7 are the negative controls (pP7-DSCAM or pP7-NR2B vector with empty pP7 vector). Lanes 3–6 and 8–11 are the DSCAM and NR2B interactions, respectively. Please see Fig S8 for negative controls and Fig S9 for quantification of PLAs.
Figure S8.
Figure S8.. Protein–protein interactions: control interactions.
In complement to Fig 6 (Chr21-encoded proteins have direct interactors in dendritic spine PSD) here are illustrated control interactions using In situ proximity ligation assays on primary hippocampal neurons fixed at DIC21 (red fluorescence). Neuronal membranes including dendritic spines were labelled using phalloidin staining (green fluorescence). (A, B, C, D, E, F, G) Controls proximity ligation assay for BIN1 (A), DGL2 (B), TIAM1 (C), HUNK (D), DYRK1A (E), GRIK1 (F), and ITSN1 (G). Scale bars = 10 μm.
Figure S9.
Figure S9.. Quantification of protein–protein interactions in dendrites.
In complement to Fig 6 (Chr21-encoded proteins have direct interactors in dendritic spine PSD), we quantified mean interaction point numbers that were calculated in dendrites of at least 26 cortical neurons at DIC21 (from three different embryos per genotype). *P < 0.05, **P < 0.01, ***P < 0.001. In situ proximity ligation assays (red dots) were obtained on primary hippocampal neurons fixed at DIC21 (red fluorescence). Neuronal membranes including dendritic spines were labelled using phalloidin staining (green fluorescence).
Figure 7.
Figure 7.. Protein–protein interactions in the three layers of dendritic spine PSD: enrichment in proteins encoded by either HSA21 or late-onset Alzheimer’s disease-GWAS genes.
Schematic representation of synaptic protein–protein interactions performed by yeast-two-hybrid, with the three layers of dendritic spine PSDs indicated (membrane; MAGUKs and DLGAPs). HSA21-encoded proteins are represented as dark blue circles. Late-onset Alzheimer’s disease-GWAS encoded proteins are represented by dark orange circles.
Figure 8.
Figure 8.. Conservation of DSCAM–DYRK1A interaction in human and in drosophila.
(A) AA alignment of the DSCAM domain that interacts with DYRK1A and Minibrain. This alignment was performed with ClustalW 2.1 software. (B) Schematic representation of DSCAM and DYRK1A protein family interaction. Human DSCAM (hDSCAM in green), human DSCAML1 (hDSCAML1 in blue) and its drosophila ortholog (dDSCAM4 in red) share the same conserved protein domain interacting with human DYRK1A (hDYRK1A) or its drosophila ortholog (MNB), respectively. (C) Adult mouse cortical protein extract were immunoprecipitated (IP) using anti-Dyrk1a antibody and anti-IgG antibody as a negative control. The input and precipitated fractions were then resolved by sodium dodecyl sulphate–polyacrylamide gel electrophoresis (SDS–PAGE) and analyzed by Western blot using anti-Dyrk1a and anti-Dscam antibody. Red arrows indicate protein bands at the expected size. Note that no cross-reaction was found with the IgGs. (D) Schematic representation of synaptosome enrichment protocol. (E) Adult mouse cortical synaptosomal protein extracts were immunoprecipitated (IP) using anti-Dyrk1a antibody and anti-IgG antibody as a negative control. The input and precipitated fractions were then resolved by sodium dodecyl sulphate–polyacrylamide gel electrophoresis (SDS–PAGE) and analyzed by Western blot using anti-Dyrk1a and anti-Dscam antibody. Note the band of 85 kD expected for the Dyrk1a protein and the 250-kD band expected for Dscam protein. No cross-reaction was found with the IgGs.

References

    1. Ahn K-J, Jeong HK, Choi H-S, Ryoo S-R, Kim YJ, Goo J-S, Choi S-Y, Han J-S, Ha I, Song W-J, et al. (2006) DYRK1A BAC transgenic mice show altered synaptic plasticity with learning and memory defects. Neurobiol Dis 22: 463–472. 10.1016/j.nbd.2005.12.006 - DOI - PubMed
    1. Antonarakis SE, Skotko BG, Rafii MS, Strydom A, Pape SE, Bianchi DW, Sherman SL, Reeves RH (2020) Down syndrome. Nat Rev Dis Primers 6: 9. 10.1038/s41572-019-0143-7 - DOI - PMC - PubMed
    1. Alarcón JM, Malleret G, Touzani K, Vronskaya S, Ishii S, Kandel ER, Barco A (2004) Chromatin acetylation, memory, and LTP are impaired in CBP+/− mice: A model for the cognitive deficit in Rubinstein-Taybi syndrome and its amelioration. Neuron 42: 947–959. 10.1016/j.neuron.2004.05.021 - DOI - PubMed
    1. Antonarakis SE (2017) Down syndrome and the complexity of genome dosage imbalance. Nat Rev Genet 18: 147–163. 10.1038/nrg.2016.154 - DOI - PubMed
    1. Antonarakis SE, Lyle R, Dermitzakis ET, Reymond A, Deutsch S (2004) Chromosome 21 and down syndrome: From genomics to pathophysiology. Nat Rev Genet 5: 725–738. 10.1038/nrg1448 - DOI - PubMed

Publication types

Associated data