. 2022 Aug 1;13(1):4444.
doi: 10.1038/s41467-022-32130-5.

Aβ42 oligomers trigger synaptic loss through CAMKK2-AMPK-dependent effectors coordinating mitochondrial fission and mitophagy

Affiliations

Aβ42 oligomers trigger synaptic loss through CAMKK2-AMPK-dependent effectors coordinating mitochondrial fission and mitophagy

Annie Lee et al. Nat Commun. .

Abstract

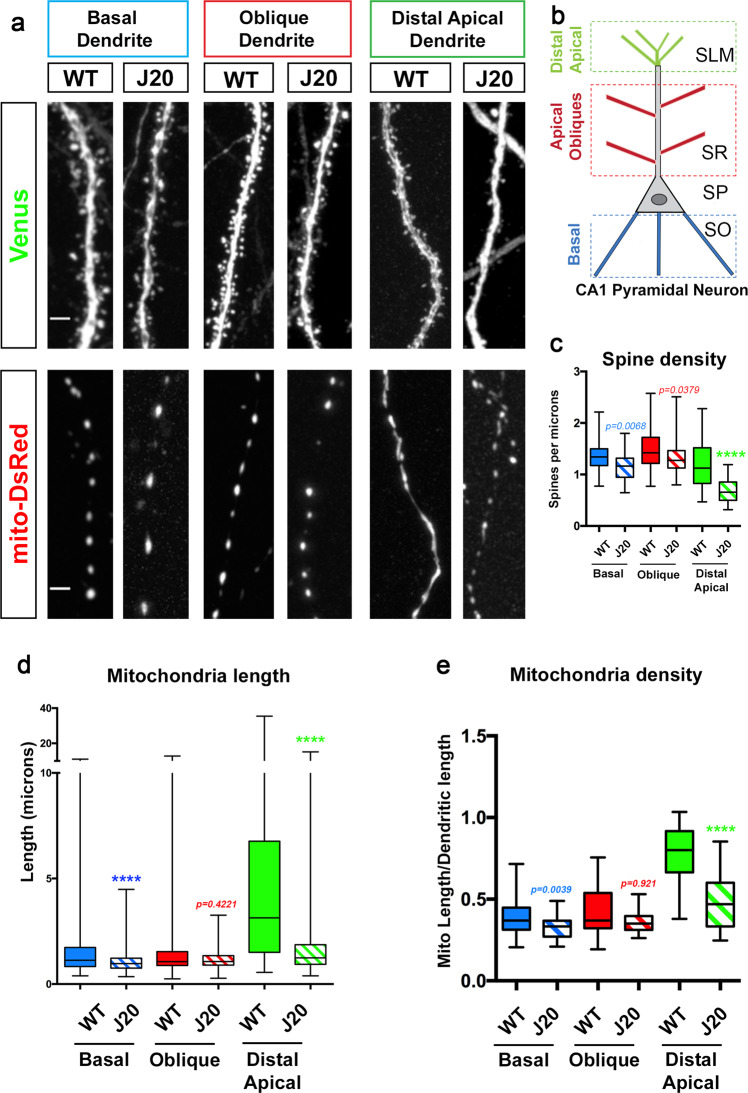
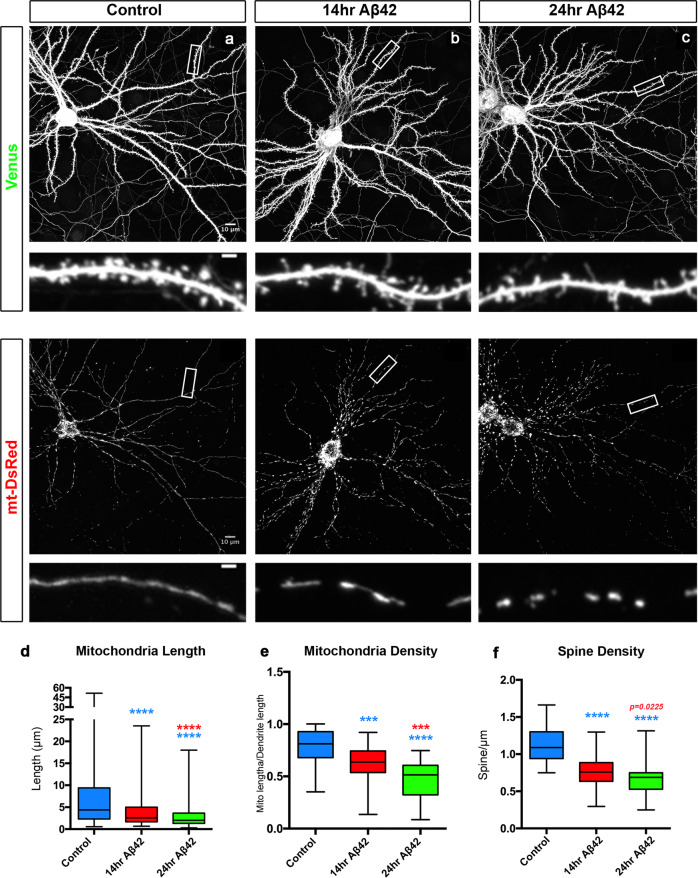
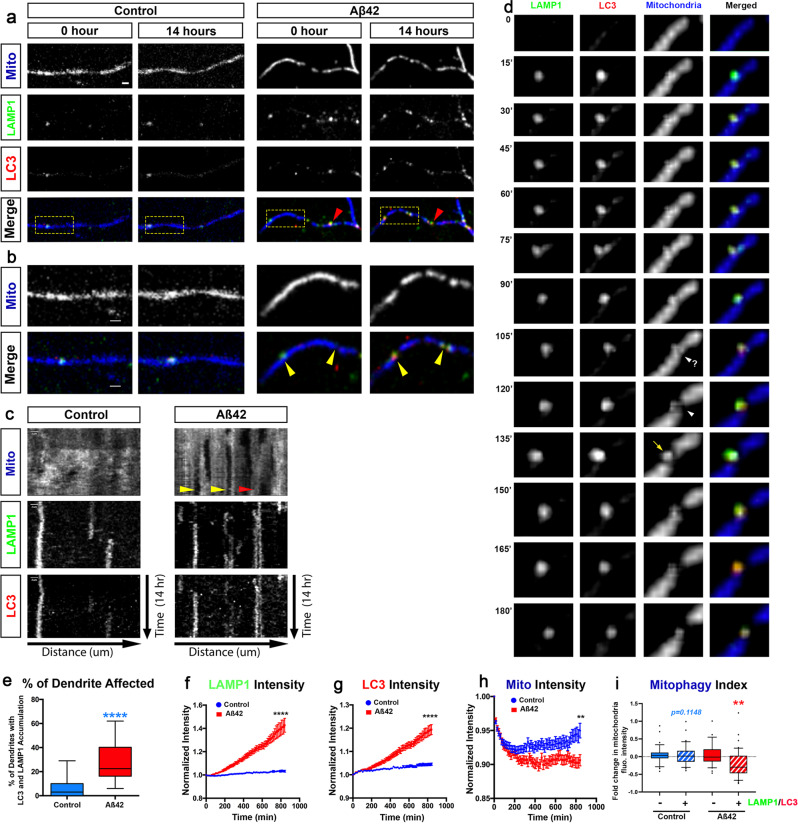
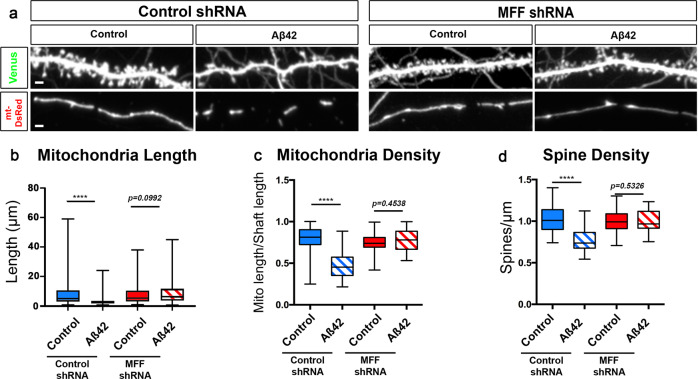
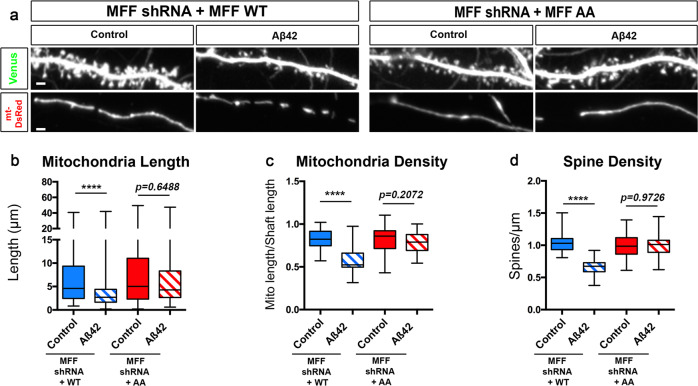
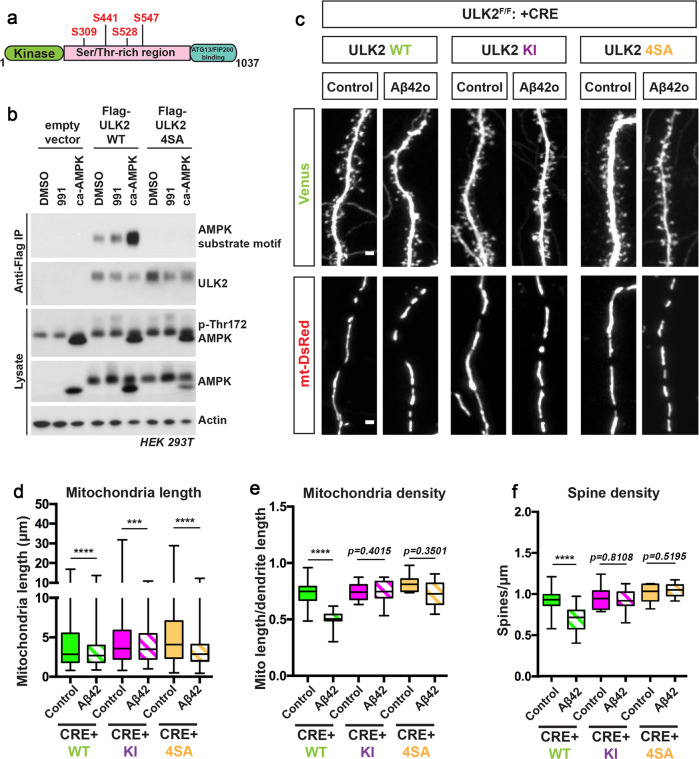
During the early stages of Alzheimer's disease (AD) in both mouse models and human patients, soluble forms of Amyloid-β 1-42 oligomers (Aβ42o) trigger loss of excitatory synapses (synaptotoxicity) in cortical and hippocampal pyramidal neurons (PNs) prior to the formation of insoluble amyloid plaques. In a transgenic AD mouse model, we observed a spatially restricted structural remodeling of mitochondria in the apical tufts of CA1 PNs dendrites corresponding to the dendritic domain where the earliest synaptic loss is detected in vivo. We also observed AMPK over-activation as well as increased fragmentation and loss of mitochondrial biomass in Ngn2-induced neurons derived from a new APPSwe/Swe knockin human ES cell line. We demonstrate that Aβ42o-dependent over-activation of the CAMKK2-AMPK kinase dyad mediates synaptic loss through coordinated phosphorylation of MFF-dependent mitochondrial fission and ULK2-dependent mitophagy. Our results uncover a unifying stress-response pathway causally linking Aβ42o-dependent structural remodeling of dendritic mitochondria to synaptic loss.


Conflict of interest statement

The authors declare no competing interests.

Figures

Fig. 1
Fig. 1. In an AD mouse model (J20), CA1 pyramidal neurons display spatially restricted loss of mitochondrial biomass and dendritic spine loss in distal apical tufts.
a, b Representative images of CA1 PN dendritic segments from different layers of WT control and J20 mice. CA1 PNs were electroporated with pCAG-Venus and pCAG-mito-DsRed by in utero electroporation in E15.5 WT and J20 mouse embryos. Both mouse groups were fixed and imaged at 3-months postnatal (P90). Dendrites from basal, oblique, and distal apical are magnified to show spine density and mitochondrial morphology. The three types of dendritic segments were imaged in three distinct layers as depicted in b for both WT and J20 mice. ce Quantification of spine density (c), individual mitochondrial length (d), and mitochondrial density (e), measured as the fraction of a dendritic segment length occupied by mitochondria. In panels ce, data are represented by box plots displaying minimum to maximum values, with the box denoting 25th, 50th (median), and 75th percentiles from at least three independent in utero electroporated mice. nBasal WT = 47 dendrites, 595 mitochondria; nBasal J20 = 32 dendrites, 495 mitochondria; nOblique WT = 46 dendrites, 630 mitochondria; nOblique J20 = 33 dendrites, 507 mitochondria; nDistal WT = 39 dendrites, 284 mitochondria; nDistal J20 = 32 dendrites; 426 mitochondria. All of the analyses were done blind to the experimental conditions and were manually counted using FIJI. Statistical analyses were performed using Mann–Whitney test (ce). Exact P values are indicated on the figure when available through Prism software, otherwise, the test significance is provided using the following criteria: ***P < 0.001; ****P < 0.0001. Scale bar = 2 μm.
Fig. 2
Fig. 2. Aβ42o induces dendritic mitochondrial fragmentation and dendritic spine loss within the same time frame.
ac Representative images of primary cortical neurons at 21 days in vitro (DIV). Neurons express via ex utero electroporation pCAG-mVenus (upper panels in ac) and pCAG-mito-DsRed (lower panels in ac) to assess spine density and mitochondrial morphology, respectively. At 20 DIV, neurons were treated with either a vehicle control for 24 h or with Aβ42o (300–450 nM, see “Methods” for details) for either 14 or 24 h. High magnification of secondary dendrites is shown below the low magnification of the whole neurons. d Quantification of dendritic mitochondrial length. e Quantification of dendritic mitochondrial density. Dendritic mitochondrial density was calculated by summing the length of all the mitochondria then dividing that cumulative length by the length of the dendritic segment in which the mitochondria were quantified. f Quantification of dendritic spine density, calculated by dividing the number of spines by the length of the dendrite segment in which the spines were quantified. All of the analyses were done blind to the experimental conditions and were done by manual counting using FIJI. In panels df, data are represented by box plots displaying minimum to maximum values, with the box denoting 25th, 50th (median), and 75th percentiles from three independent experiments. ncontrol = 53 dendrites, 278 mitochondria; n14hr Aβ42o = 47 dendrites; 380 mitochondria; n24hr Aβ42o = 51 dendrites, 400 mitochondria. Statistical analyses were performed using Mann–Whitney test in (df). Exact P values are indicated on the figure when available through Prism software, otherwise, the test significance is provided using the following criteria: ***P < 0.001; ****P < 0.0001. Colors of significance symbols correspond to groups being compared. Scale bar for high-magnification dendritic segments = 2 μm.
Fig. 3
Fig. 3. Aβ42o treatment induces local mitophagy in dendrites.
a, b Secondary dendritic segments from primary cortical PNs at 21–25 DIV, ex utero electroporated at E15.5 with pCAG-mito-mTagBFP2, pCAG-LAMP1-mEmerald, and pCAG-RFP-LC3 to visualize mitochondria, lysosomes, and autophagosomes, respectively (a). At 21 DIV, neurons were treated with either a vehicle control or Aβ42o and imaged live using time-lapse microscopy every 15 min for 14 h. The yellow boxes label the magnified areas shown in b illustrating that, in control-treated neurons, there is no significant change in LAMP1 + (lysosomes), LC3 + (autophagosomes), or LC3-LAMP1 double-positive (autolysosomes) vesicle dynamics and/or accumulation (see Supplementary Movies S1 and S2). In contrast, in dendrites of Aβ42o-treated cortical PNs, sites of LAMP1-LC3 double-positive autolysosome accumulation often result in loss of mitochondria as indicated by yellow arrows in panel b. c Representative kymographs of mitochondria, lysosomes, and autophagosomes from dendrites in panel a. The yellow arrows point to loss of mitochondrial fluorescent signal, deemed mitophagy events. The red arrow indicates no decrease in mitochondrial signal, despite LAMP1 and LC3 signal, indicating an incomplete mitophagy event. d Detail of an autolysosome engulfing a fragment of mitochondria (135′) following a mitochondrial fission event (105′−120′). e The percentage of dendritic segments showing accumulation of both LC3 + autophagosomes, LAMP1 + lysosomes, or LC3-LAMP1 double-positive autolysosomes. Data are represented by box plots displaying minimum to maximum values, with the box denoting 25th, 50th (median), and 75th percentiles from three independent experiments. ncontrol = 15 neurons; nAβ42o = 24 neurons. fi Quantification of f LAMP1 intensity, g LC3 intensity, and h Mitochondrial intensity for dendritic segments over the course of the 14 h following treatments. i Mitophagy index defined as the change in mitochondrial fluorescence intensity in dendritic segment with (+) or without (−) LC3-LAMP1 double-positive puncta (autophagosomes) at 14 h. In panels fi, data are represented as mean + /− SEM based on nControl = 33 dendrites; nAβ42o = 44 dendrites. Statistical significance was performed using a Mann–Whitney test. Exact P values are indicated on the figure when available through Prism software, otherwise, the test significance is provided using the following criteria: **P < 0.01; ****P < 0.0001. Scale bar = 2 μm.
Fig. 4
Fig. 4. Oligomeric Aβ42-induced synaptotoxicity and dendritic mitochondrial fragmentation is AMPK-dependent.
a Secondary dendritic segments of primary cortical PNs at 21 DIV. Embryos from AMPKα1/α2 double conditional knockout (AMPKα1F/F/α2 F/F) were ex utero electroporated at E15.5 with pCAG-mVenus, pCAG-mito-DsRed, and either scrambled pCAG-Cre (control) or pCAG-Cre recombinase. Neurons were treated at 20 DIV with either a vehicle control or Aβ42o for 24 h. bd Quantification of b mitochondria length, c mitochondrial density, and d spine density in individual dendritic segments. All of the analyses were done blind to the experimental conditions and were done by manual counting using FIJI. Data is represented by box plots displaying minimum to maximum values, with the box denoting 25th, 50th (median), and 75th percentiles from three independent experiments. nCreNegative Control = 27 dendrites, 128 mitochondria; nCreNegative Aβ42o = 29 dendrites, 204 mitochondria; nCrePositive Control = 29 dendrites, 143 mitochondria; nCrePositive Aβ42o = 24 dendrites, 112 mitochondria. Statistical significance was performed using a Mann–Whitney test. Exact P values are indicated on the figure when available through Prism software, otherwise, the test significance is provided using the following criteria: **P < 0.01; ****P < 0.0001. Scale bar = 2 μm.
Fig. 5
Fig. 5. MFF is required for Aβ42o-induced dendritic mitochondrial fragmentation and dendritic spine loss in vitro.
a Representative images of secondary dendritic segments of primary cortical PNs at 21 DIV. Embryos at E15.5 were ex utero electroporated with pCAG-mVenus, pCAG-mito-DsRed, and either with control shRNA or an shRNA specific for mouse MFF (MFF shRNA). Neurons were treated at 20 DIV with either a vehicle control or Aβ42o for 24 h. Knockdown of MFF blocks both dendritic mitochondrial fragmentation and subsequent degradation as well as dendritic spine loss. bd Quantification of dendritic mitochondrial length (b), dendritic mitochondrial density (c), and dendritic spine density (d). All of the analyses were done blind to the experimental conditions and were done by manual counting using FIJI. Data are represented by box plots displaying minimum to maximum values, with the box denoting 25th, 50th (median), and 75th percentiles from three independent experiments. npLKO Control = 36 dendrites, 188 mitochondria; npLKO Aβ42o = 41 dendrites, 300 mitochondria; nMFFshRNA Control = 36 dendrites, 167 mitochondria; nMFFshRNA Aβ42o = 30 dendrites, 125 mitochondria. Statistical analyses were performed using a Mann–Whitney test in (bd). Exact P values are indicated on the figure when available through Prism software, otherwise, the test significance is provided using the following criteria: ****P < 0.0001. Scale bar for magnified dendritic segments = 2 μm.
Fig. 6
Fig. 6. MFF is required for Aβ42o-induced dendritic mitochondrial fragmentation and spine loss in apical tufts of CA1 PNs in vivo.
a High-magnification images of dendritic segments in stratum lacunosum moleculare (SLM) of CA1 PNs of 3-months-old WT or J20 mice. CA1 PNs were co-electroporated in utero at E15.5 with plasmids expressing a cell filler (tdTomato), a mitochondrial matrix marker (mito-YFP) and either control (scrambled) shRNA or shRNA targeting mouse MFF. bd Quantification of dendritic mitochondrial length (b), dendritic mitochondrial density (c), and dendritic spine density (d). Data are represented by box plots displaying minimum to maximum values, with the box denoting 25th, 50th (median), and 75th percentiles from at least three independent in utero electroporated mice. nControl/WT = 21 dendrites, 157 mitochondria; nControl/J20Het = 22 dendrites, 327 mitochondria; nshMFF/WT = 14 dendrites, 102 mitochondria; nshMFF/J20Het = 36 dendrites, 256 mitochondria. All of the analyses were done blind to the experimental conditions and were manually counted using FIJI. Statistical analyses were performed using a Mann–Whitney test in bd. Exact P values are indicated on the figure when available through Prism software, otherwise, the test significance is provided using the following criteria: ****P < 0.0001. Scale bar for magnified dendritic segments = 2 μm.
Fig. 7
Fig. 7. Aβ42o induces AMPK-dependent MFF phosphorylation at two serine sites required for Aβ42o-dependent dendritic mitochondrial fragmentation and spine loss.
a Representative images of secondary dendritic segments of primary cortical PNs at 21 DIV. Embryos at E15.5 were ex utero electroporated with pCAG-Venus, pCAG-mito-DsRed, MFF shRNA, and low levels of either pCAG-MFF-WT cDNA or phospho-dead pCAG-MFF-AA. At 20DIV, the neurons were treated with either a vehicle control or Aβ42o for 24 h. Gene replacement with a form of MFF that cannot be phosphorylated by AMPK (MFF shRNA + MFF-AA) blocks dendritic mitochondrial fragmentation and subsequent spine loss. bd Quantification of b dendritic mitochondrial length, c dendritic mitochondrial density, and d spine density. All of the analyses were done blind to the experimental conditions and performed by manual counting using FIJI. Data are represented by box plots displaying minimum to maximum values, with the box denoting 25th, 50th (median), and 75th percentiles from three independent experiments. nMFFshRNA + MFFWT Control = 31 dendrites, 166 mitochondria; nMFFshRNA + MFFWT Aβ42o = 29 dendrites, 228 mitochondria; nMFFshRNA + MFFAA Control = 35 dendrites, 164 mitochondria; nMFFshRNA + MFFAA Aβ42o = 28 dendrites, 137 mitochondria. Statistical analyses were performed using a Mann–Whitney test in bd. Exact P values are indicated on the figure when available through Prism software, otherwise, the test significance is provided using the following criteria: ****P < 0.0001. Scale bar in a: 2 μm.
Fig. 8
Fig. 8. ULK2 acts in a concerted manner with MFF and leads to loss of mitochondrial biomass following MFF-dependent mitochondrial fragmentation.
a Representative images of secondary dendritic segments of primary cortical PNs at 21DIV. ULK2F/F embryos were ex utero electroporated at E15.5 with pCAG-Venus, pCAG-mito-DsRed, and without (-Cre) or with pCAG-Cre recombinase (+Cre). Neurons were treated at 20 DIV with either a vehicle control or Aβ42o for 24 h. Deletion of ULK2 in cortical PNs blocks Aβ42o-induced loss of dendritic spines and loss of mitochondrial biomass, but does not prevent a decrease in mitochondrial length. bd Quantification of b dendritic mitochondrial length, c dendritic mitochondrial density, and d dendritic spine density. Analyses were done blind to the experimental conditions and were done by manual counting using FIJI. Data are represented by box plots displaying minimum to maximum values, with the box denoting 25th, 50th (median), and 75th percentiles from three independent experiments. nCreNegative Control = 36 dendrites, 193 mitochondria; nCreNegative Aβ42o = 38 dendrites, 254 mitochondria; nCrePositive Control = 36 dendrites, 186 mitochondria; nCrePositive Aβ42o = 35 dendrites, 435 mitochondria. Statistical analyses were performed using a Mann–Whitney test in bd. Exact P values are indicated on the figure when available through Prism software, otherwise, the test significance is provided using the following criteria: ****P < 0.0001. Scale bar for magnified dendritic segments = 2 μm.
Fig. 9
Fig. 9. AMPK-mediated phosphorylation of ULK2 is crucial for oligomeric Aβ42-induced synaptotoxicity and loss of mitochondrial biomass.
a Schematic of ULK2 domain structure highlighting the four predicted AMPK-mediated phosphorylation sites (see Supplementary Fig. S8) conserved in ULK1 and ULK2. b Flag-mULK2 WT or Flag-mULK2 4SA (the four conserved phosphorylation sites shown in Supplementary Fig. S8b are mutated to alanine) was overexpressed in HEK293T cells co-expressing either GST or GST-ca-AMPKα1(1–312) (constitutively active AMPK). Cells were treated with DMSO or 50 μM of compound 991 for 1 h. Blots were probed with AMPK substrate motif antibody, Flag M2 monoclonal antibody, total ULK2, p-Thr172 AMPK, total AMPK, and actin antibodies. c Representative high-magnification images of secondary dendritic segments showing dendritic spines in the upper panel and mitochondria in the lower panel. ULK2F/F embryos were ex utero electroporated at E15.5 with pCAG-mVenus, pCAG-mito-DsRed, either a scrambled pCAG-Cre (Control, no Cre), or pCAG-Cre recombinase. The pCAG-Cre recombinase conditions in which ULK2 is genetically removed were also co-electroporated with either pCAG-mULK2 WT (Wild type), pCAG-mULK2 KI (K39I) (Kinase inactive), or pCAG-mULK2 4SA (Kinase dead, see Supplementary Fig. S8). Neurons were treated at 20DIV with either a vehicle control or Aβ42o for 24 h. df Quantification of d dendritic mitochondrial length, (e) dendritic mitochondrial density, and f spine density. Analyses were done blind to the experimental conditions and done by manual counting using FIJI. For western blot in panel b, the same results were obtained for three independent experiments. In panels df, data are represented by box plots displaying minimum to maximum values, with the box denoting 25th, 50th (median), and 75th percentiles from three independent experiments. nULK2WT Control = 32 dendrites, 194 mitochondria; nULK2WT Aβ42o = 30 dendrites, 289 mitochondria; nULK2KI Control = 36 dendrites, 183 mitochondria; nULK2KI Aβ42o = 34 dendrites, 449 mitochondria; nULK24SA Control = 34 dendrites, 198 mitochondria; nULK24SA Aβ42o = 32 dendrites, 472 mitochondria. Statistical analyses were performed using a Mann–Whitney test in (df). Exact P values are indicated on the figure when available through Prism software, otherwise, the test significance is provided using the following criteria: *P < 0.001; ****P < 0.0001. Scale bar for magnified dendritic segments = 2 μm.

References

    1. Sheng, M., Sabatini, B. L. & Sudhof, T. C. Synapses and Alzheimer’s disease. Cold Spring Harb Perspect Biol4, 10.1101/cshperspect.a005777 (2012). - PMC - PubMed
    1. Mairet-Coello G, et al. The CAMKK2-AMPK kinase pathway mediates the synaptotoxic effects of Abeta oligomers through Tau phosphorylation. Neuron. 2013;78:94–108. doi: 10.1016/j.neuron.2013.02.003. - DOI - PMC - PubMed
    1. Masliah E, et al. Altered expression of synaptic proteins occurs early during progression of Alzheimer’s disease. Neurology. 2001;56:127–129. doi: 10.1212/WNL.56.1.127. - DOI - PubMed
    1. Moolman DL, Vitolo OV, Vonsattel JP, Shelanski ML. Dendrite and dendritic spine alterations in Alzheimer models. J. Neurocytol. 2004;33:377–387. doi: 10.1023/B:NEUR.0000044197.83514.64. - DOI - PubMed
    1. Shankar GM, et al. Natural oligomers of the Alzheimer amyloid-beta protein induce reversible synapse loss by modulating an NMDA-type glutamate receptor-dependent signaling pathway. J. Neurosci. 2007;27:2866–2875. doi: 10.1523/JNEUROSCI.4970-06.2007. - DOI - PMC - PubMed

Publication types

MeSH terms

Substances