
The United States COVID-19 Forecast Hub dataset

Estee Y Cramer et al. Sci Data. .

Abstract

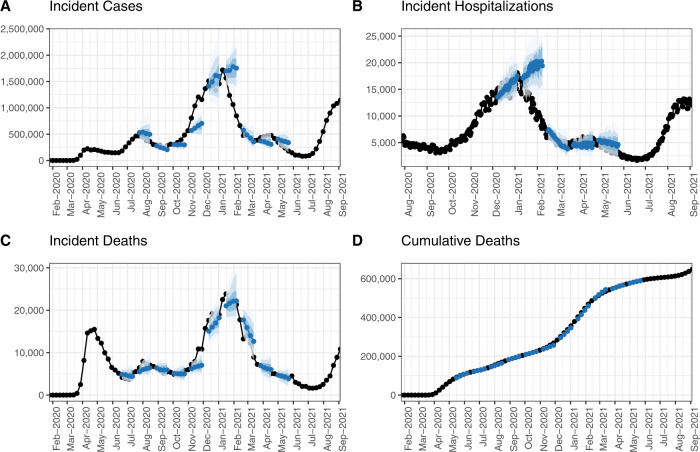
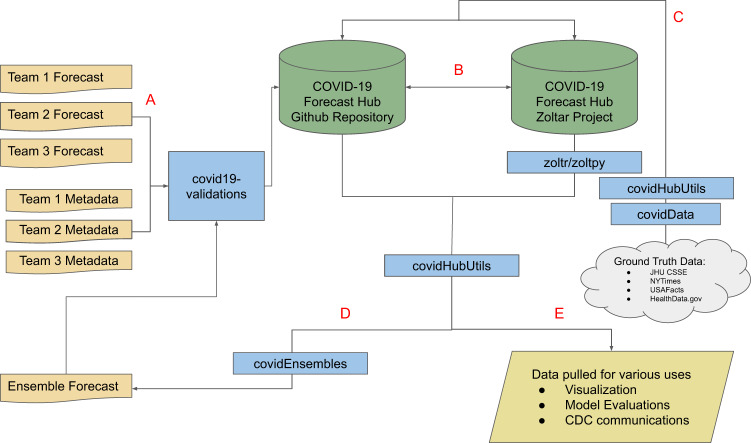
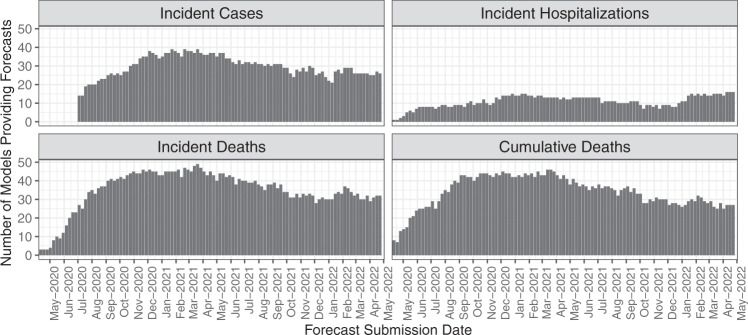
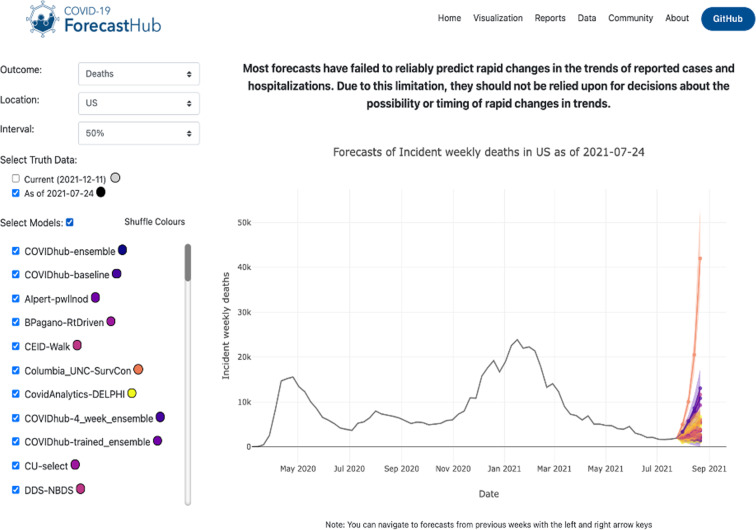
Academic researchers, government agencies, industry groups, and individuals have produced forecasts at an unprecedented scale during the COVID-19 pandemic. To leverage these forecasts, the United States Centers for Disease Control and Prevention (CDC) partnered with an academic research lab at the University of Massachusetts Amherst to create the US COVID-19 Forecast Hub. Launched in April 2020, the Forecast Hub is a dataset with point and probabilistic forecasts of incident cases, incident hospitalizations, incident deaths, and cumulative deaths due to COVID-19 at county, state, and national, levels in the United States. Included forecasts represent a variety of modeling approaches, data sources, and assumptions regarding the spread of COVID-19. The goal of this dataset is to establish a standardized and comparable set of short-term forecasts from modeling teams. These data can be used to develop ensemble models, communicate forecasts to the public, create visualizations, compare models, and inform policies regarding COVID-19 mitigation. These open-source data are available via download from GitHub, through an online API, and through R packages.


Conflict of interest statement

AV, MC, and APP report grants from Metabiota Inc outside the submitted work.

Figures

Fig. 1
Fig. 1
Time series of weekly incident deaths at the national level and forecasts from the COVID-19 Forecast Hub ensemble model for selected weeks in 2020 and 2021. Ensemble forecasts (blue) with 50%, 80% and 95% prediction intervals shown in shaded regions and the ground-truth data (black) for incident cases (A), incident hospitalizations (B), incident deaths (C) and cumulative deaths (D). The truth data come from JHU CSSE (panels A, C, D) and HealthData.gov (panel B).
Fig. 2
Fig. 2
Schematic of the data storage and related infrastructure surrounding the COVID-19 Forecast Hub. (A) Forecasts are submitted to the COVID-19 Forecast Hub GitHub repository and undergo data format validation before being accepted into the system. (B) A continuous integration service ensures that the GitHub repository and PostgreSQL database stay in sync with mirrored versions of the data. (C) Truth data for visualization, evaluation, and ensemble building are retrieved once per week using both the covidHubUtils and the covidData R packages. Truth data are stored in both repositories. (D) Once per week, an ensemble forecast submission is made using the covidEnsembles R package. It is submitted to the GitHub repository and undergoes the same validation as other submissions. (E) Using the covidHubUtils R package, forecast and truth data may be extracted from either the GitHub or PostgreSQL database in a standard format for tasks such as scoring or plotting.
Fig. 3
Fig. 3
Number of primary forecasts submitted for each outcome per week from April 27th, 2020 through May 3rd, 2022. In the initial weeks of submission, fewer than 10 models provided forecasts. Over time, the number of teams submitting forecasts for each forecasted outcome increased into early 2021 and then saw a small decline through the end of 2021, with some renewed interest in 2022.
Fig. 4
Fig. 4
Visualization tool updated weekly by the US COVID-19 Forecast Hub displays model forecasts and truth data at selected forecast dates, locations, forecast outcomes and PI levels. US national level incident death forecasts from 39 models are shown with point values and a 50% PI. These forecasts are for 1 through 4 week ahead horizons. Data used for forecasting were generated on July 24th, 2021. The visualization tool is available at: https://viz.covid19forecasthub.org.

Similar articles

  • Responding to the Return of Influenza in the United States by Applying Centers for Disease Control and Prevention Surveillance, Analysis, and Modeling to Inform Understanding of Seasonal Influenza.
    Borchering RK, Biggerstaff M, Brammer L, Budd A, Garg S, Fry AM, Iuliano AD, Reed C. Borchering RK, et al. JMIR Public Health Surveill. 2024 Apr 8;10:e54340. doi: 10.2196/54340. JMIR Public Health Surveill. 2024. PMID: 38587882 Free PMC article. Review.
  • Predictive performance of multi-model ensemble forecasts of COVID-19 across European nations.
    Sherratt K, Gruson H, Grah R, Johnson H, Niehus R, Prasse B, Sandmann F, Deuschel J, Wolffram D, Abbott S, Ullrich A, Gibson G, Ray EL, Reich NG, Sheldon D, Wang Y, Wattanachit N, Wang L, Trnka J, Obozinski G, Sun T, Thanou D, Pottier L, Krymova E, Meinke JH, Barbarossa MV, Leithauser N, Mohring J, Schneider J, Wlazlo J, Fuhrmann J, Lange B, Rodiah I, Baccam P, Gurung H, Stage S, Suchoski B, Budzinski J, Walraven R, Villanueva I, Tucek V, Smid M, Zajicek M, Perez Alvarez C, Reina B, Bosse NI, Meakin SR, Castro L, Fairchild G, Michaud I, Osthus D, Alaimo Di Loro P, Maruotti A, Eclerova V, Kraus A, Kraus D, Pribylova L, Dimitris B, Li ML, Saksham S, Dehning J, Mohr S, Priesemann V, Redlarski G, Bejar B, Ardenghi G, Parolini N, Ziarelli G, Bock W, Heyder S, Hotz T, Singh DE, Guzman-Merino M, Aznarte JL, Morina D, Alonso S, Alvarez E, Lopez D, Prats C, Burgard JP, Rodloff A, Zimmermann T, Kuhlmann A, Zibert J, Pennoni F, Divino F, Catala M, Lovison G, Giudici P, Tarantino B, Bartolucci F, Jona Lasinio G, Mingione M, Farcomeni A, Srivastava A, Montero-Manso P, Adiga A, Hurt B, Lewis B, Marathe M, Porebski P, Venkatramanan S, Bartczuk RP, Dreger F, Gambin A, Gogolewski K, Gruziel-Slomka… See abstract for full author list ➔ Sherratt K, et al. Elife. 2023 Apr 21;12:e81916. doi: 10.7554/eLife.81916. Elife. 2023. PMID: 37083521 Free PMC article.
  • Challenges of COVID-19 Case Forecasting in the US, 2020-2021.
    Lopez VK, Cramer EY, Pagano R, Drake JM, O'Dea EB, Adee M, Ayer T, Chhatwal J, Dalgic OO, Ladd MA, Linas BP, Mueller PP, Xiao J, Bracher J, Castro Rivadeneira AJ, Gerding A, Gneiting T, Huang Y, Jayawardena D, Kanji AH, Le K, Mühlemann A, Niemi J, Ray EL, Stark A, Wang Y, Wattanachit N, Zorn MW, Pei S, Shaman J, Yamana TK, Tarasewicz SR, Wilson DJ, Baccam S, Gurung H, Stage S, Suchoski B, Gao L, Gu Z, Kim M, Li X, Wang G, Wang L, Wang Y, Yu S, Gardner L, Jindal S, Marshall M, Nixon K, Dent J, Hill AL, Kaminsky J, Lee EC, Lemaitre JC, Lessler J, Smith CP, Truelove S, Kinsey M, Mullany LC, Rainwater-Lovett K, Shin L, Tallaksen K, Wilson S, Karlen D, Castro L, Fairchild G, Michaud I, Osthus D, Bian J, Cao W, Gao Z, Lavista Ferres J, Li C, Liu TY, Xie X, Zhang S, Zheng S, Chinazzi M, Davis JT, Mu K, Pastore Y Piontti A, Vespignani A, Xiong X, Walraven R, Chen J, Gu Q, Wang L, Xu P, Zhang W, Zou D, Gibson GC, Sheldon D, Srivastava A, Adiga A, Hurt B, Kaur G, Lewis B, Marathe M, Peddireddy AS, Porebski P, Venkatramanan S, Wang L, Prasad PV, Walker JW, Webber AE, Slayton RB, Biggerstaff M, Reich NG, Johansson MA. Lopez VK, et al. PLoS Comput Biol. 2024 May 6;20(5):e1011200. doi: 10.1371/journal.pcbi.1011200. eCollection 2024 May. PLoS Comput Biol. 2024. PMID: 38709852 Free PMC article.
  • Short-Range Forecasting of COVID-19 During Early Onset at County, Health District, and State Geographic Levels Using Seven Methods: Comparative Forecasting Study.
    Lynch CJ, Gore R. Lynch CJ, et al. J Med Internet Res. 2021 Mar 23;23(3):e24925. doi: 10.2196/24925. J Med Internet Res. 2021. PMID: 33621186 Free PMC article.
  • Tracking COVID-19 in the United States With Surveillance of Aggregate Cases and Deaths.
    Khan D, Park M, Burkholder J, Dumbuya S, Ritchey MD, Yoon P, Galante A, Duva JL, Freeman J, Duck W, Soroka S, Bottichio L, Wellman M, Lerma S, Lyons BC, Dee D, Haile S, Gaughan DM, Langer A, Gundlapalli AV, Suthar AB. Khan D, et al. Public Health Rep. 2023 May-Jun;138(3):428-437. doi: 10.1177/00333549231163531. Epub 2023 Mar 24. Public Health Rep. 2023. PMID: 36960828 Free PMC article. Review.

Cited by

References

    1. Haghani M, Bliemer MCJ. Covid-19 pandemic and the unprecedented mobilisation of scholarly efforts prompted by a health crisis: Scientometric comparisons across SARS, MERS and 2019-nCoV literature. Scientometrics. 2020;125:2695–2726. doi: 10.1007/s11192-020-03706-z. - DOI - PMC - PubMed
    1. Cramer EY, et al. Evaluation of individual and ensemble probabilistic forecasts of COVID-19 mortality in the United States. Proc. Natl. Acad. Sci. U. S. A. 2022;119:e2113561119. doi: 10.1073/pnas.2113561119. - DOI - PMC - PubMed
    1. Brooks, L. C. et al. Comparing ensemble approaches for short-term probabilistic COVID-19 forecasts in the U.S. International Institute of Forecasters (2020).
    1. Ray, E. L. et al. Comparing trained and untrained probabilistic ensemble forecasts of COVID-19 cases and deaths in the United States. arXiv [stat.ME] (2022). - PMC - PubMed
    1. Taylor, J. W. & Taylor, K. S. Combining Probabilistic Forecasts of COVID-19 Mortality in the United States. Eur. J. Oper. Res. 10.1016/j.ejor.2021.06.044 (2021). - PMC - PubMed