. 2022 Aug 1;13(1):4448.
doi: 10.1038/s41467-022-32175-6.

Frequency wavelength multiplexed optoacoustic tomography

Affiliations

Frequency wavelength multiplexed optoacoustic tomography

Antonios Stylogiannis et al. Nat Commun. .

Abstract

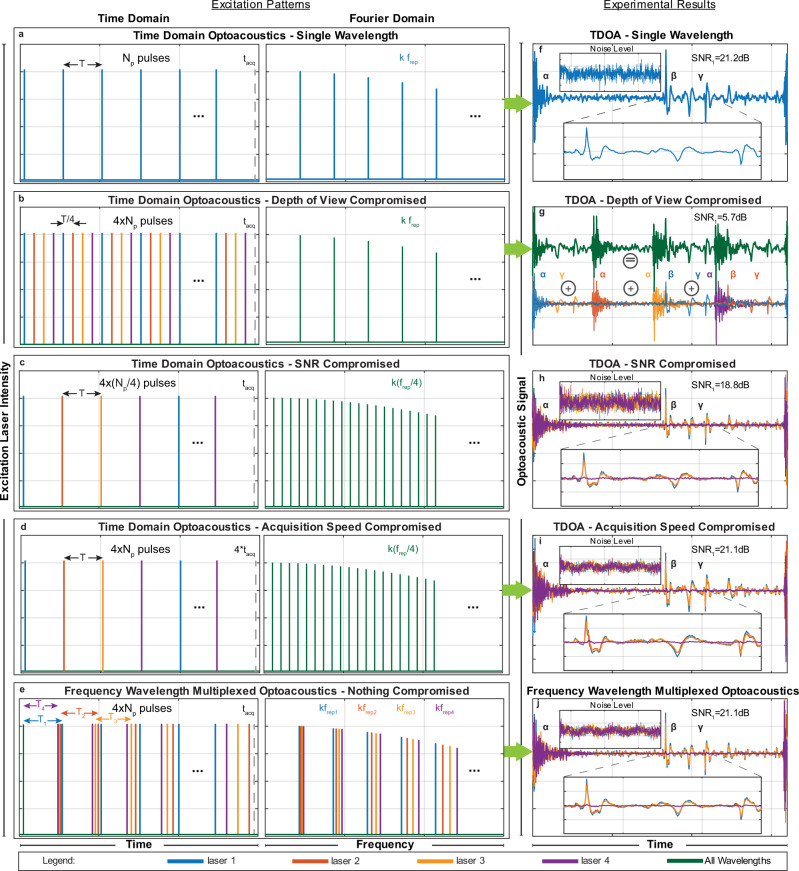
Optoacoustics (OA) is overwhelmingly implemented in the Time Domain (TD) to achieve high signal-to-noise ratios by maximizing the excitation light energy transient. Implementations in the Frequency Domain (FD) have been proposed, but suffer from low signal-to-noise ratios and have not offered competitive advantages over time domain methods to reach high dissemination. It is therefore commonly believed that TD is the optimal way to perform optoacoustics. Here we introduce an optoacoustic concept based on pulse train illumination and frequency domain multiplexing and theoretically demonstrate the superior merits of the approach compared to the time domain. Then, using recent advances in laser diode illumination, we launch Frequency Wavelength Multiplexing Optoacoustic Tomography (FWMOT), at multiple wavelengths, and experimentally showcase how FWMOT optimizes the signal-to-noise ratios of spectral measurements over time-domain methods in phantoms and in vivo. We further find that FWMOT offers the fastest multi-spectral operation ever demonstrated in optoacoustics.


Conflict of interest statement

V.N. is a founder and equity owner of sThesis GmbH, iThera Medical GmbH, Spear UG, and i3 Inc. The remaining authors have no competing interests.

Figures

Fig. 1
Fig. 1. The signal processing algorithms used in Frequency Wavelength Multiplexed Optoacoustics at a single wavelength.
a A single excitation light pulse of tp duration in TD (left) and a continuous spectrum of frequencies in FD (right). b A sine wave of frequency f in TD and FD, continuous wave in TD and a single discrete peak in FD. c A train of pulses with pulse duration tp and repetition rate frep in TD and FD. Many discrete pulses in TD and many discrete frequencies in FD with the same envelope as a single pulse of tp duration in a. d A train of pulses with pulse duration tp and repetition rate 2frep in TD and FD. Twice as many pulses in TD but half the number of discrete frequencies in FD compared to c. e A train of pulses with pulse duration 2tp and repetition rate 2frep in TD and FD. As many pulses in TD and discrete frequencies in FD as in d but now following a different envelope than (a) or (c). f The raw optoacoustic signal recorded using a pulse train like (c) for example with 1, 2, 3 and … indicating the different periods. g, h present the normal averaging in TD. g The train of pulses is split in sections of period T = 1/frep, indicated by 1, 2, 3 and … which are averaged (h) point by point. i, j The Frequency Wavelength Multiplexed processing of the same signal. i The Fourier transform of the raw optoacoustic signal (f) with many discrete frequencies that are all harmonics (k * frep with k positive integer) of the base repetition rate frep. In FD we choose only the harmonics of frep and discard all the other frequencies that contain only noise (j). k By performing the inverse Fourier Transform in j we recover the TD signal that matches perfectly with the one in h.
Fig. 2
Fig. 2. Frequency wavelength multiplexed optoacoustic tomography (FWMOT) advantages at multiple wavelengths.
a A pulse train of one wavelength with period T and repetition rate frep = 1/T, with Np pulses and acquisition time tacq in time domain (TD, left) and Fourier domain (right), with k frep the harmonics of frep with k an integer. bd Multiple wavelength excitation in TD Optoacoustic (OA). b The excitation pattern of 4 wavelengths emitting at the same repetition rate frep with a time shift T/4, Np pulses for all wavelengths and tacq acquisition time. c The excitation pattern of 4 wavelengths with frep/4 repetition rate, Np/4 pulses for each wavelength and tacq acquisition time. d The excitation pattern of four wavelengths with frep/4 repetition rate, Np pulses per wavelength but with 4tacq acquisition time. e FWMOT excitation where all four wavelengths have different repetition rates frep,1, frep,2, frep,3, frep,4, Np pulses for each wavelength and tacq acquisition time. fj The OA signal recorded by a black varnish layer on a petri dish from the excitation patterns in (ae) respectively. The signal-to-noise ratio (SNR) and noise level are inset for all cases. f α, the electromagnetic interference from the laser diode circuitry when triggered, β the OA signal from the black varnish, γ the reflection of the OA signal in the petri dish or in the acoustic lens of the Ultrasound Transducer. g The OA signal from the excitation pattern b for all wavelengths (top line) is the sum of the OA signal from each wavelength (bottom line), with drastically reduced Depth-of-View (DoV) for each wavelength. The laser interference, OA signal and its reflections (α, β, γ) for each wavelength are indicated. h The OA signal at each wavelength has reduced SNR. i The OA signal has the same SNR but with increased acquisition time. j Signal from all four wavelengths has been recovered without any cross-talk between the lasers and correctly co-registered in time without compromising DoV, SNR or acquisition time. Blue, red, orange, purple, and green are used to indicate laser 1, laser 2, laser 3, and laser 4, respectively.
Fig. 3
Fig. 3. In vivo imaging using FWMOT.
a and b A mouse ear at the two blue wavelengths, 445 and 465 nm respectively, with high spatial resolution. c The composite image color coded with red indicating higher oxygenation levels compared to green. d, e,  fg A second mouse ear at all four wavelengths. h A bright-field image of the mouse ear. Intradermal injection spots of Evan’s Blue and ICG can be seen in images (f, g, h). fg The injected dyes enter the lymphatic vessels that present a different structure than blood vessels. i The composite image of all four wavelengths. We can observe oxygenated (red), de-oxygenated (green) blood vessels and lymphatic vessels after uptake of Evan’s Blue (cyan) and ICG (purple) at the same time. These experiments were repeated ten times independently with similar results. All images are maximum amplitude projections of reconstructed images. Green is 445 nm, red is 465 nm, cyan is 638 nm, purple is 808 nm, scale bar 1 mm.
Fig. 4
Fig. 4. In vivo vascular dynamics revealed by FWMOT. Oxygen challenge experiment and dye injection monitoring in the central vein and artery in the mouse ear using FWMOT imaging.
a The OA images in the blue wavelengths, showing oxygenated (red) and de-oxygenated (green) vessels. We performed continuously B-Scans on the blue region denoted in a and ‘i’ shows such a cross-section. The green arrow and region in ‘i’ indicate the selected vein, and the red arrow and region indicate the selected artery. Green is 445 nm, red is 465 nm, scale bar 1 mm. b The changes in the ratio between the OA signal intensity in wavelength 2 (S2) to that of wavelength 1 (S1) in time during an oxygen stress test. The oxygen saturation is proportional to the ratio S2/S1. The oxygen saturation changes faster in the artery than in the vein, as expected. c The oxygen extraction rate during the same experiment. d The signal intensity at wavelengths 3 and 4 (S3 and S4 respectively) at the same artery and vein indicated in a during intravascular injection of the two dyes, Evan’s Blue and ICG. In both cases the signal intensity increases first in the artery and later in the vein. These experiments were repeated three time independently with similar results.
Fig. 5
Fig. 5. Multispectral Raster Scanning Optoacoustic Mesoscopy system using four laser diodes.
a The schematic of the system developed showing the electrical and optical connections of the different parts of the system. b The laser diode illumination system. Each laser diode is attached to a separate laser diode driver and focused into a multimode fiber with a 2-lens system. The four laser diodes are coupled in a 4 × 4 fiber power combiner and each output of the combiner has ~25% of the power of each input, combining all the wavelengths. c The scanning head of the RSOM system consisting of the xy scanning stages (i), the 3D printed holder (ii), the Ultrasound Transducer (iii) and the four output fibers of the fiber power combiner (iv) arranged in a circular pattern around the UST. Image components adapted with permission from the copyright holders; the optomechanical components in b are retrieved from Thorlabs Inc. and the scanning stages (U-723 XY) in c from Physik Instrumente GmbH (https://www.physikinstrumente.com/en/products/xy-stages/u-723-piline-xy-stage-1000583/#downloads).

Similar articles

Cited by

References

    1. Ntziachristos V. Going deeper than microscopy: the optical imaging frontier in biology. Nat. Methods. 2010;7:603–614. doi: 10.1038/nmeth.1483. - DOI - PubMed
    1. Xu, M. & Wang, L. V. Photoacoustic imaging in biomedicine. Rev. Sci. Instrum. 77, 041101 (2006).
    1. Diebold GJ, Sun T, Khan MI. Photoacoustic monopole radiation in one, two, and three dimensions. Phys. Rev. Lett. 1991;67:3384–3387. doi: 10.1103/PhysRevLett.67.3384. - DOI - PubMed
    1. Calasso IG, Craig W, Diebold GJ. Photoacoustic point source. Phys. Rev. Lett. 2001;86:3550–3553. doi: 10.1103/PhysRevLett.86.3550. - DOI - PubMed
    1. Taruttis A, Ntziachristos V. Advances in real-time multispectral optoacoustic imaging and its applications. Nat. Photonics. 2015;9:219–227. doi: 10.1038/nphoton.2015.29. - DOI

Publication types