. 2022 Sep;6(9):1307-1317.
doi: 10.1038/s41559-022-01833-9. Epub 2022 Aug 1.

The role of mitochondrial energetics in the origin and diversification of eukaryotes

Affiliations

The role of mitochondrial energetics in the origin and diversification of eukaryotes

Paul E Schavemaker et al. Nat Ecol Evol. 2022 Sep.

Abstract

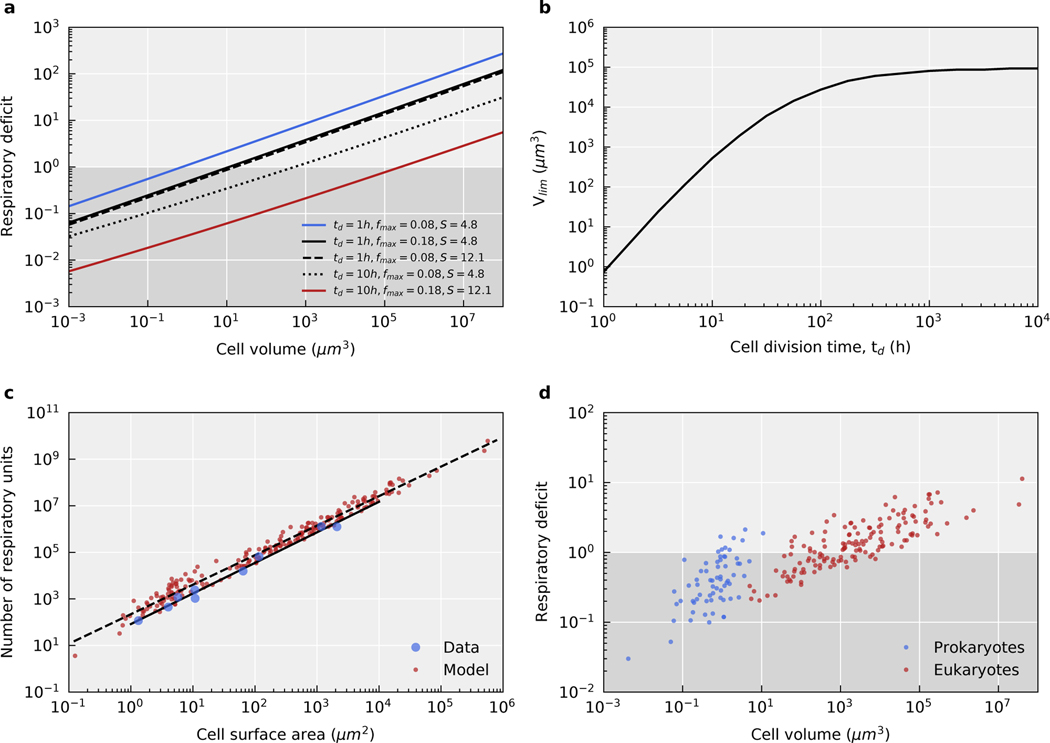
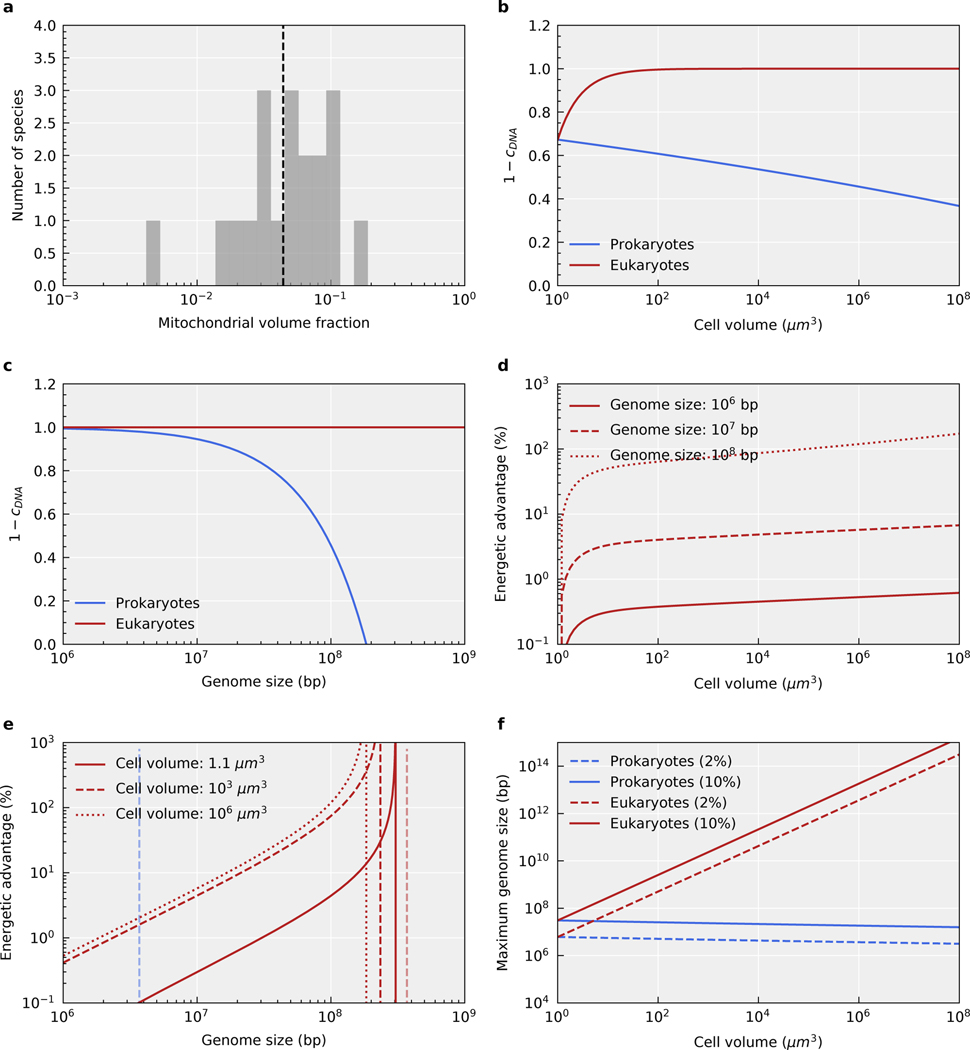
The origin of eukaryotic cell size and complexity is often thought to have required an energy excess supplied by mitochondria. Recent observations show energy demands to scale continuously with cell volume, suggesting that eukaryotes do not have higher energetic capacity. However, respiratory membrane area scales superlinearly with the cell surface area. Furthermore, the consequences of the contrasting genomic architectures between prokaryotes and eukaryotes have not been precisely quantified. Here, we investigated (1) the factors that affect the volumes at which prokaryotes become surface area-constrained, (2) the amount of energy divested to DNA due to contrasting genomic architectures and (3) the costs and benefits of respiring symbionts. Our analyses suggest that prokaryotes are not surface area-constrained at volumes of 100‒103 µm3, the genomic architecture of extant eukaryotes is only slightly advantageous at genomes sizes of 106‒107 base pairs and a larger host cell may have derived a greater advantage (lower cost) from harbouring ATP-producing symbionts. This suggests that eukaryotes first evolved without the need for mitochondria since these ranges hypothetically encompass the last eukaryotic common ancestor and its relatives. Our analyses also show that larger and faster-dividing prokaryotes would have a shortage of respiratory membrane area and divest more energy into DNA. Thus, we argue that although mitochondria may not have been required by the first eukaryotes, eukaryote diversification was ultimately dependent on mitochondria.


Conflict of interest statement

Competing Interests Statement

The authors declare no competing interests.

Figures

Extended Data Fig. 1
Extended Data Fig. 1. Comparing the results of metabolic rate calculations to data.
The blue points are empirically determined metabolic rates for various prokaryotic and eukaryotic species, obtained from Chiyomaru and Takemoto (2020) (units were converted by assuming that 1 mol ATP releases 50 kJ of energy). The red points are metabolic rates calculated with: R=fdαV0.97/td+βV0.88, with the values for cell volumes and cell division times, for both prokaryotes and eukaryotes, obtained from Lynch and Marinov (2015). The solid line is a fit to the data: y = 2.0 × 105 x1, and the dashed line is a fit to the calculated points: y = 4.4 × 105 x0.85.
Extended Data Fig. 2
Extended Data Fig. 2. The shape factor (S) as a function of the ratio between cell length and width.
When this ratio is one, the cell is a sphere, and when this ratio is < 1 or >1, the cell is flattened into an oblate or prolate spheroid, respectively. The shape factor is calculated from Eq. S17.
Extended Data Fig. 3
Extended Data Fig. 3. Prediction of the mitochondrial inner membrane surface area.
a. The inner mitochondrial surface area as a function of cell surface area. Empirically determined inner mitochondrial membrane areas were obtained from Lynch and Marinov (2017) (blue points). The inner mitochondrial membrane area was calculated (red points) with: (fdαV0.97/td+βV0.88)/r·Ar×2.5, using cell volumes and cell division times for eukaryotic species obtained from Lynch and Marinov (2015). The factor 2.5 was included to account for the lipids that support the membrane (Lindén et al., 2012). Note that for the calculation it is assumed that the inner mitochondrial membrane only houses respiratory proteins. The solid line is a fit to the data: y = 0.40 x1.30. The dashed line is a fit to the model: y = 0.030 x1.32. Here, the value of Ar is the one for E. coli, which is listed in Table S1. b. As for A except that the value of Ar used for the model calculations, which is dependent on both cross-sectional surface areas and stoichiometries of respiratory enzymes, is taken from a eukaryote (bovine) (Schlame, 2021), yielding a closer correspondence between data and model.
Extended Data Fig. 4
Extended Data Fig. 4. The effect of varying mitochondrial genome copy number, mitochondrial genome size, and cell division times on the eukaryotic advantage over prokaryotes.
Plots are generated from Eq. 4–6 with Vgserv = 1 μm3 and fmt = 0.044. a, b. Varying mitochondrial genome number and size. For the blue lines, LmtDNA= 104 bp and nmtDNA= 1 per μm3 of mitochondrial volume. For the red lines LmtDNA= 7×10⁴ bp and nmtDNA= 100 per μm3 of mitochondrial volume. Cell division time, td = 0. In some cases, red and blue overlap. a. For the dotted lines Lprok=Leuk= 108, for the dashed lines Lprok=Leuk= 107, and for the solid lines Lprok=Leuk= 106. b. For the dotted lines V = 106 μm3, for the dashed lines V = 103 μm3, and for the solid lines V = 1.1 μm3. c, d. Varying cell division time, td. For all lines LmtDNA = 104 bp and nmtDNA = 1 per μm3. For the blue lines td = 0, for the red lines td = 10 h, and for the black lines td = 100 h. c. For the dotted lines Lprok=Leuk= 108, for the dashed lines Lprok=Leuk= 107, and for the solid lines Lprok=Leuk= 106. d. For the dotted lines V = 106 μm3, for the dashed lines V = 103 μm3, and for the solid lines V = 1.1 μm3.
Extended Data Fig. 5
Extended Data Fig. 5. The amount of cellular ATP that remains after DNA synthesis in prokaryotes and either modern or ancestral eukaryotes.
Plots are generated from Eq. 5 and 7 with Vgserv= 1 μm3, Lprok= 107 bp, and fmt=0.3. a. Amount of ATP left after DNA synthesis for prokaryotes and modern eukaryotes with a small mitochondrial genome size (LmtDNA= 7×10⁴ bp) and volume fraction (fmt=0.044), a main (nuclear) genome that does not scale with cell volume, and a low mitochondrial genome copy number per unit volume (nmtDNA= 1). b. As above but with nmtDNA= 10. c. Amount of ATP left after DNA synthesis for prokaryotes and ancestral proto-eukaryotes with a large mitochondrial genome size (LmtDNA= 107 bp) and volume fraction (fmt=0.3), a main (nuclear) genome that does not scale with cell volume, and a low mitochondrial genome copy number per unit volume (nmtDNA= 1); this model and parameter set best reflect an ancestral eukaryote as predicted by some mitochondrion-late scenarios. d. As above but with nmtDNA= 3. e. Amount of ATP left after DNA synthesis for prokaryotes and ancestral eukaryotes with a large mitochondrial genome size (LmtDNA= 107 bp) and volume fraction (fmt=0.3), a main genome size that scales with cell volume, and a low mitochondrial genome copy number per unit volume (nmtDNA= 1); this model and parameter set best reflect an ancestral eukaryotes as predicted by mitochondrion-early scenarios. f. As above but with nmtDNA= 3.
Figure 1.
Figure 1.. Three different possibilities for the energetic scaling across cell volume for prokaryotes and eukaryotes.
a. A hypothetical discontinuity in the scaling of cell energy with volume between prokaryotes and eukaryotes, where the latter exhibit a higher energetic capacity or energy density due to mitochondria. The magnitude of the energetic gap shown serves an illustrative purpose only. b. A hypothetical scaling in the absence of surface constraints to prokaryotic cell volume where the energetic capacity of prokaryotes accompanies that of eukaryotes over the full cell volume range. c. A continuous scaling of cell energy with volume over the prokaryote-eukaryote divide based on data presented by Lynch and Marinov and Chiyomaru and Takemoto . Unlike in B, the cell volume of prokaryotes is constrained. This constraint may be caused by the lack of a cytoskeleton, endomembrane system, or mitochondrion-based respiration.
Figure 2.
Figure 2.. Cell volumes, genome sizes, and gene numbers for prokaryotes and eukaryotes.
Cell volumes for diverse eukaryotes were obtained from and additional data were added from several sources (see Dataset S1). Genome sizes and gene numbers were acquired from NCBI GenBank and manually curated to remove outliers due to gene mis annotations. The vertical dashed lines show medians. Total cell volumes, instead of energy-demanding active cytoplasmic volume, were used for giant prokaryotes (>102 μm3).
Figure 3.
Figure 3.. Factors that affect the volumes at which mitochondrion-less cells become constrained by their surface.
a. The respiratory deficit as a function of cell volume. The blue line reflects cells that have a cell division time (td) of 1 h, a maximum membrane occupancy of respiratory proteins (fmax) of 8%, and a shape factor (S) of 4.8. The black lines reflect cells for which a single parameter, either td,fmax, or S, has been changed (see inset). The red line reflects cells for which all parameters have been simultaneously changed. The dark grey area indicates the domain in which there is enough surface area for respiration to support cell volumes. The intersection between each line (a defined set of parameters; see inset) and a respiratory deficit of one determines the maximum volumes that cells can achieve. b. The surface area-limited cell volume, Vlim, plotted as a function of the cell division time. Here, fold deficit = 1, fmax = 8% and S = 4.8. c. The number of respiratory units (or ATP synthases) as a function of cell surface area. Empirically determined numbers of respiratory units (represented by ATP synthases) and cell surface areas, for prokaryotic and eukaryotic species, were obtained from (blue points). The number of respiratory units was calculated (red points) using: (fdαV0.97/td+βV0.88)/r, with the cell volumes and cell division times, for a range of prokaryotic and eukaryotic species, obtained from . The solid line is a fit to the data: y = 83 x1.31. The dashed line is a fit to the model: y = 221 x1.27. d. Respiratory deficit calculated for individual prokaryotic and eukaryotic species whose cell volumes and cell division times have been previously estimated . Here, fmax = 8% and S = 4.8 (spherical cells).
Figure 4.
Figure 4.. Graphical representation of contrasting genomic architectures in prokaryotes and eukaryotes (Eq. 4 and see main text for an explanation of parameters).
a. The genomic symmetry of prokaryotes. We have represented a large prokaryotic cell as a shell of cytoplasm surrounding a large inert central space, as seen in giant bacteria like Epulopiscium and Thiomargarita. Even though this cell architecture is irrelevant for our calculations (Eq. 5) as only the number of genomes is considered (filled black circles), prokaryotic cells have to scale up in cell volume with such an architecture to remain viable in the absence of an active intracellular transport network . The total number of genomes Nprok is a function of the ratio of the cell volume and the volume controlled by a single genome (i.e., V/Vgserv; see Eq. 5). b. The genomic asymmetry of eukaryotes. The dashed circles hypothetically represent the amount of volume that can be energetically supported by mitochondria. Because of cristae (expanded internalized respiratory membranes), mitochondria can, in principle, energetically support large cytoplasmic volumes. The total number of mitochondrial genomes NmtDNA is a function of the total volume of mitochondria and the number of mtDNA molecules per μm3 of mitochondrial volume (nmtDNAfmtV; see Eq. 6 and main text) .
Figure 5.
Figure 5.. The impact of genomic architecture on energy allocation in cells.
a. Distribution of mitochondrial volume fractions across a sample of phylogenetically diverse eukaryotes. The vertical dashed line indicates the geometric mean, 0.044 or 4.4% (Table S3). b. The relative cell energy budget available for cellular features other than DNA as a function of cell volume. The plot was calculated with Eq. 5 and 6 and Leuk = Lprok = 108 bp, LmtDNA = 70 Kbp, nmtDNA = 10, td = 10 h, and Vgserv = 1 μm3 (these values were also used for C-F). c. The relative cell energy budget available for cellular features other than DNA as a function of genome size. The plot was calculated with Eq. 5 and 6 and V = 106 μm3. d. The energetic advantage of eukaryotes over prokaryotes (red lines) as a function of cell volume. The plot was calculated with Eq. 4 and three different genome sizes as shown in inset. e. The energetic advantage of eukaryotes over prokaryotes (red lines) as a function of genome size. The vertical red lines denote the genome sizes at which the entire ATP budget of a prokaryote is devoted to DNA synthesis (1cDNA,prok=0). The plot was calculated with Eq. 4 and three different cell volumes as shown in inset. The transparent blue and red dashed lines show the median genome sizes for prokaryotes and eukaryotes. f. The maximum (main) genome size as a function of cell volume for prokaryotes and eukaryotes, for maximum DNA investments of 2 and 10 % of the entire cell energy budget. The plot was calculated with Eq. 5 and 6.
Figure 6.
Figure 6.. Costs and benefits of harboring ATP-exporting respiring symbionts.
Relationship between maximum cell volume and symbiont population cost for different symbiont population sizes at several cell division times. The plot was generated from Eq. 8–11. Solid lines, Vsym= 1 μm3; dashed lines, Vsym= 0.25 μm3. Vertical dotted lines show the host cell volumes in the absence of a symbiont population. The colors indicate the cell division time: 1 h (blue), 2 h (orange), 4 h (gold), and 8 h (purple). For all the colored lines the cell division time, td, is constant and the number of symbionts, Nsym, is varied. The numbers above the solid blue line indicate the number of symbionts. For the black lines Nsym= 1 and td is varied from 1–8 h.

Similar articles

Cited by

References

    1. Cavalier-Smith T. The Neomuran Revolution and Phagotrophic Origin of Eukaryotes and Cilia in the Light of Intracellular Coevolution and a Revised Tree of Life. Cold Spring Harb Perspect Biol 6, a016006 (2014). - PMC - PubMed
    1. Stanier RY, Douderoff M. & Adelberg E. The microbial world. (Prentice-Hall, 1963).
    1. Lane N. & Martin W. The energetics of genome complexity. Nature 467, 929–934 (2010). - PubMed
    1. Martin W. & Müller M. The hydrogen hypothesis for the first eukaryote. Nature 392, 37–41 (1998). - PubMed
    1. Cavalier-Smith T. Predation and eukaryote cell origins: A coevolutionary perspective. The International Journal of Biochemistry & Cell Biology 41, 307–322 (2009). - PubMed

Publication types