. 2022 Aug;28(8):1679-1692.
doi: 10.1038/s41591-022-01891-3. Epub 2022 Aug 1.

Large-scale genome-wide association study of coronary artery disease in genetically diverse populations

Catherine Tcheandjieu #  1   2   3   4 Xiang Zhu #  5   6   7   8 Austin T Hilliard #  5 Shoa L Clarke #  5   9 Valerio Napolioni  10   11 Shining Ma  6 Kyung Min Lee  12 Huaying Fang  13 Fei Chen  14 Yingchang Lu  15 Noah L Tsao  16 Sridharan Raghavan  17   18 Satoshi Koyama  19 Bryan R Gorman  20   21 Marijana Vujkovic  22   23 Derek Klarin  5   20   24   25   26   27 Michael G Levin  22   23 Nasa Sinnott-Armstrong  5   13 Genevieve L Wojcik  28 Mary E Plomondon  29   30 Thomas M Maddox  31   32 Stephen W Waldo  29   30   33 Alexander G Bick  34 Saiju Pyarajan  20   35 Jie Huang  20   36   37 Rebecca Song  20 Yuk-Lam Ho  20 Steven Buyske  38 Charles Kooperberg  39 Jeffrey Haessler  39 Ruth J F Loos  40 Ron Do  40   41 Marie Verbanck  40   41   42 Kumardeep Chaudhary  40   41 Kari E North  43 Christy L Avery  43 Mariaelisa Graff  43 Christopher A Haiman  14 Loïc Le Marchand  44 Lynne R Wilkens  44 Joshua C Bis  45 Hampton Leonard  46   47 Botong Shen  48 Leslie A Lange  49   50   51 Ayush Giri  52   53 Ozan Dikilitas  54 Iftikhar J Kullo  54 Ian B Stanaway  55 Gail P Jarvik  56   57 Adam S Gordon  58 Scott Hebbring  59 Bahram Namjou  60   61 Kenneth M Kaufman  60 Kaoru Ito  19 Kazuyoshi Ishigaki  62 Yoichiro Kamatani  62   63 Shefali S Verma  64   65 Marylyn D Ritchie  64   65 Rachel L Kember  22   66 Aris Baras  67 Luca A Lotta  67 Regeneron Genetics CenterCARDIoGRAMplusC4D ConsortiumBiobank JapanMillion Veteran ProgramSekar Kathiresan  25   68   69   70 Elizabeth R Hauser  71   72 Donald R Miller  73   74 Jennifer S Lee  5   75 Danish Saleheen  22   76 Peter D Reaven  77   78 Kelly Cho  20   35 J Michael Gaziano  20   35 Pradeep Natarajan  25   69   79 Jennifer E Huffman  20 Benjamin F Voight  22   64   80   81 Daniel J Rader  23 Kyong-Mi Chang  22   23 Julie A Lynch  82   83 Scott M Damrauer  16   22   64 Peter W F Wilson  84   85 Hua Tang  13 Yan V Sun  86   87 Philip S Tsao  5   75   88 Christopher J O'Donnell  20   35 Themistocles L Assimes  89   90   91   92
Affiliations

Large-scale genome-wide association study of coronary artery disease in genetically diverse populations

Catherine Tcheandjieu et al. Nat Med. 2022 Aug.

Abstract

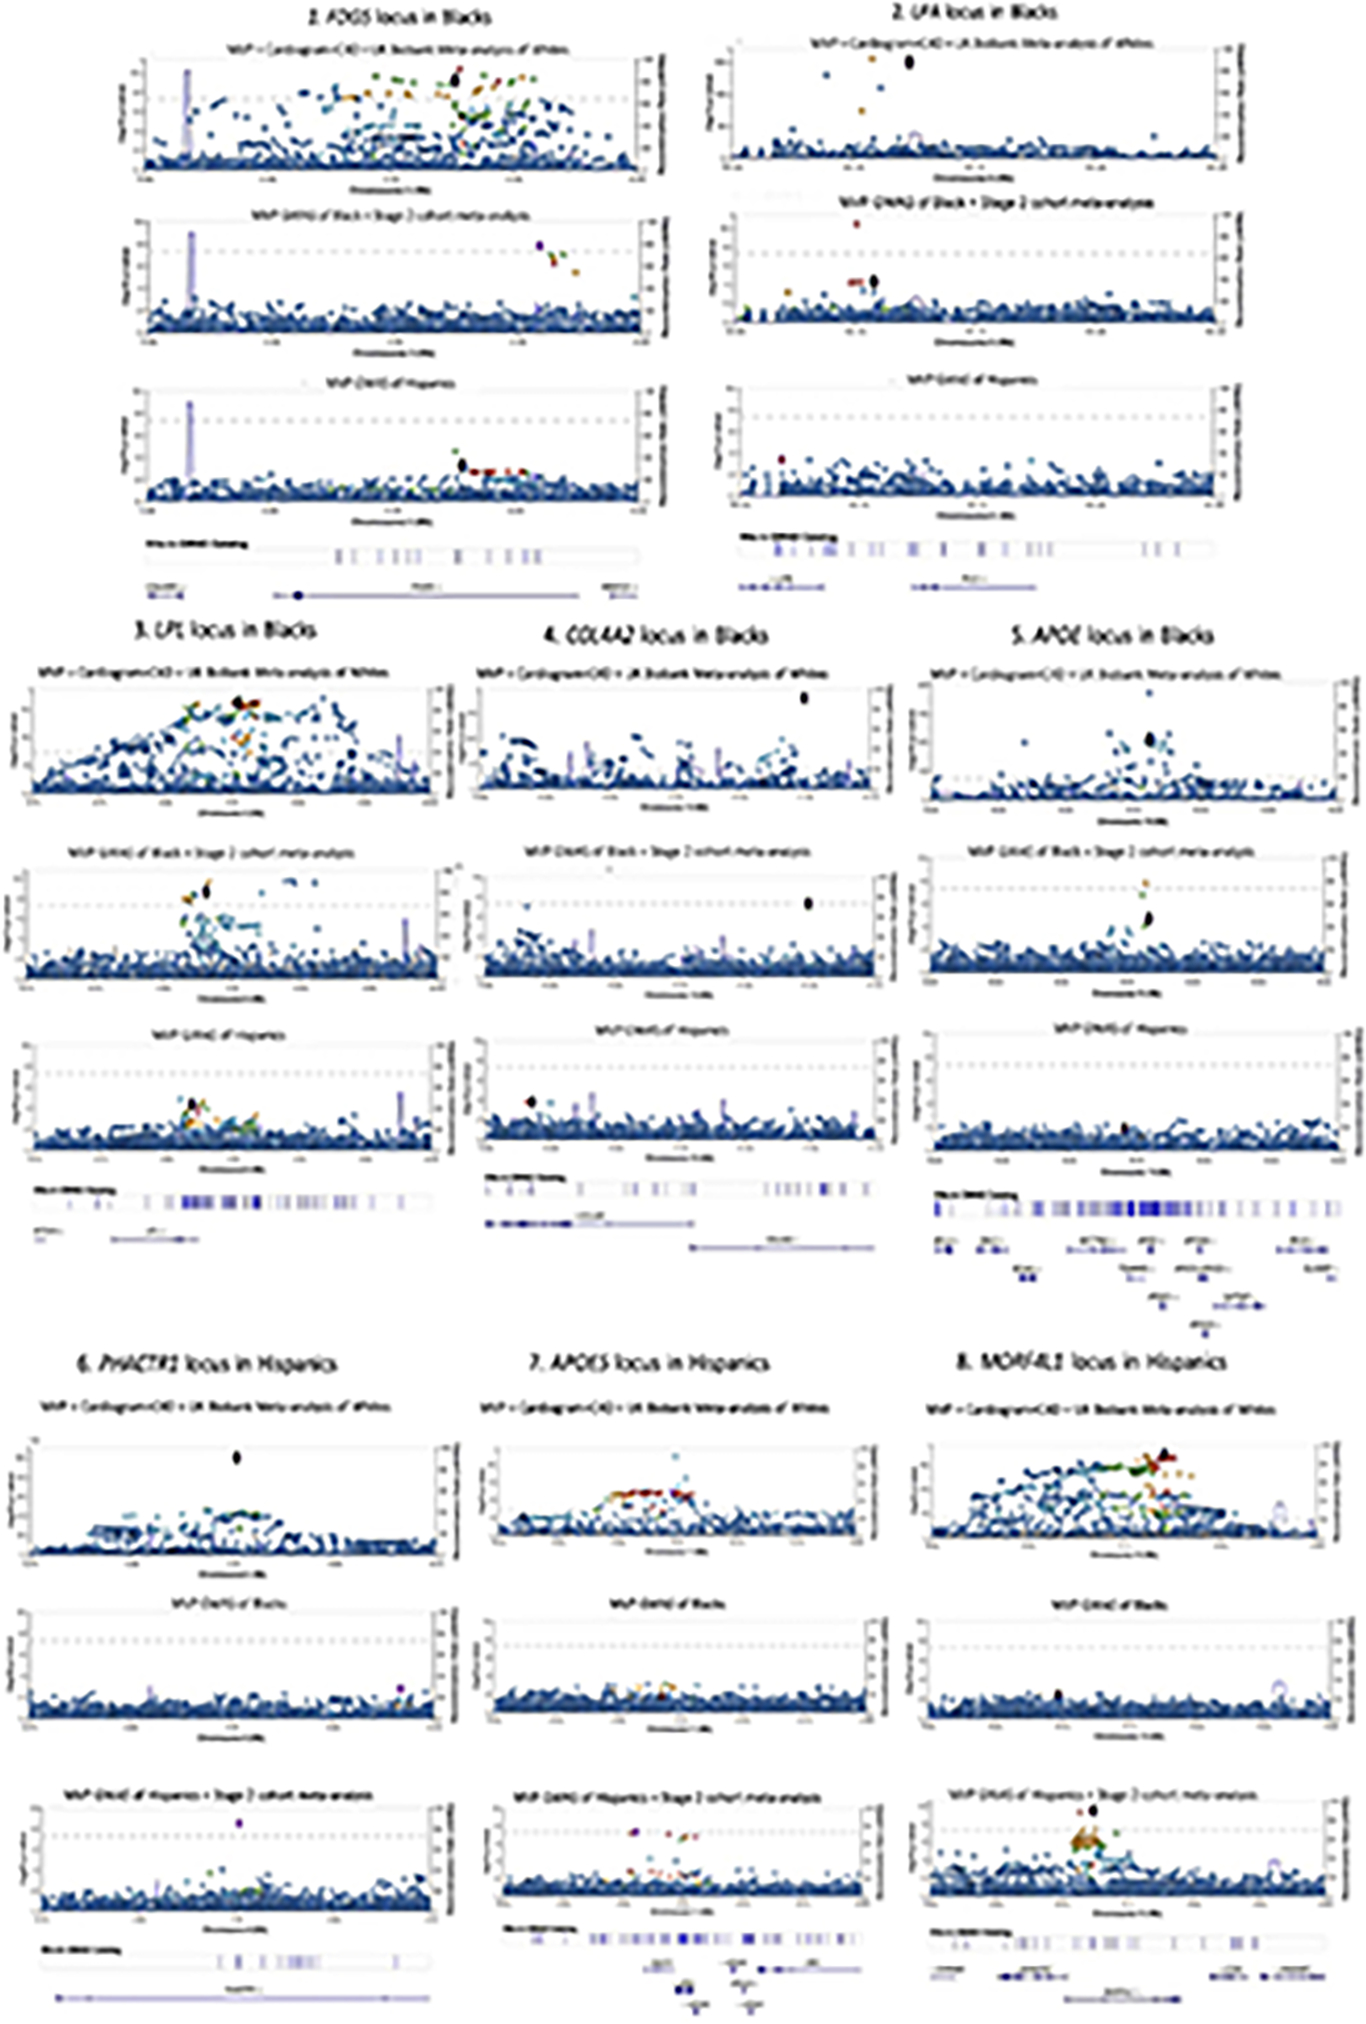
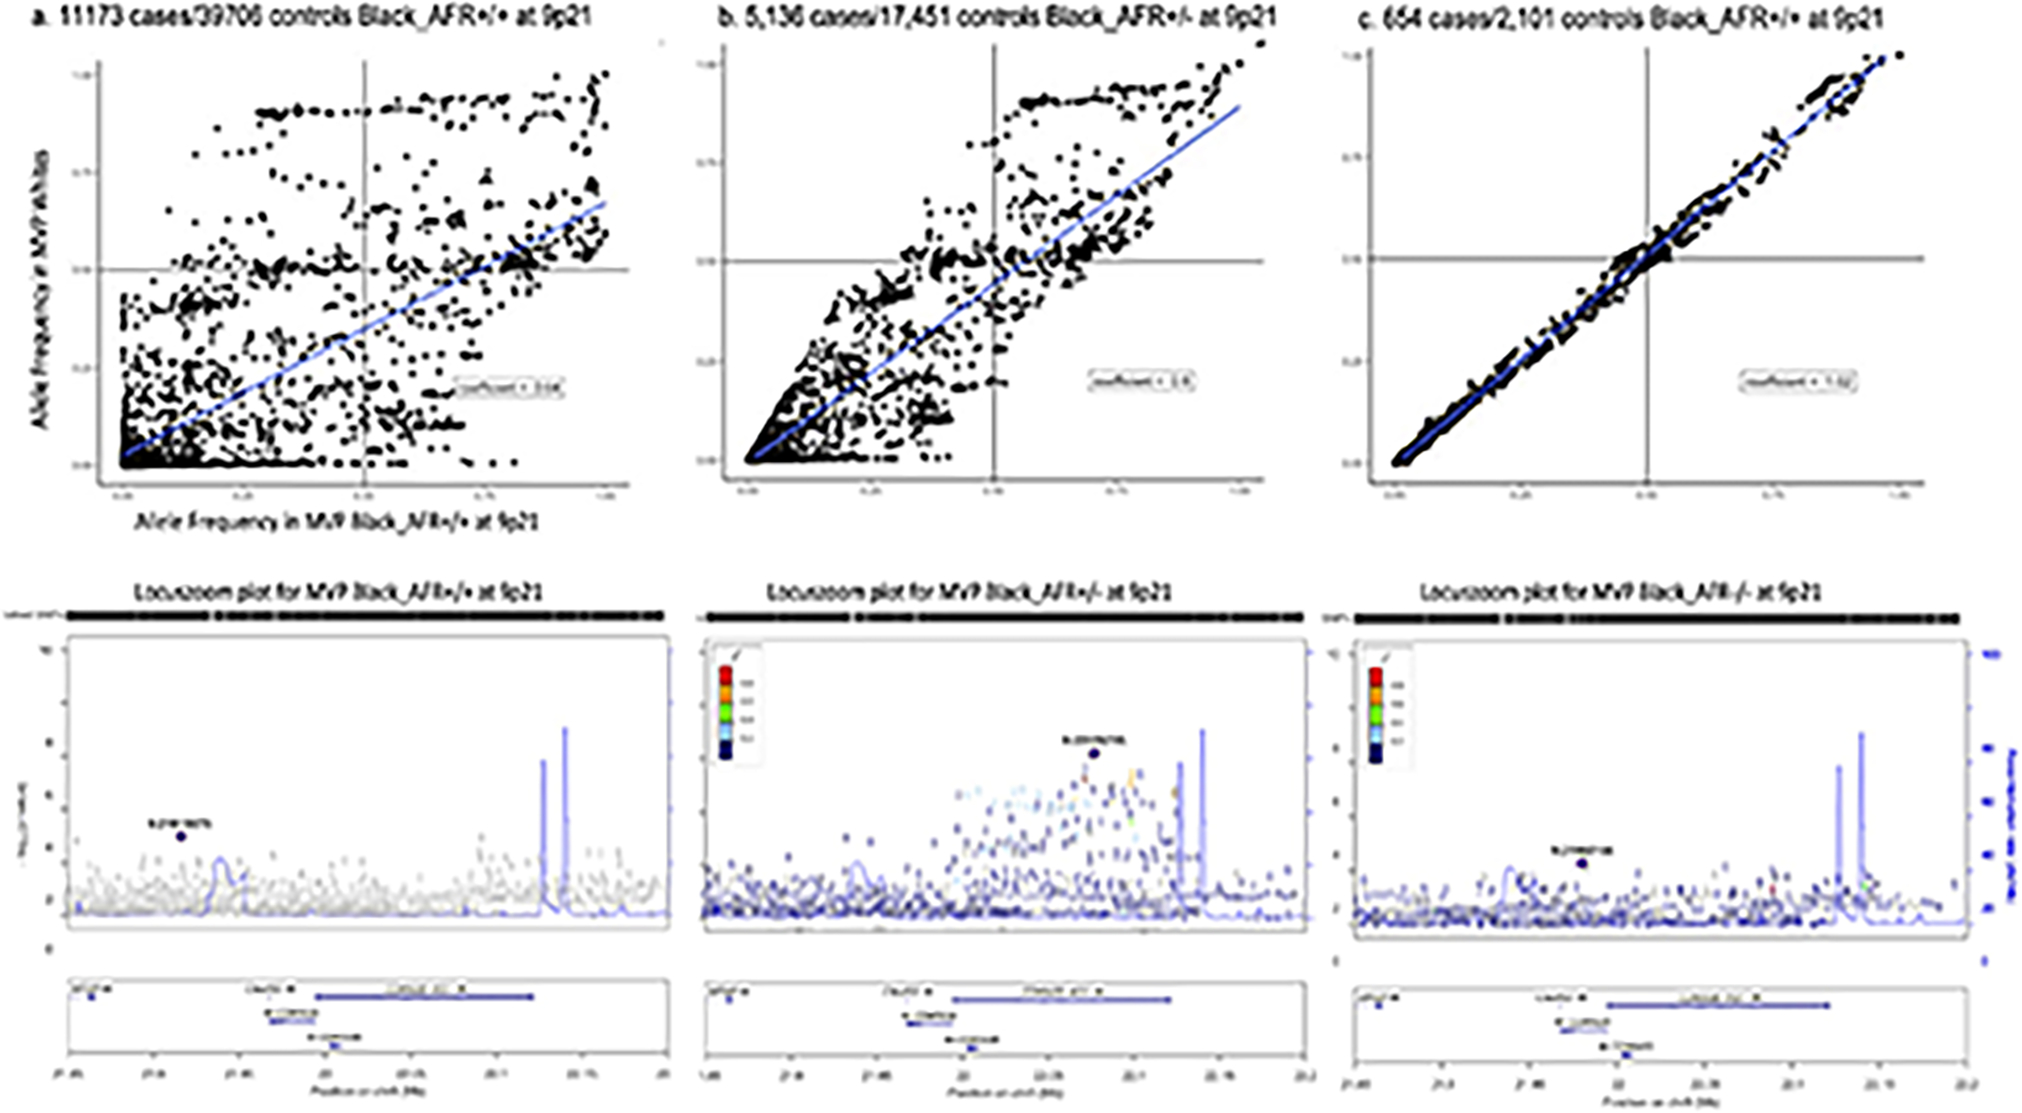
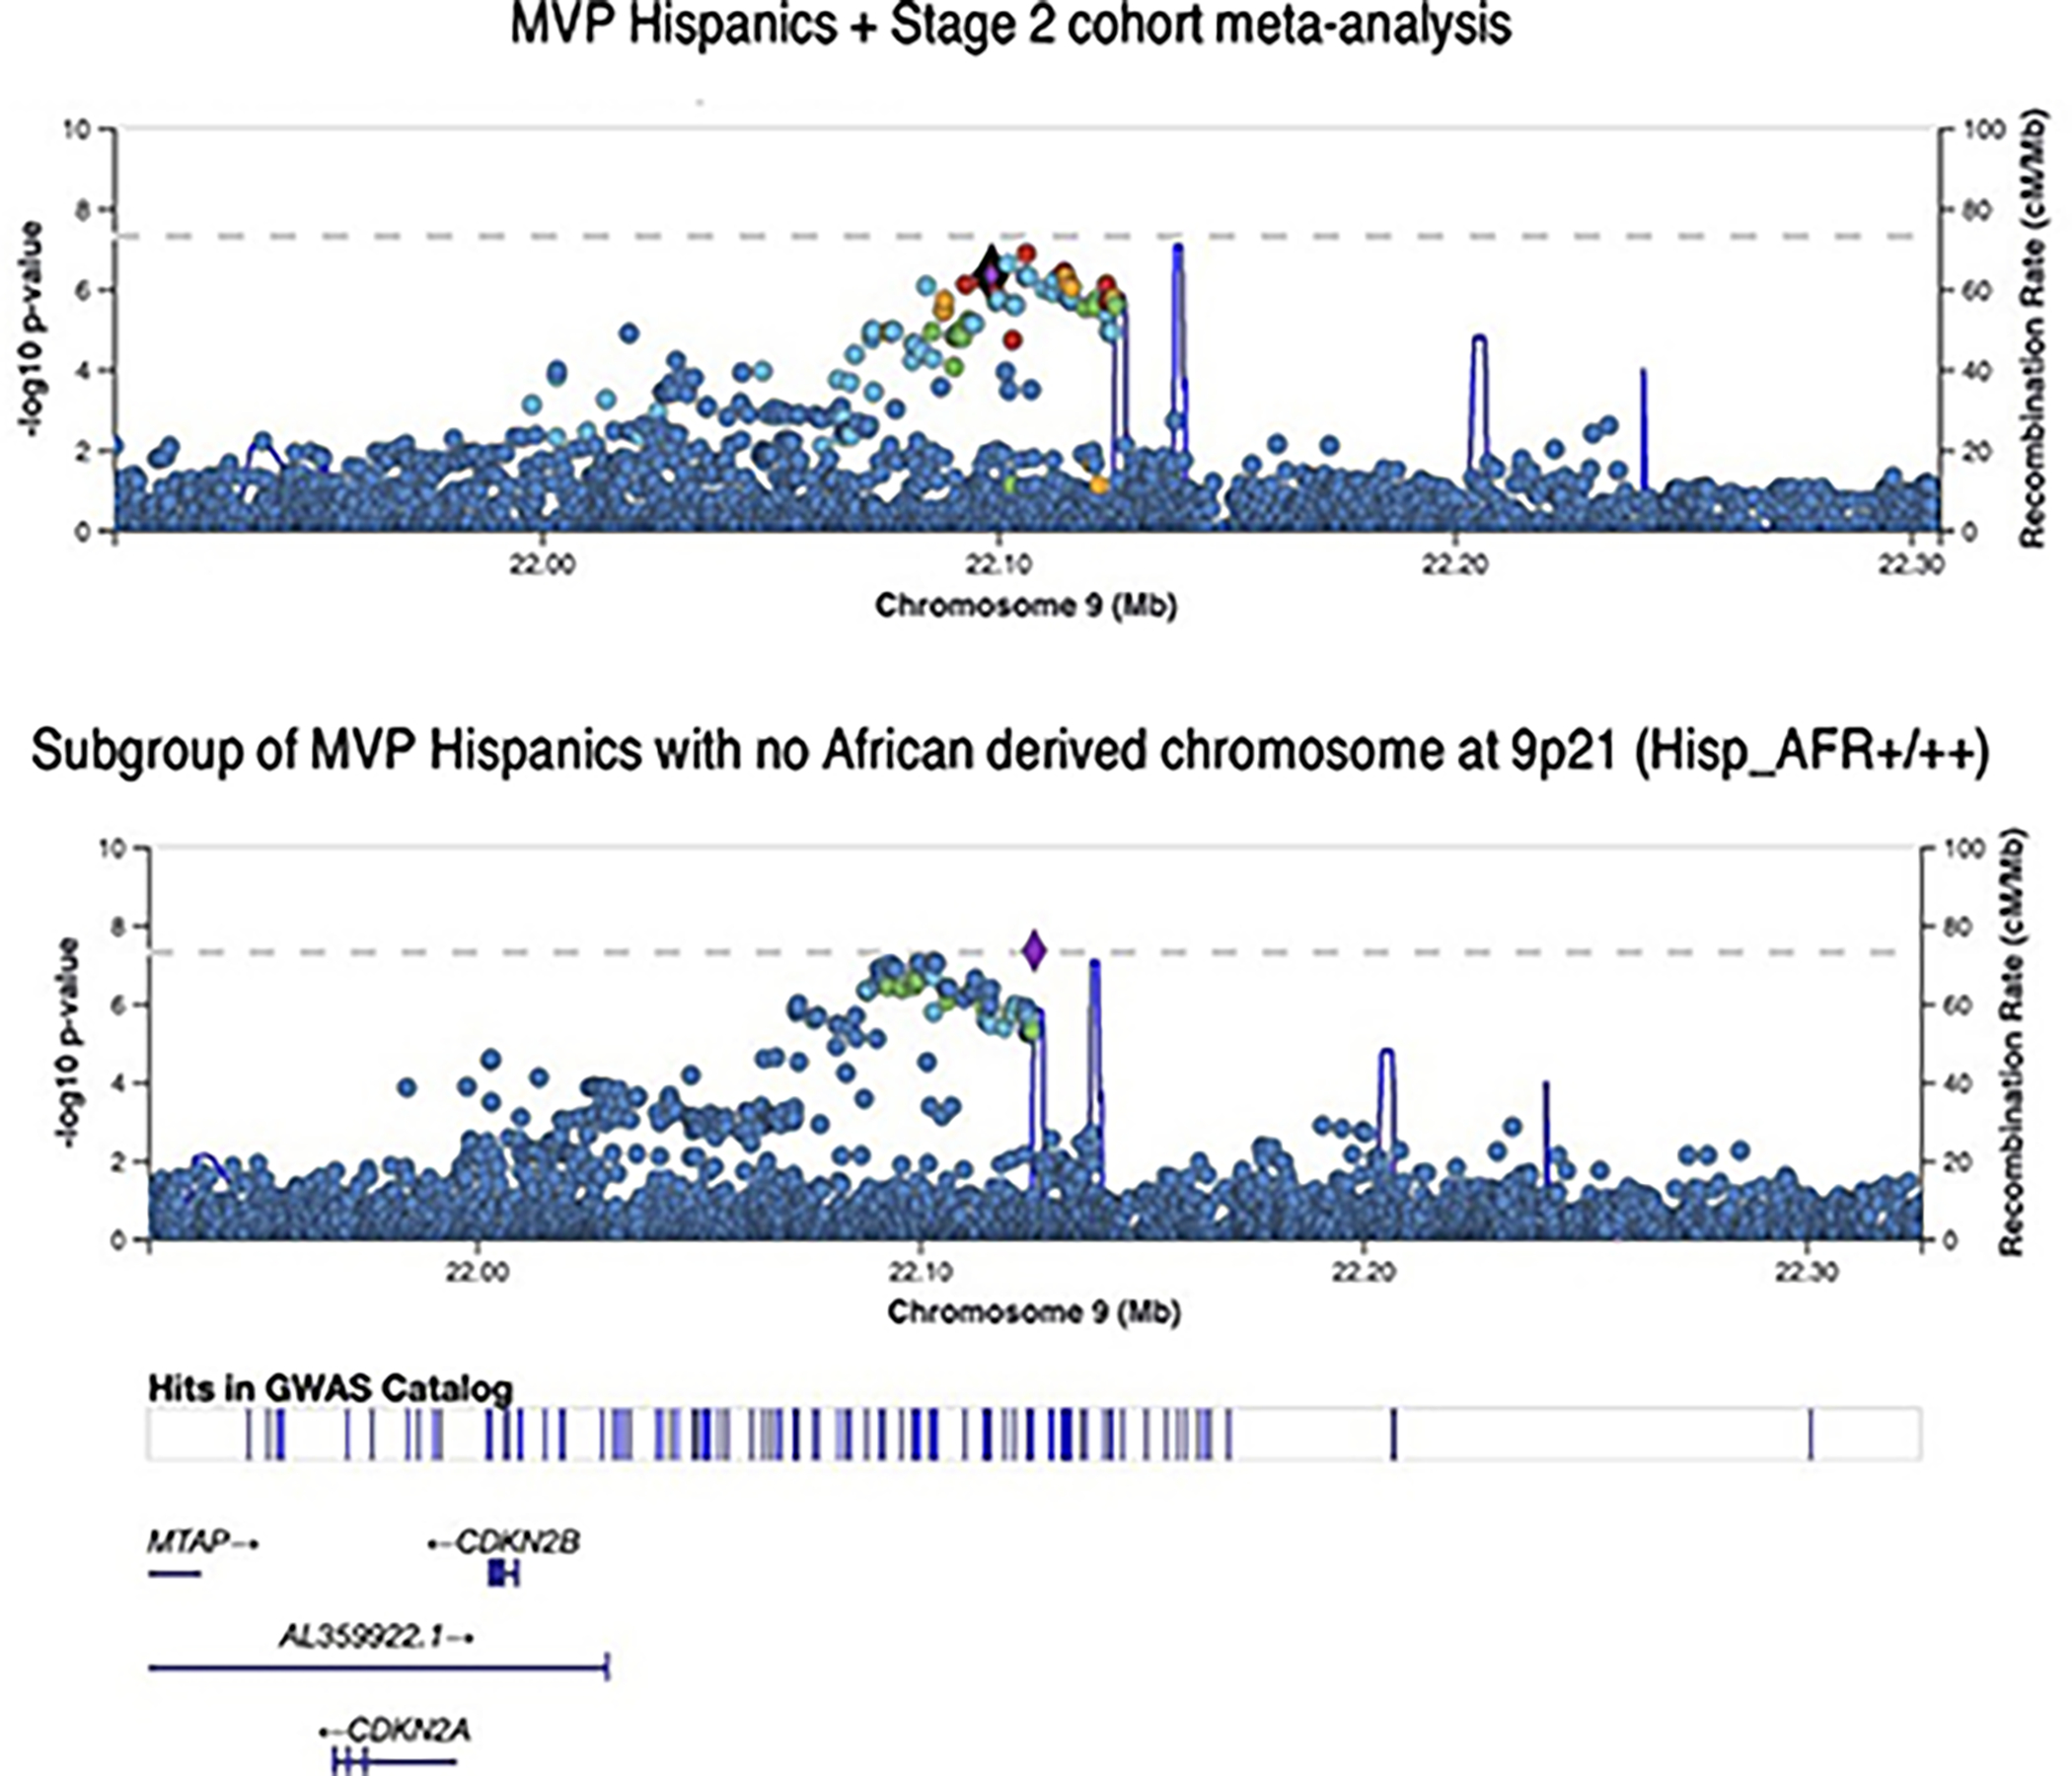
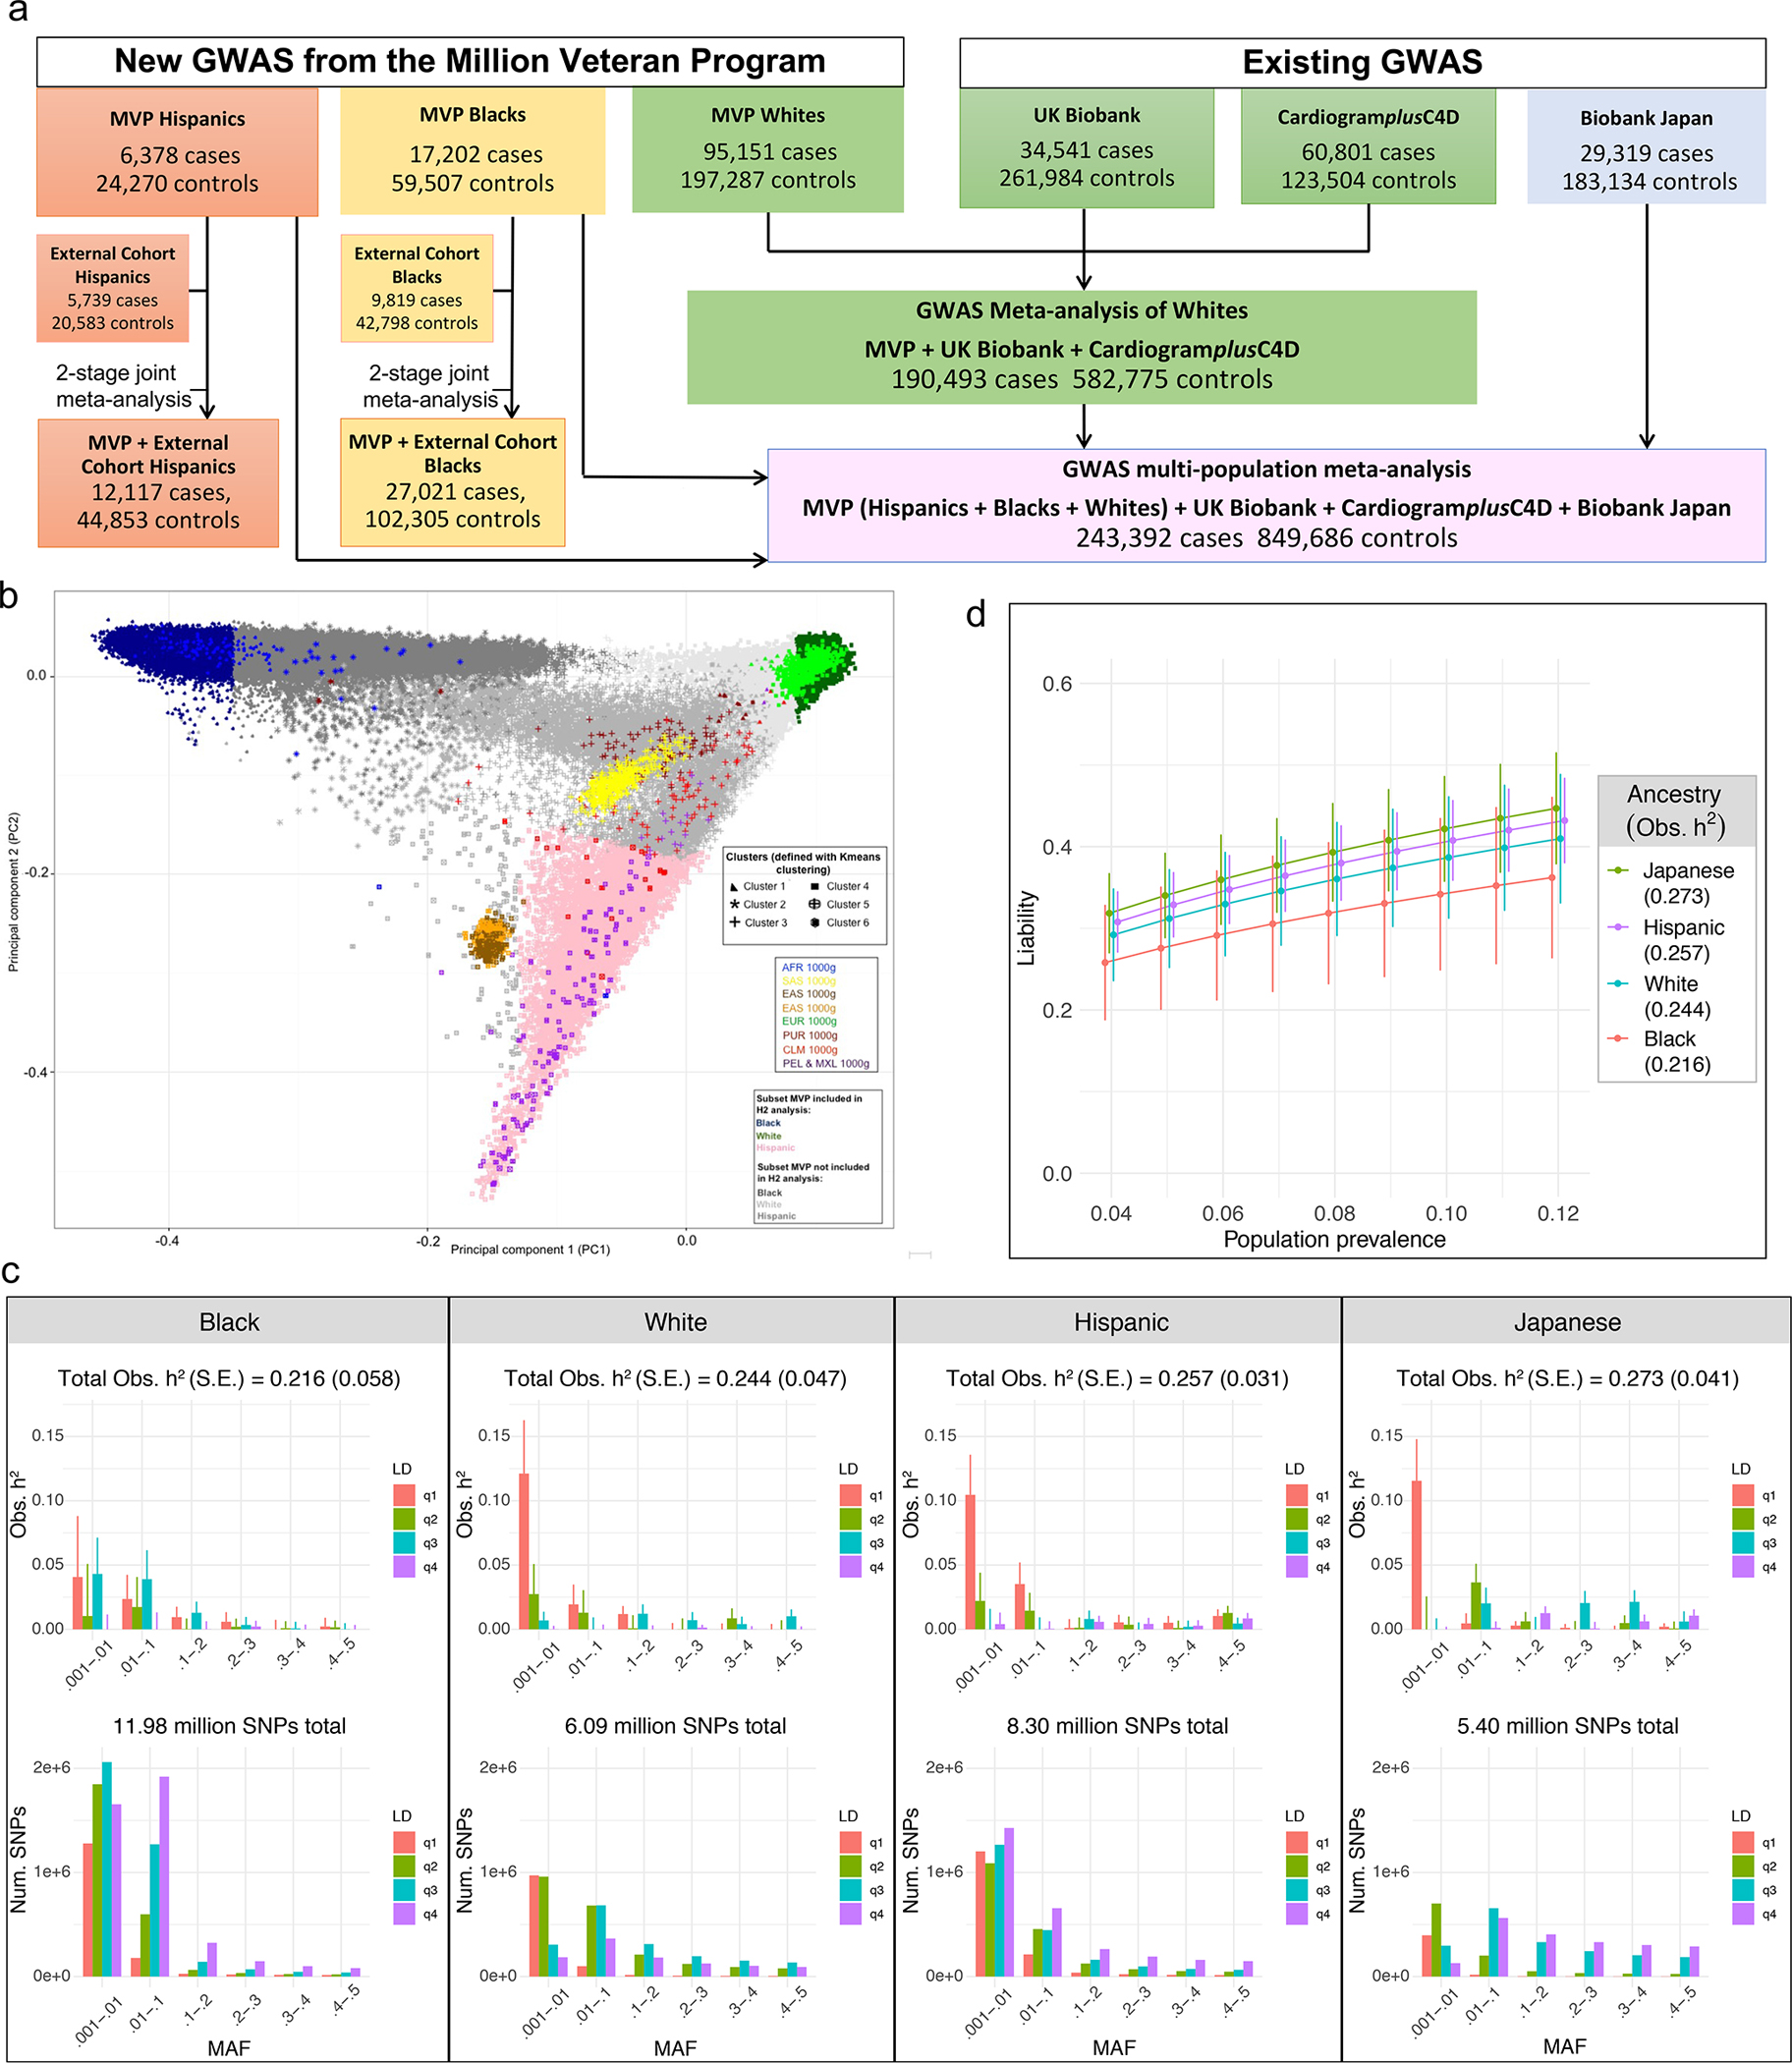
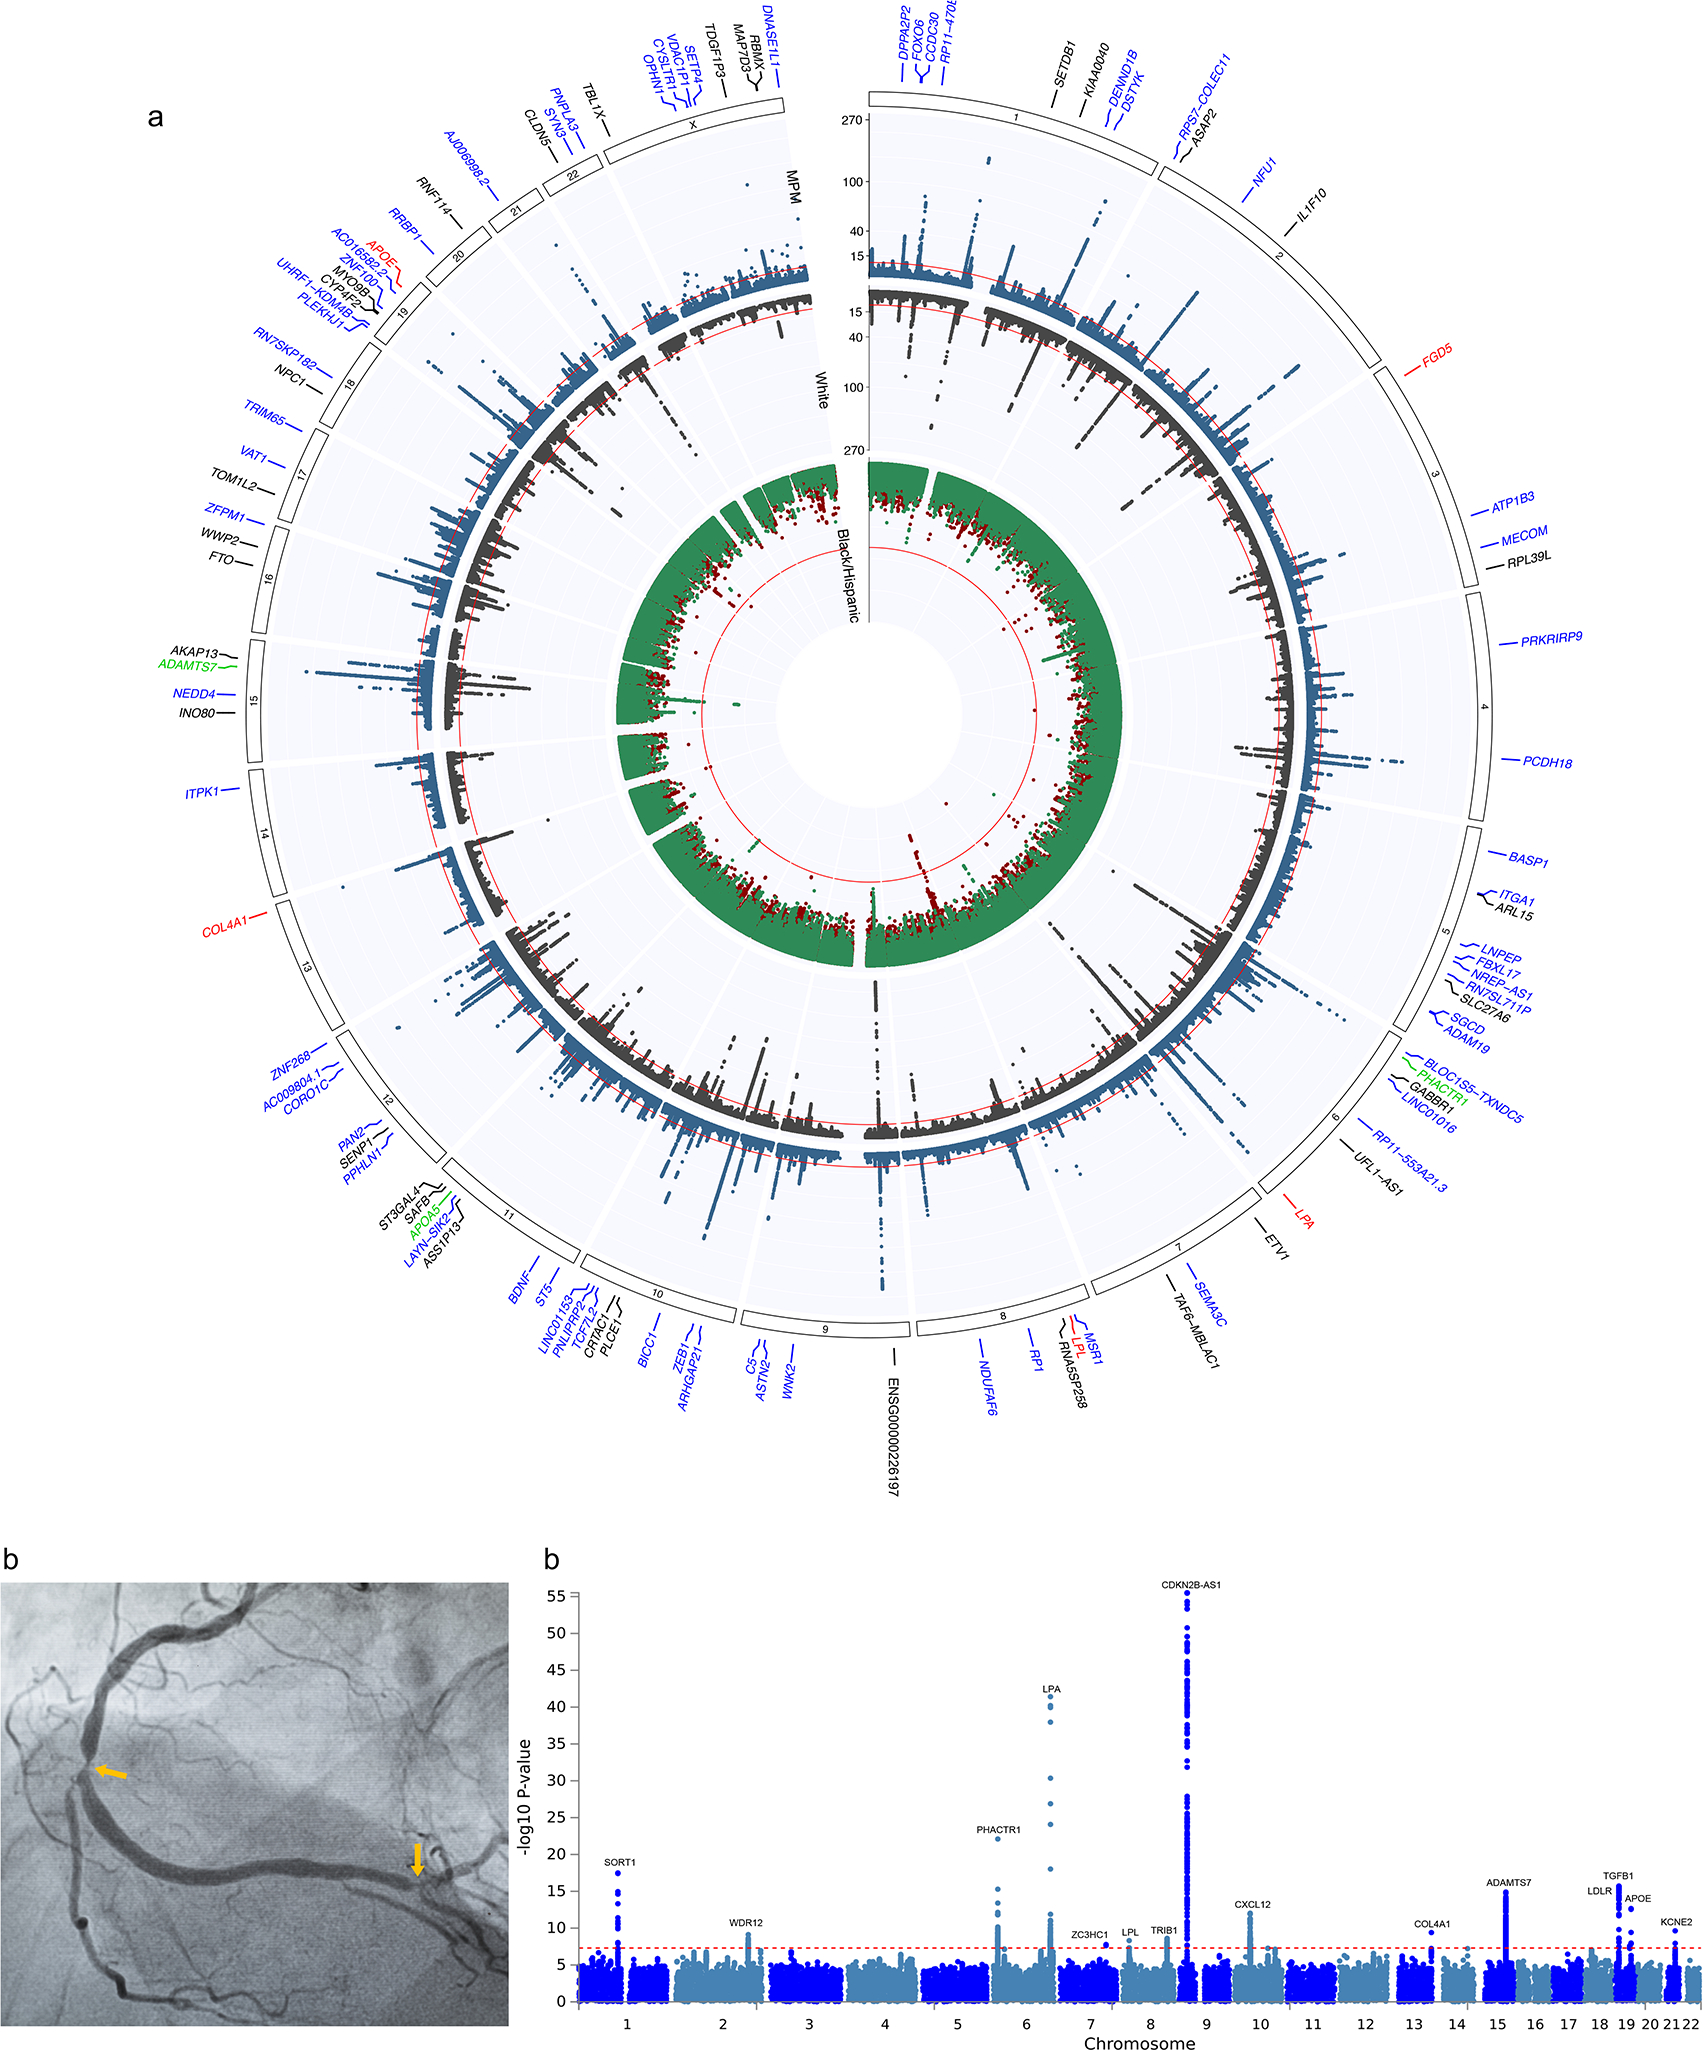
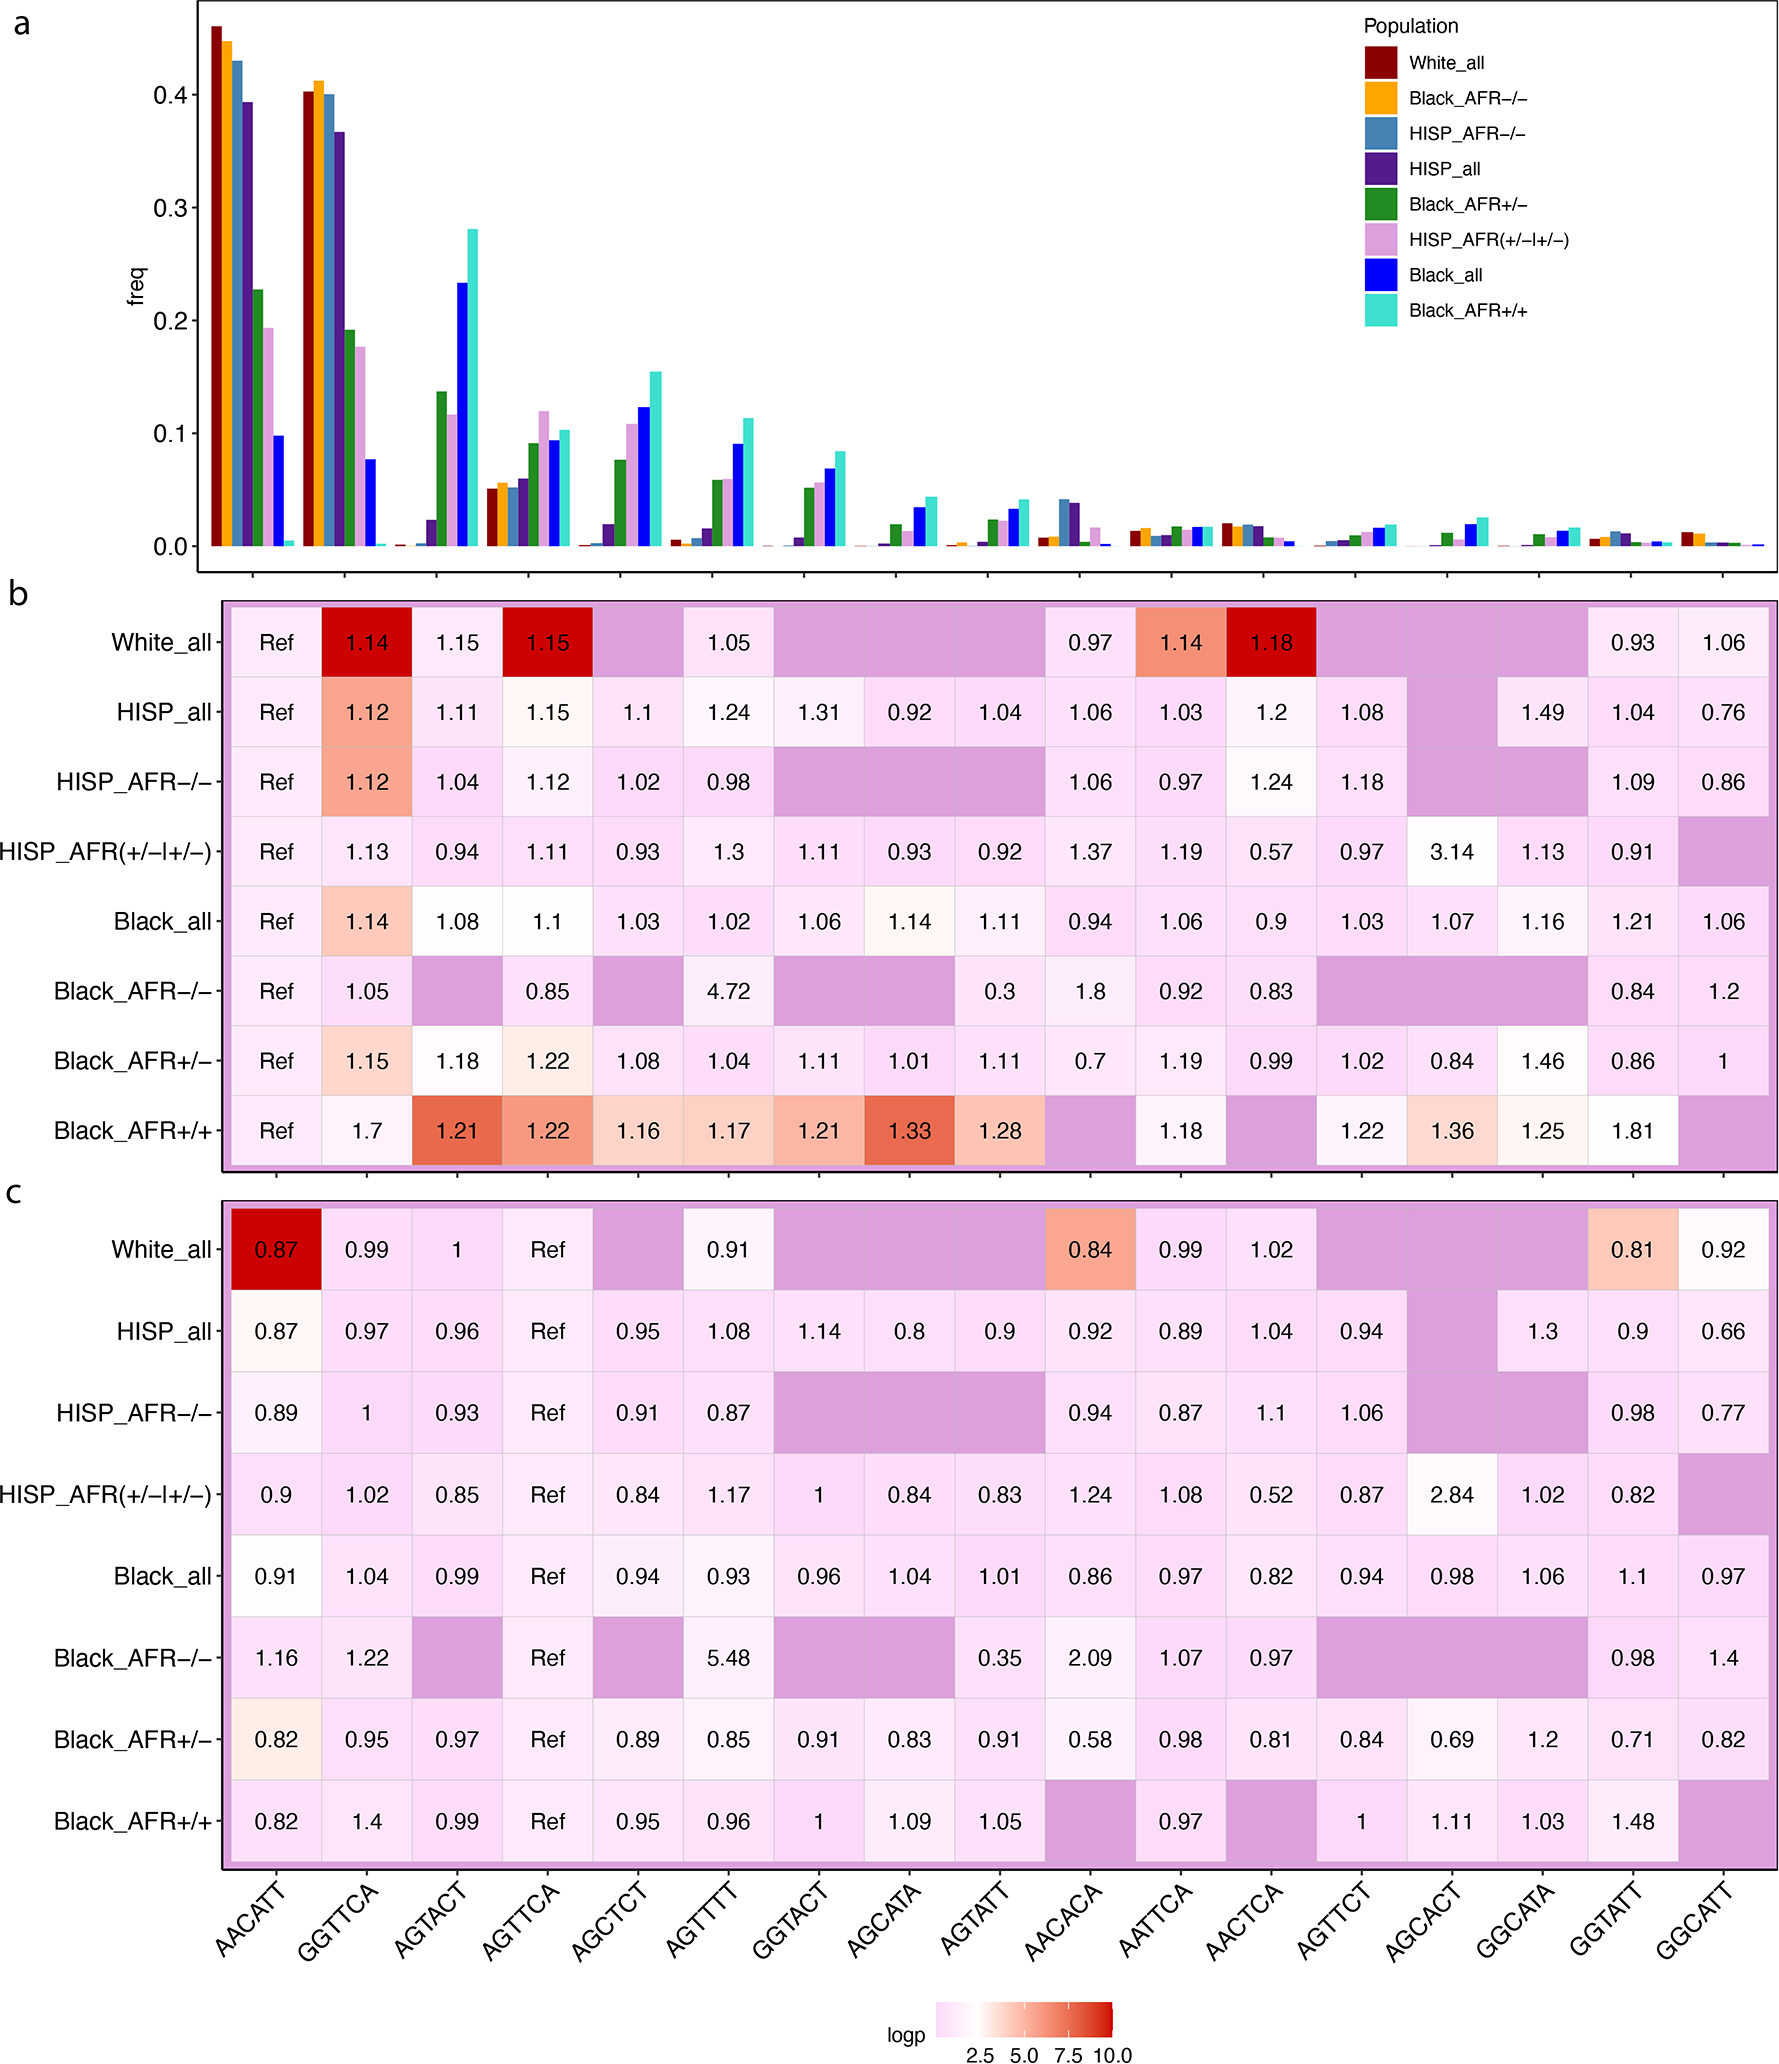
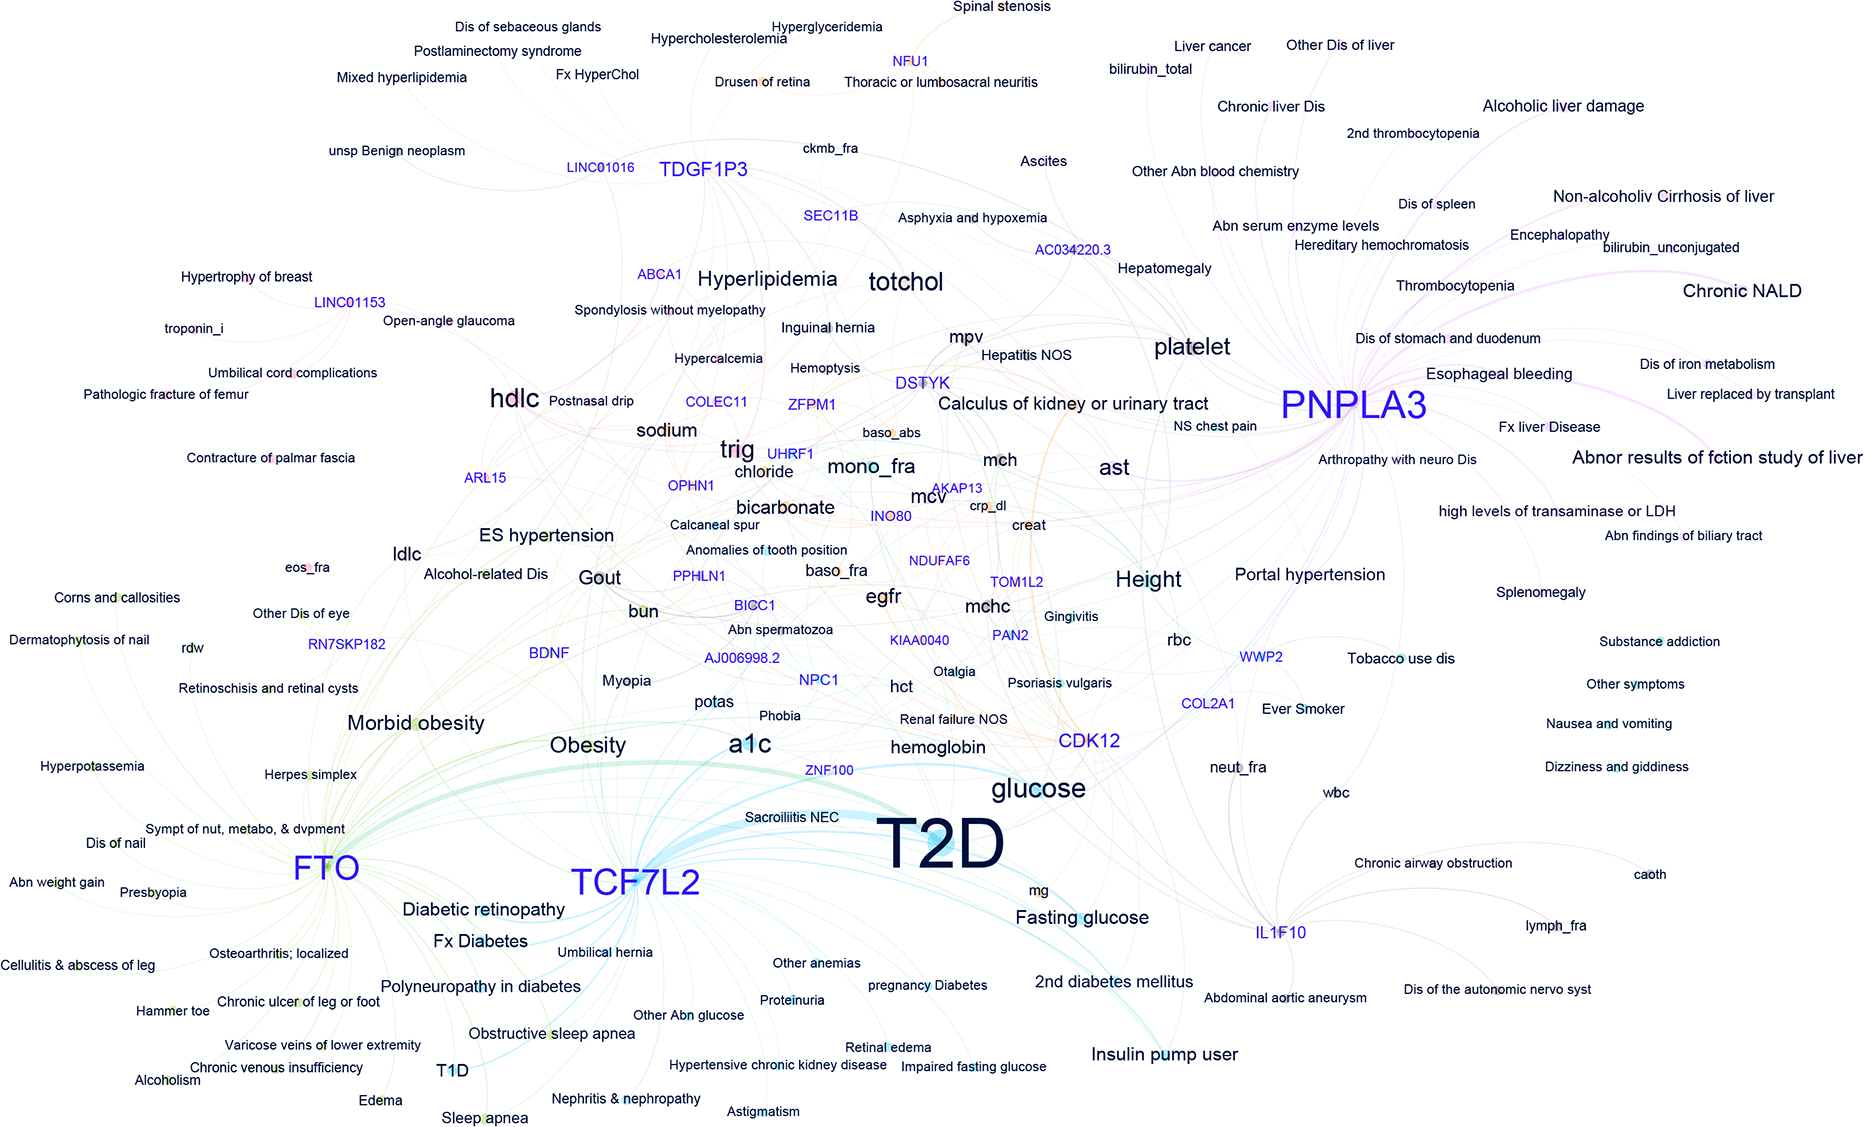
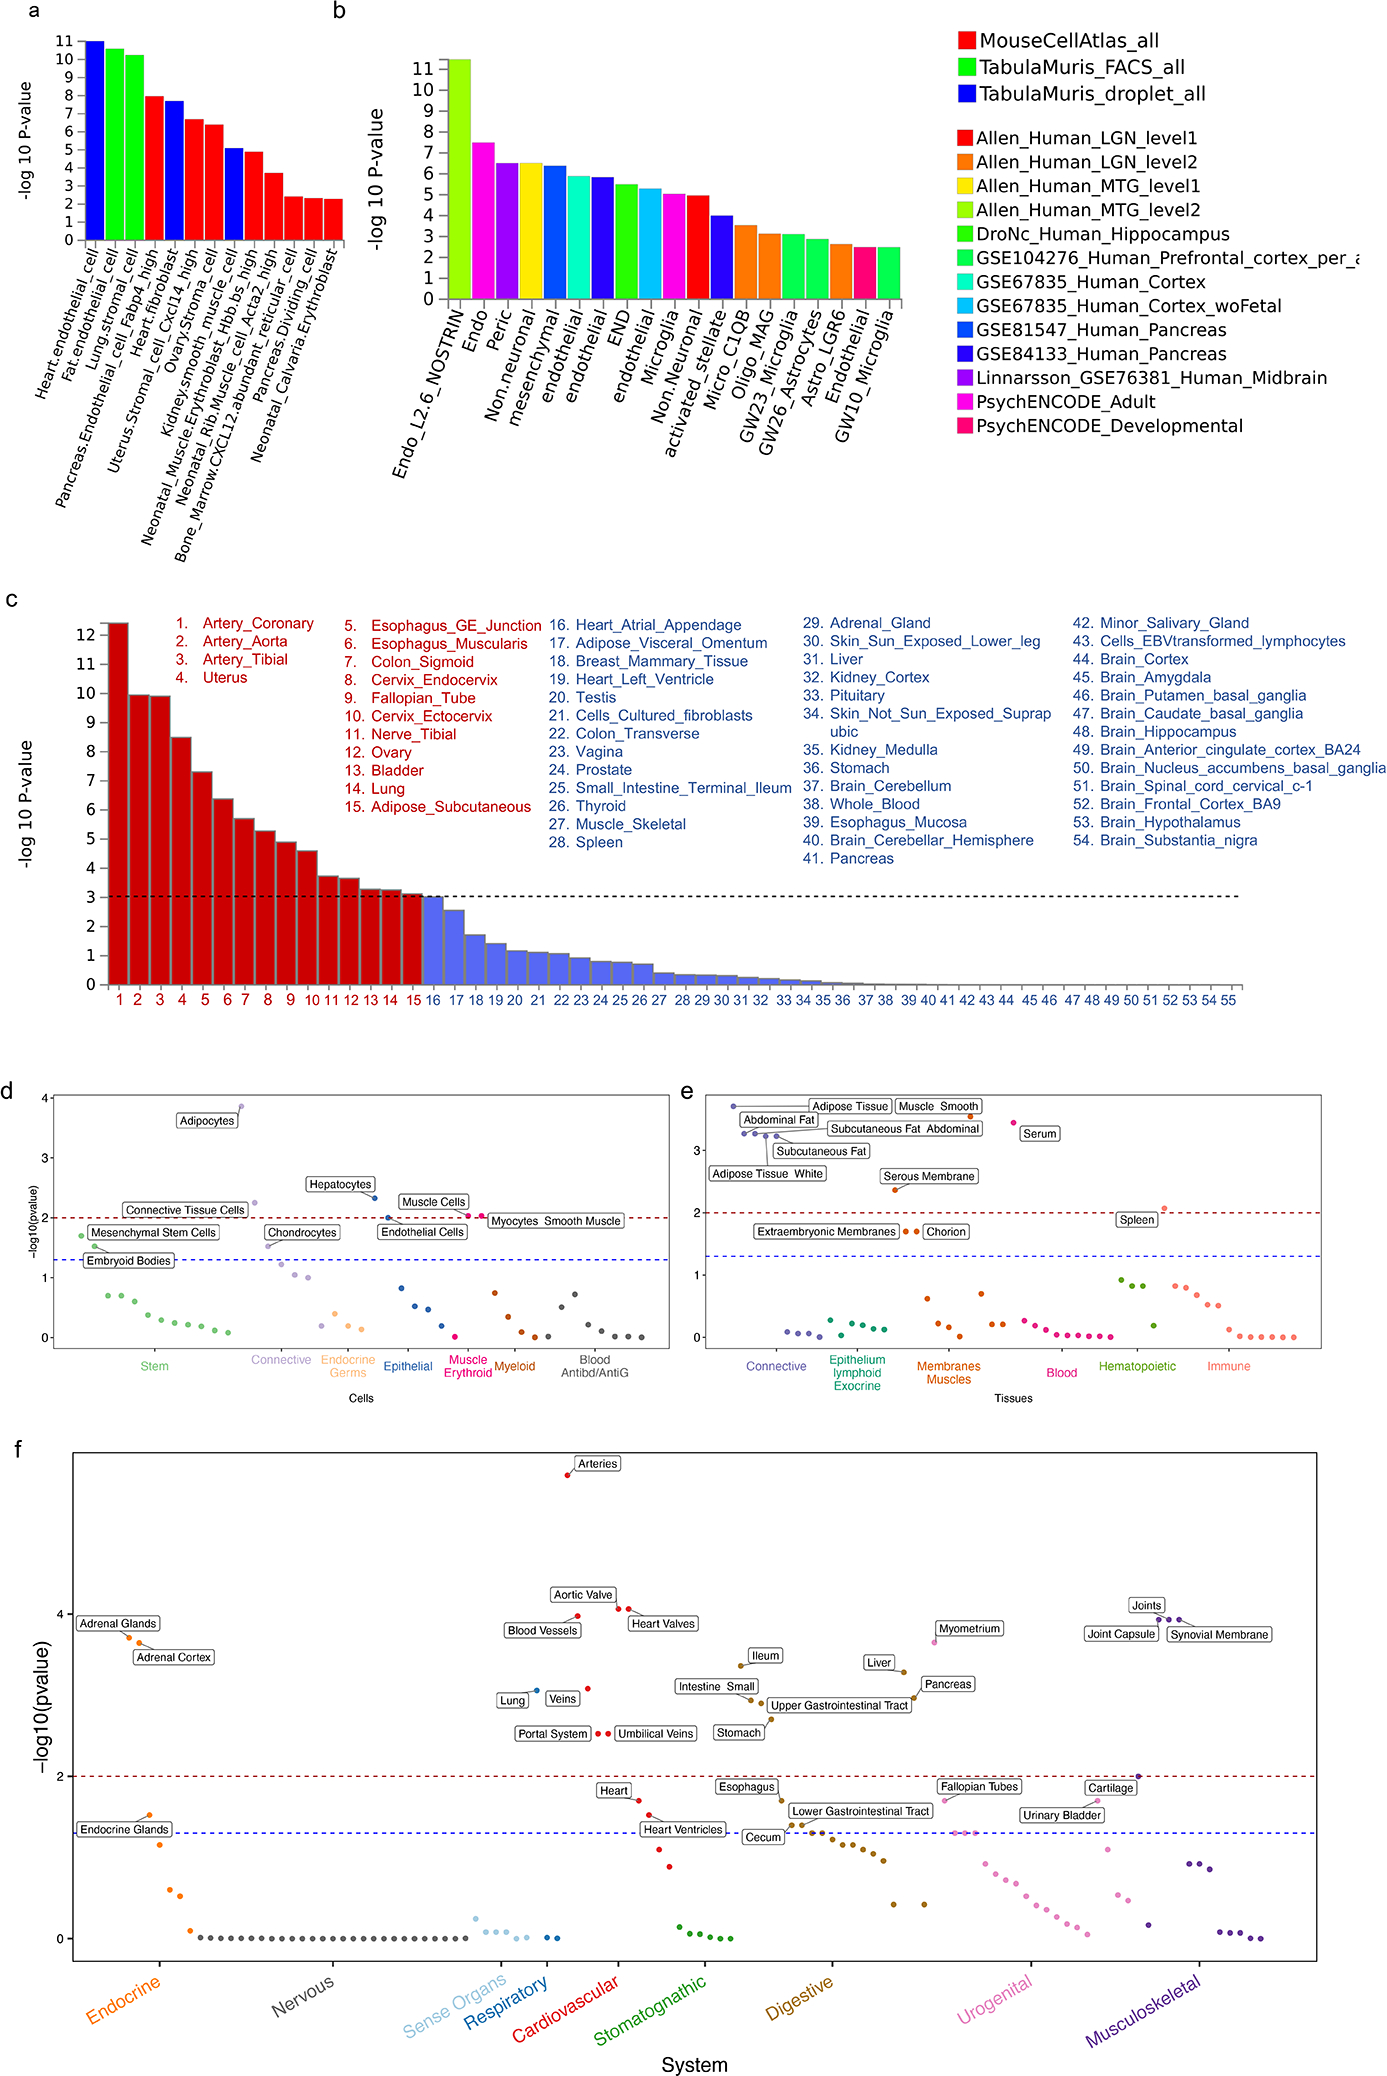
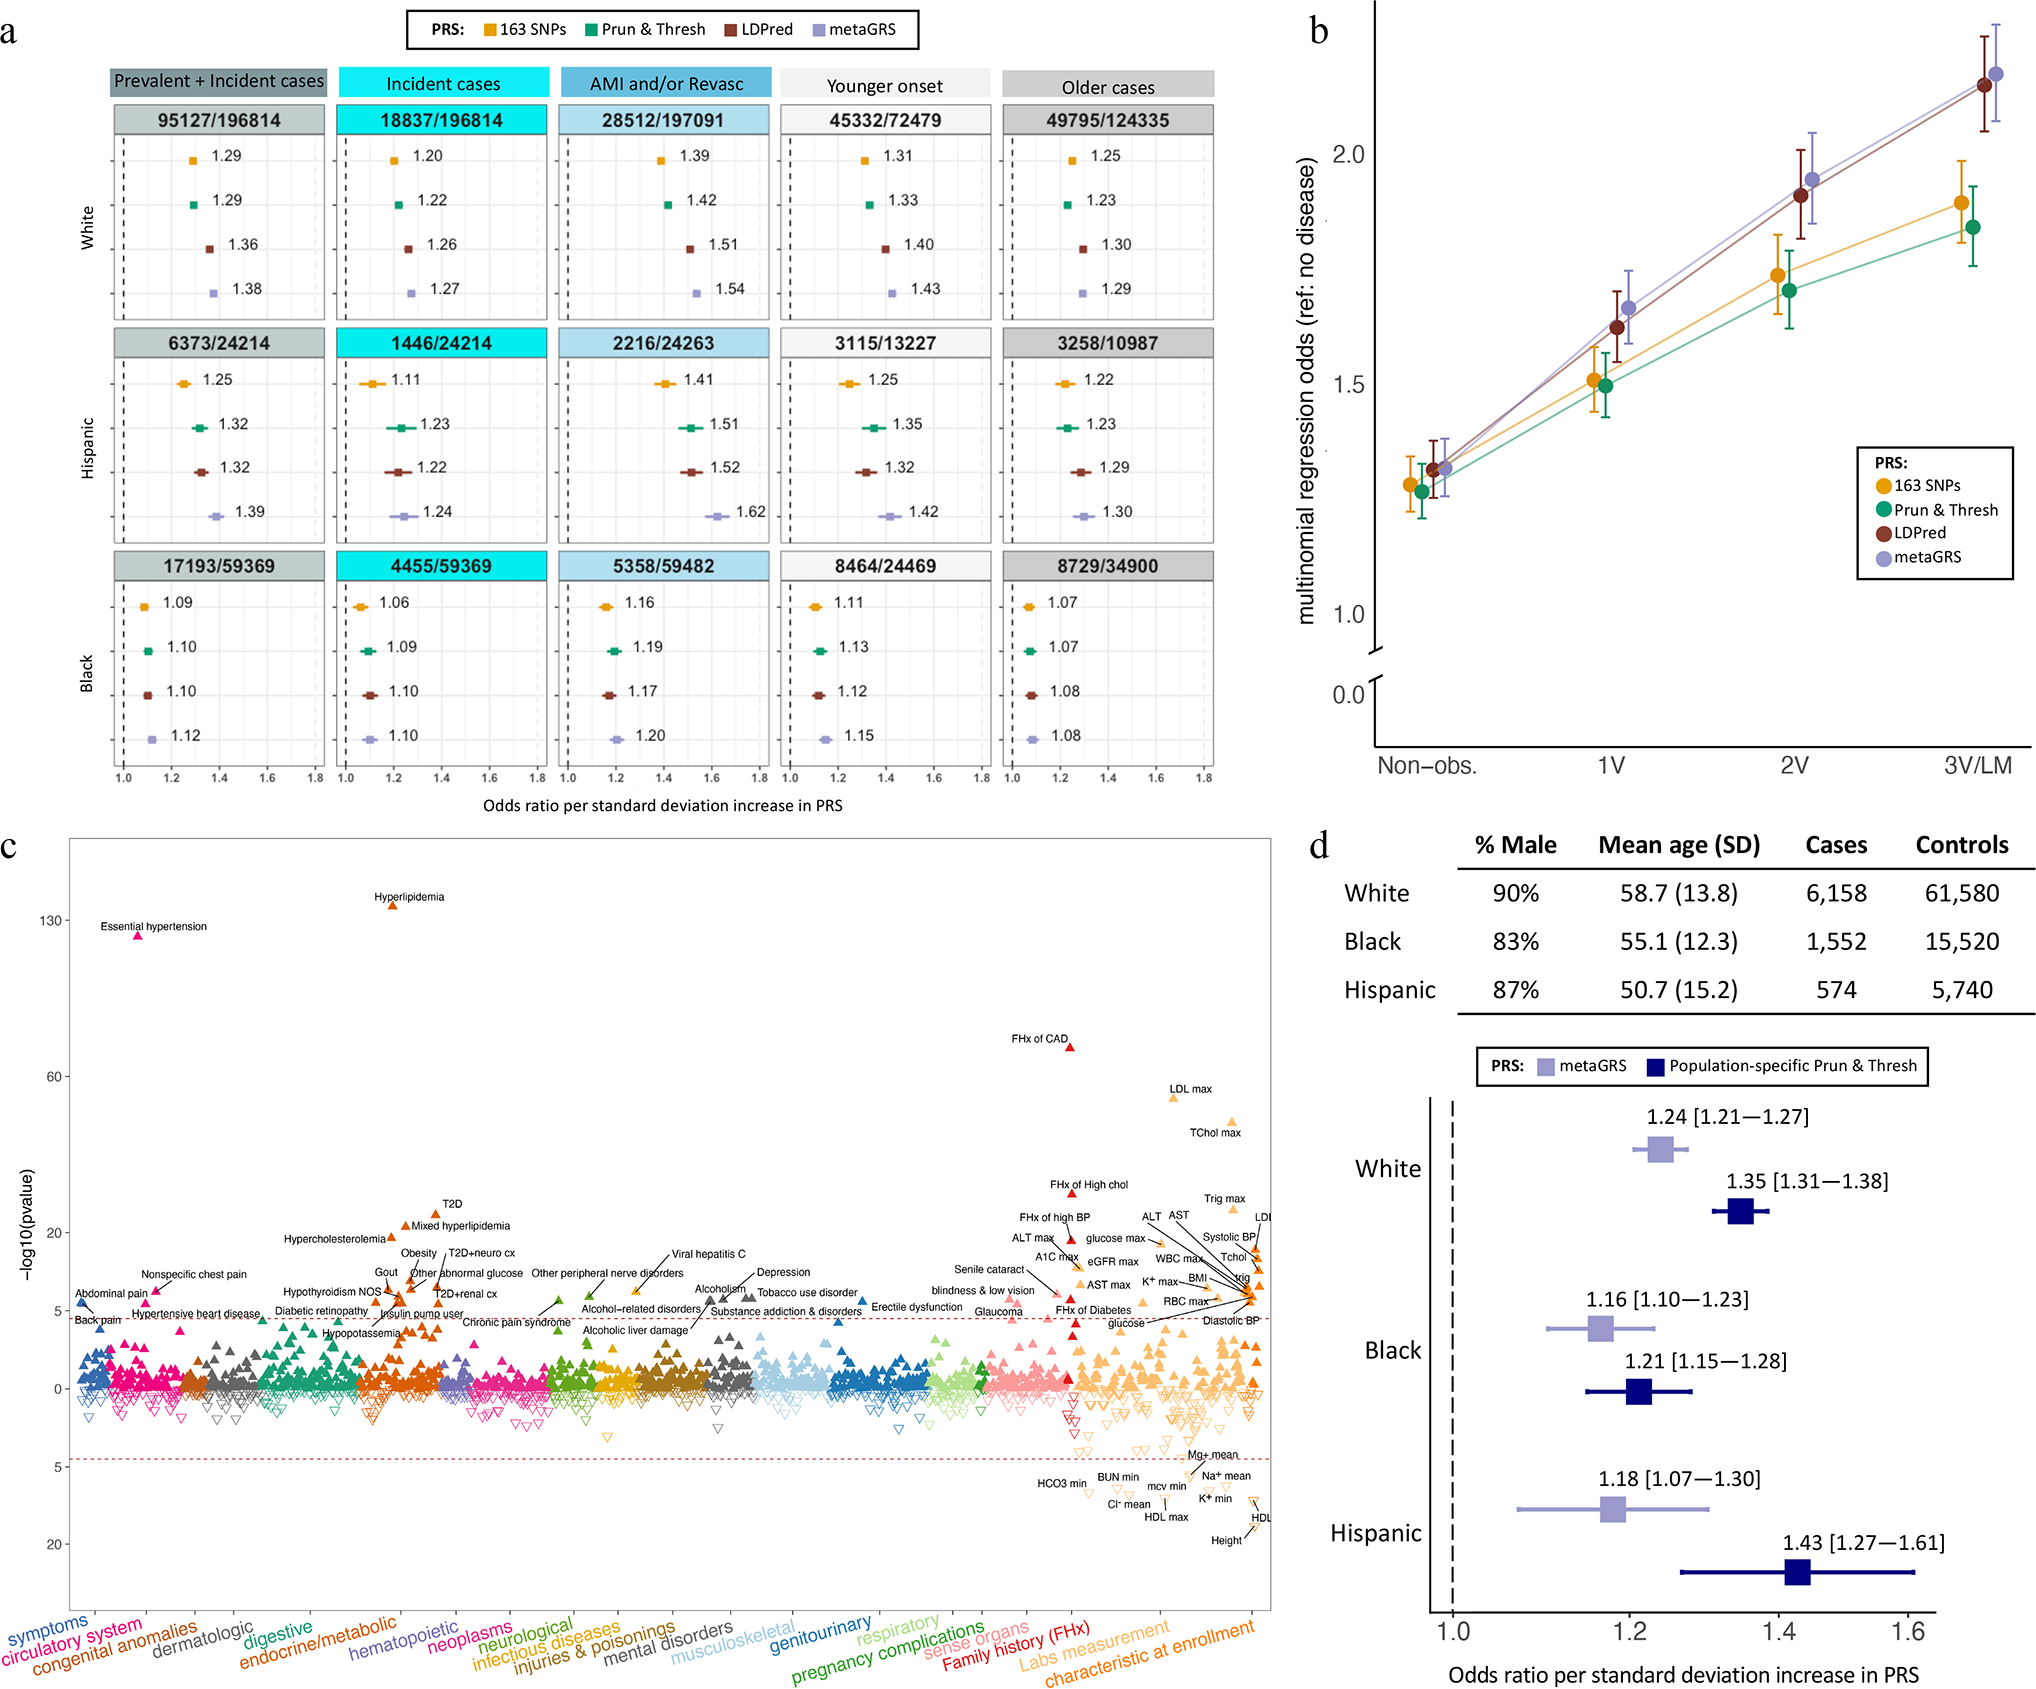
We report a genome-wide association study (GWAS) of coronary artery disease (CAD) incorporating nearly a quarter of a million cases, in which existing studies are integrated with data from cohorts of white, Black and Hispanic individuals from the Million Veteran Program. We document near equivalent heritability of CAD across multiple ancestral groups, identify 95 novel loci, including nine on the X chromosome, detect eight loci of genome-wide significance in Black and Hispanic individuals, and demonstrate that two common haplotypes at the 9p21 locus are responsible for risk stratification in all populations except those of African origin, in which these haplotypes are virtually absent. Moreover, in the largest GWAS for angiographically derived coronary atherosclerosis performed to date, we find 15 loci of genome-wide significance that robustly overlap with established loci for clinical CAD. Phenome-wide association analyses of novel loci and polygenic risk scores (PRSs) augment signals related to insulin resistance, extend pleiotropic associations of these loci to include smoking and family history, and precisely document the markedly reduced transferability of existing PRSs to Black individuals. Downstream integrative analyses reinforce the critical roles of vascular endothelial, fibroblast, and smooth muscle cells in CAD susceptibility, but also point to a shared biology between atherosclerosis and oncogenesis. This study highlights the value of diverse populations in further characterizing the genetic architecture of CAD.


Conflict of interest statement

Ethics declarations - Competing interests

A.B. and L.A.L. are employees of Regeneron Pharmaceuticals. R.D. has received grants from AstraZeneca, grants and nonfinancial support from Goldfinch Bio, being a scientific co-founder, consultant and equity holder for Pensieve Health and being a consultant for Variant Bio. T. M. M. is an employee of the Healthcare Innovation Lab at BJC HealthCare / Washington University School of Medicine, an advisor of Myia Labs, and a compensated director the J.F Maddox Foundation in New Mexico. S.K. is an is an employee of Verve Therapeutics, holds equity in Verve Therapeutics and Maze Therapeutics, and has served as a consultant for Acceleron, Eli Lilly, Novartis, Merck, Novo Nordisk, Novo Ventures, Ionis, Alnylam, Aegerion, Haug Partners, Noble Insights, Leerink Partners, Bayer Healthcare, Illumina, Color Genomics, MedGenome, Quest, and Medscape. D.J.R. is on the Scientific Advisory Board of Alnylam, Novartis, and Verve Therapeutics. M.D.R. is on the scientific advisory board for Goldfinch Bio and Cipherome. C.J.O became an employee of Novartis after initial submission of manuscript. P.N. reports investigator-initiated grants from Amgen, Apple, AstraZeneca, Boston Scientific, and Novartis, personal fees from Apple, AstraZeneca, Blackstone Life Sciences, Invitae, Foresite Labs, Novartis, Roche / Genentech, is a co-founder of TenSixteen Bio, is a shareholder of geneXwell, TenSixteen Bio, and Vertex, scientific advisory board member of geneXwell and TenSixteen Bio, and spousal employment at Vertex, all unrelated to the present work. S.M.D. receives research support from RenalytixAI to his institution and consulting fees from Calico Labs. A.G.B. is a scientific co-founder and equity holder in TenSixteen Bio. The remaining authors declare no competing interests.

Figures

Extended Data Fig. 1
Extended Data Fig. 1. LocusZoom plots of loci reaching genome wide significance in Blacks and Hispanics
Sets of LocusZoom plots for five loci in Blacks and 3 loci in Hispanics reaching genome wide significance after two-stage meta-analysis with external cohorts. Each set of plots show the association results for a locus for all three populations using the same chromosome location scale (x-axis) but not the same p-value scale (y-axis). P values are derived from inverse variance weighted meta-analysis using METAL and are two-sided.
Extended Data Fig. 2
Extended Data Fig. 2. Allele frequencies and association results at the 9p21 locus among Black in the Million Veteran Program stratified by local ancestry status
Top panels show plots of corresponding allelic frequencies at the 9p21 susceptibility locus observed in MVP Whites vs. subgroups of MVP Blacks including those with a. two African chromosomes (chr), b. one African chr, and c. no African chr at the locus. Corresponding LocusZoom plots for each group are in the panels immediately below. Association testing was performed using logistic regression with adjustment on sex and principal component as implemented in PLINK. P values were derived from a Wald test and are two-sided.
Extended Data Fig. 3
Extended Data Fig. 3. LocusZoom plots of SNP association at the 9p21 susceptibility locus for CAD.
Top panel plots the results for MVP GWAS of all Hispanics + Stage 2 cohort meta-analysis. P values are derived from inverse variance weighted meta-analysis using METAL and are two-sided. Bottom panel plots the subset of MVP Hispanics with no African derived chromosomes at 9p21 based on local ancestry assessment using RFMix (5,298 cases / 20,556 controls). Association testing was performed using logistic regression with adjustment on sex and principal component as implemented in PLINK. P values were derived from a Wald test and are two-sided.
Fig. 1:
Fig. 1:. Design of multi-population genome wide association study (GWAS) of coronary artery disease (CAD) and estimates of heritability (h2) of CAD using GREML-LDMS-I for four populations
a, Study design. GWAS was first performed stratified by population group. GWAS for Whites was then meta-analyzed with 2 existing GWAS for initial discovery among Whites. The GWAS for MVP Hispanics and MVP Blacks as well as the Biobank Japan GWAS of CAD was further incorporated into a single multi-population meta-analysis. Two-stage joint meta-analysis of the most promising SNPs was performed for the Hispanics and Blacks with multiple external cohorts for population-specific discovery. b-d, Heritability (h2) analyses for CAD in four major racial groups using GREML-LDMS-I. b. Principal component analysis of MVP participants combined with 1000 genomes was first performed to identify a random subset of 19,395 Hispanics with the highest proportion of Indigenous American ancestry (pink). A random subset of the 19,392 least admixed Whites (dark green) and the 19,392 least admixed Blacks (dark blue), respectively, were then matched 1:1 on case-control status, age of first EHR evidence of CAD, type of CAD presentation, and age of controls to the Hispanics. Similar matching was performed for 18,747 participants from the Biobank Japan study. c, Observed narrow-sense h2 within each cohort defined in b using a multi-component model, GREML-LDMS-I, implemented in GCTA, with age, sex, and a genetic relatedness matrix as covariates. h2 estimate and respective standard error (SE) of that estimate is shown for each of 24 bins of imputed SNPs defined by linkage disequilibrium score quartiles and six minor allele frequency thresholds (top panel) with the corresponding absolute number of SNPs contributing to this h2 shown on the bottom panel. Total h2 is calculated by summing 24 estimates with SE for this estimate calculated by delta method. d, h2 on the liability scale for each population in c as a function of a range of presumed population prevalence of CAD. Error bars denote +/− one SE around each point estimate.
Fig. 2:
Fig. 2:. Population-specific GWAS and multi-population meta-analysis
a, Circos plot indicating the −log10(P) for association with CAD for population-specific and multi-population GWAS meta-analyses. See Figure 1a for sample sizes. P values are derived from inverse variance weighted meta-analysis using METAL or GWAMA and are two-sided. The inner track plots the 2-stage meta-analysis association results for Blacks in red and Hispanics (HISP) in green, while the middle track plots the results for the meta-analysis of Whites in black and the multi-population metanalysis further incorporating the GWAS of MVP Blacks, MVP Hispanics, and of Biobank Japan in blue. The red line indicates genome-wide significance (GWS) (P = 5.0 × 10⁻⁸). The outer track lists the nearest mapped gene to the lead SNPs reaching GWS in each of these four meta-analyses including five loci in Blacks (red font), three loci in Hispanics (green font), 33 novel loci among Whites (black font), and 62 additional novel loci after the multi-population meta-analysis (blue font). b, Example of X-ray image from an angiogram of the right coronary artery used to estimate the burden of coronary atherosclerosis. The image shows 2 high-grade obstructions (arrows) as contrast agent is injected into the blood vessel (Adobe Stock FILE #: 413211903). Manhattan plot (right) of multi-population meta-analysis of GWAS (n=41,507) for burden of coronary atherosclerosis as estimated by the number of arteries with obstructions >50% on an angiogram. P values are derived from inverse variance weighted meta-analysis using METAL and are two-sided.
Fig. 3:
Fig. 3:. Local ancestry and haplotype analyses at the 9p21 susceptibility locus for CAD in the Million Veteran Program
a-c, Black (n=17,247 cases / 60,578 controls) and Hispanic (n=6,388 / 24,479) MVP participants were stratified into groups based on the degree of African ancestry at the 9p21 locus for CAD as determined by RFMix. Whites (n=11,170 / 39,706) were analyzed as a single non-admixed group. The three subgroups among Blacks formed includes subjects with a high probability of having inherited two African (Black_AFR+/+, n=11,173 / 39,706) derived chromosomes in the 9p21 region, one African and one European (Black_AFR+/−, n=5,136 / 17,451), or two European chromosomes (Black_AFR−/−, n=654 / n=2,101). The two subgroups among Hispanics included those with high probability of having either 1 or 2 African chromosomes (Hisp_AFR+/−|+/+, n=985 / 3,943) vs. those without any African ancestry in this region (Hisp_AFR−/−, n=5,298 / 20,556). Among SNPs in the high-risk region of 9p21 that reached genome wide significance among Whites, six SNPs with a minor allele frequency >10% in Black_AFR+/+ were used to infer haplotypes in the region. Each column along the x-axis represents a haplotype, named by the alleles of the six defining SNPs. a, frequency of 17 observed haplotypes overall in each population and by subgroup of Blacks and Hispanics. b-c, odds ratio (OR) of CAD and −log10(p-value) obtained through a haplotype trend regression analysis where AACATT is the reference haplotype in b and AGTTCA is the reference haplotype in c.
Fig. 4:
Fig. 4:. Pleiotropic assessment of 95 novel loci through extended phenome wide association of lead SNPs
Network plot of genotype-phenotype associations reaching significance at FDR<0.05 among 194,022 White participants in MVP without CAD for the lead SNPs in the 95 novel loci. Nodes are labelled either with the mapped gene for a lead SNP (purple font) or a phenotype tested in the PheWAS (black font). To highlight most pleiotropic SNPs and facilitate interpretation, the plot is restricted to lead SNPs associated with at least three distinct phenotypes. Distinct colors of nodes and edges represent a group of genotypes and phenotypes in the same dominant network. The thickness of the edges is correlated with the strength of the SNP-phenotype association (z-score). The size of the labels is dictated by the number of connections to phenotypes or genes and the strength of association. Network plot was created using Yifan Yu proportional and Atlas 2 layout algorithms as implemented in Gephi software.
Fig. 5:
Fig. 5:. Downstream analyses to prioritize systems, pathways, tissues, and cells relevant to CAD
a-c, MAGMA gene-property analyses to test relationship between expressed genes in specific cells or tissues and genetic associations (meta-analysis of Whites) as implemented in FUMA. The gene-property analysis is based on the regression model, Z∼β0+EtβE+AβA+BβB+ϵ where Z is a gene-based Z-score converted from the gene-based P-value, B is a matrix of technical confounders, Et is the gene expression value of a testing tissue type c and A is the average expression across tissue types in a data set. A one-sided test (βE>0) is performed testing the positive relationship between tissue specificity and genetic association of genes. Data in a are restricted to three mouse single-cell RNA-seq (sc-RNA) datasets involving a broad range of cell types/organs while data in b are restricted to human datasets mostly involving the brain but also the pancreas and blood. Results show only independent cell-type associations based on within-dataset conditional analyses ordered by p-value across datasets. Data in c shows results for 54 specific tissue from the GTEx RNA-seq dataset v8 in order of p-value significance with red bars and font highlighting statistically significant tissues after adjusting for multiple testing (horizontal black dashed line) while remaining tissues are in blue. d-f, DEPICT following standard algorithm on the same GWAS used for MAGMA analyses in a-c. A tissue/cell type expression matrix was constructed by averaging gene expression levels of microarray samples with the same Medical Subject Heading tissue and cell type annotation. In this matrix, each column includes relative and normalized expression values of genes across 209 tissue/cell types. Enrichment in a tissue/cell type is then quantified by summing z-scores of the expression of genes with variants reaching genome wide significance in our meta-analysis of Whites. Z-scores are adjusted for confounding factors using 200 precomputed null GWAS in the Diabetes Genetics Initiative (DGI). Type 1 error rates were calculated by replacing null GWAS in DGI with simulated GWAS with positive signals but no underlying biological basis. DEPICT results are separated into d, cells e, tissues, and f, systems. −log10(p-value) for a false discovery rate (FDR) of <0.05 is demarcated by red dashed line while the FDR <0.2 threshold is shown in blue. Only cells/tissues reaching an FDR<0.2 are labelled.
Fig. 6:
Fig. 6:. Testing of externally derived polygenic risk scores and new multi-population scores in the Million Veteran Program
a, Performance of four externally derived and previously validated polygenic risk scores (PRS) in Whites, Blacks, and Hispanics, respectively, included in the MVP GWAS (see Fig. 1a for sample sizes of the three cohorts and methods for details on the origins of these PRS). Odds ratios and 95% confidence intervals per standard deviation (SD) increase in PRS are shown derived from logistic regression. In addition to all cases combined, subgroups of incident only cases (after enrollment), severe cases with evidence of either a myocardial infarction (AMI) and/or a revascularization (Revasc) procedure, and younger vs older onset cases (divided by median age of onset) were tested. b, externally derived PRS were tested for burden of coronary atherosclerosis among 25,600 Whites who underwent coronary angiography using multinomial logistic regression. Subjects with normal coronaries on angiography serve as the reference group and are compred to each of four progressively higher burdens of disease including non-obstructive disease (‘Non-obs.’), 1-vessel disease (1V), 2-vessel disease (2V), and 3-vessel or left main disease (3V/LM). Odds ratio and 95% confidence intervals are reported per SD increase in PRS. c, The best performing score in a and b, the metaGRS, was tested for association with Phecodes, clinical labs and anthropomorphic measures, as well as selected components of the baseline questionnaires among up to 164,534 Whites with no EHR evidence of atherosclerosis related complications at the end of EHR follow up. P-value are derived from a t-test implemented in the GLM and LM functions in R and are two-sided. d, New multi-population PRSs were developed using the pruning and thresholding strategy applied to the multi-population meta-analysis. These PRSs were tuned on an independent set of prevalent cases and controls in MVP, using population-specific tuning. Score performance of each score is shown in an independent set of incident cases and controls. Odds ratio and 95% confidence intervals are reported per SD increase in PRS and compared to performance of the metaGRS.

Similar articles

Cited by

References

    1. Roth GA et al. Global Burden of Cardiovascular Diseases and Risk Factors, 1990–2019: Update From the GBD 2019 Study. J Am Coll Cardiol 76, 2982–3021 (2020). - PMC - PubMed
    1. Statistics;, N.C.f.H. Health, United States Spotlight: Racial and Ethnic Disparities in Heart Disease (Centers for Disease Control and Prevention, 2019).
    1. Churchwell K et al. Call to Action: Structural Racism as a Fundamental Driver of Health Disparities: A Presidential Advisory From the American Heart Association. Circulation 142, e454–e468 (2020). - PubMed
    1. Popejoy AB & Fullerton SM Genomics is failing on diversity. Nature 538, 161–164 (2016). - PMC - PubMed
    1. Martin AR et al. Clinical use of current polygenic risk scores may exacerbate health disparities. Nat Genet 51, 584–591 (2019). - PMC - PubMed

Publication types

MeSH terms

Grants and funding