. 2022 Aug;24(8):1291-1305.
doi: 10.1038/s41556-022-00962-4. Epub 2022 Aug 1.

EGFR ligand shifts the role of EGFR from oncogene to tumour suppressor in EGFR-amplified glioblastoma by suppressing invasion through BIN3 upregulation

Affiliations

EGFR ligand shifts the role of EGFR from oncogene to tumour suppressor in EGFR-amplified glioblastoma by suppressing invasion through BIN3 upregulation

Gao Guo et al. Nat Cell Biol. 2022 Aug.

Abstract

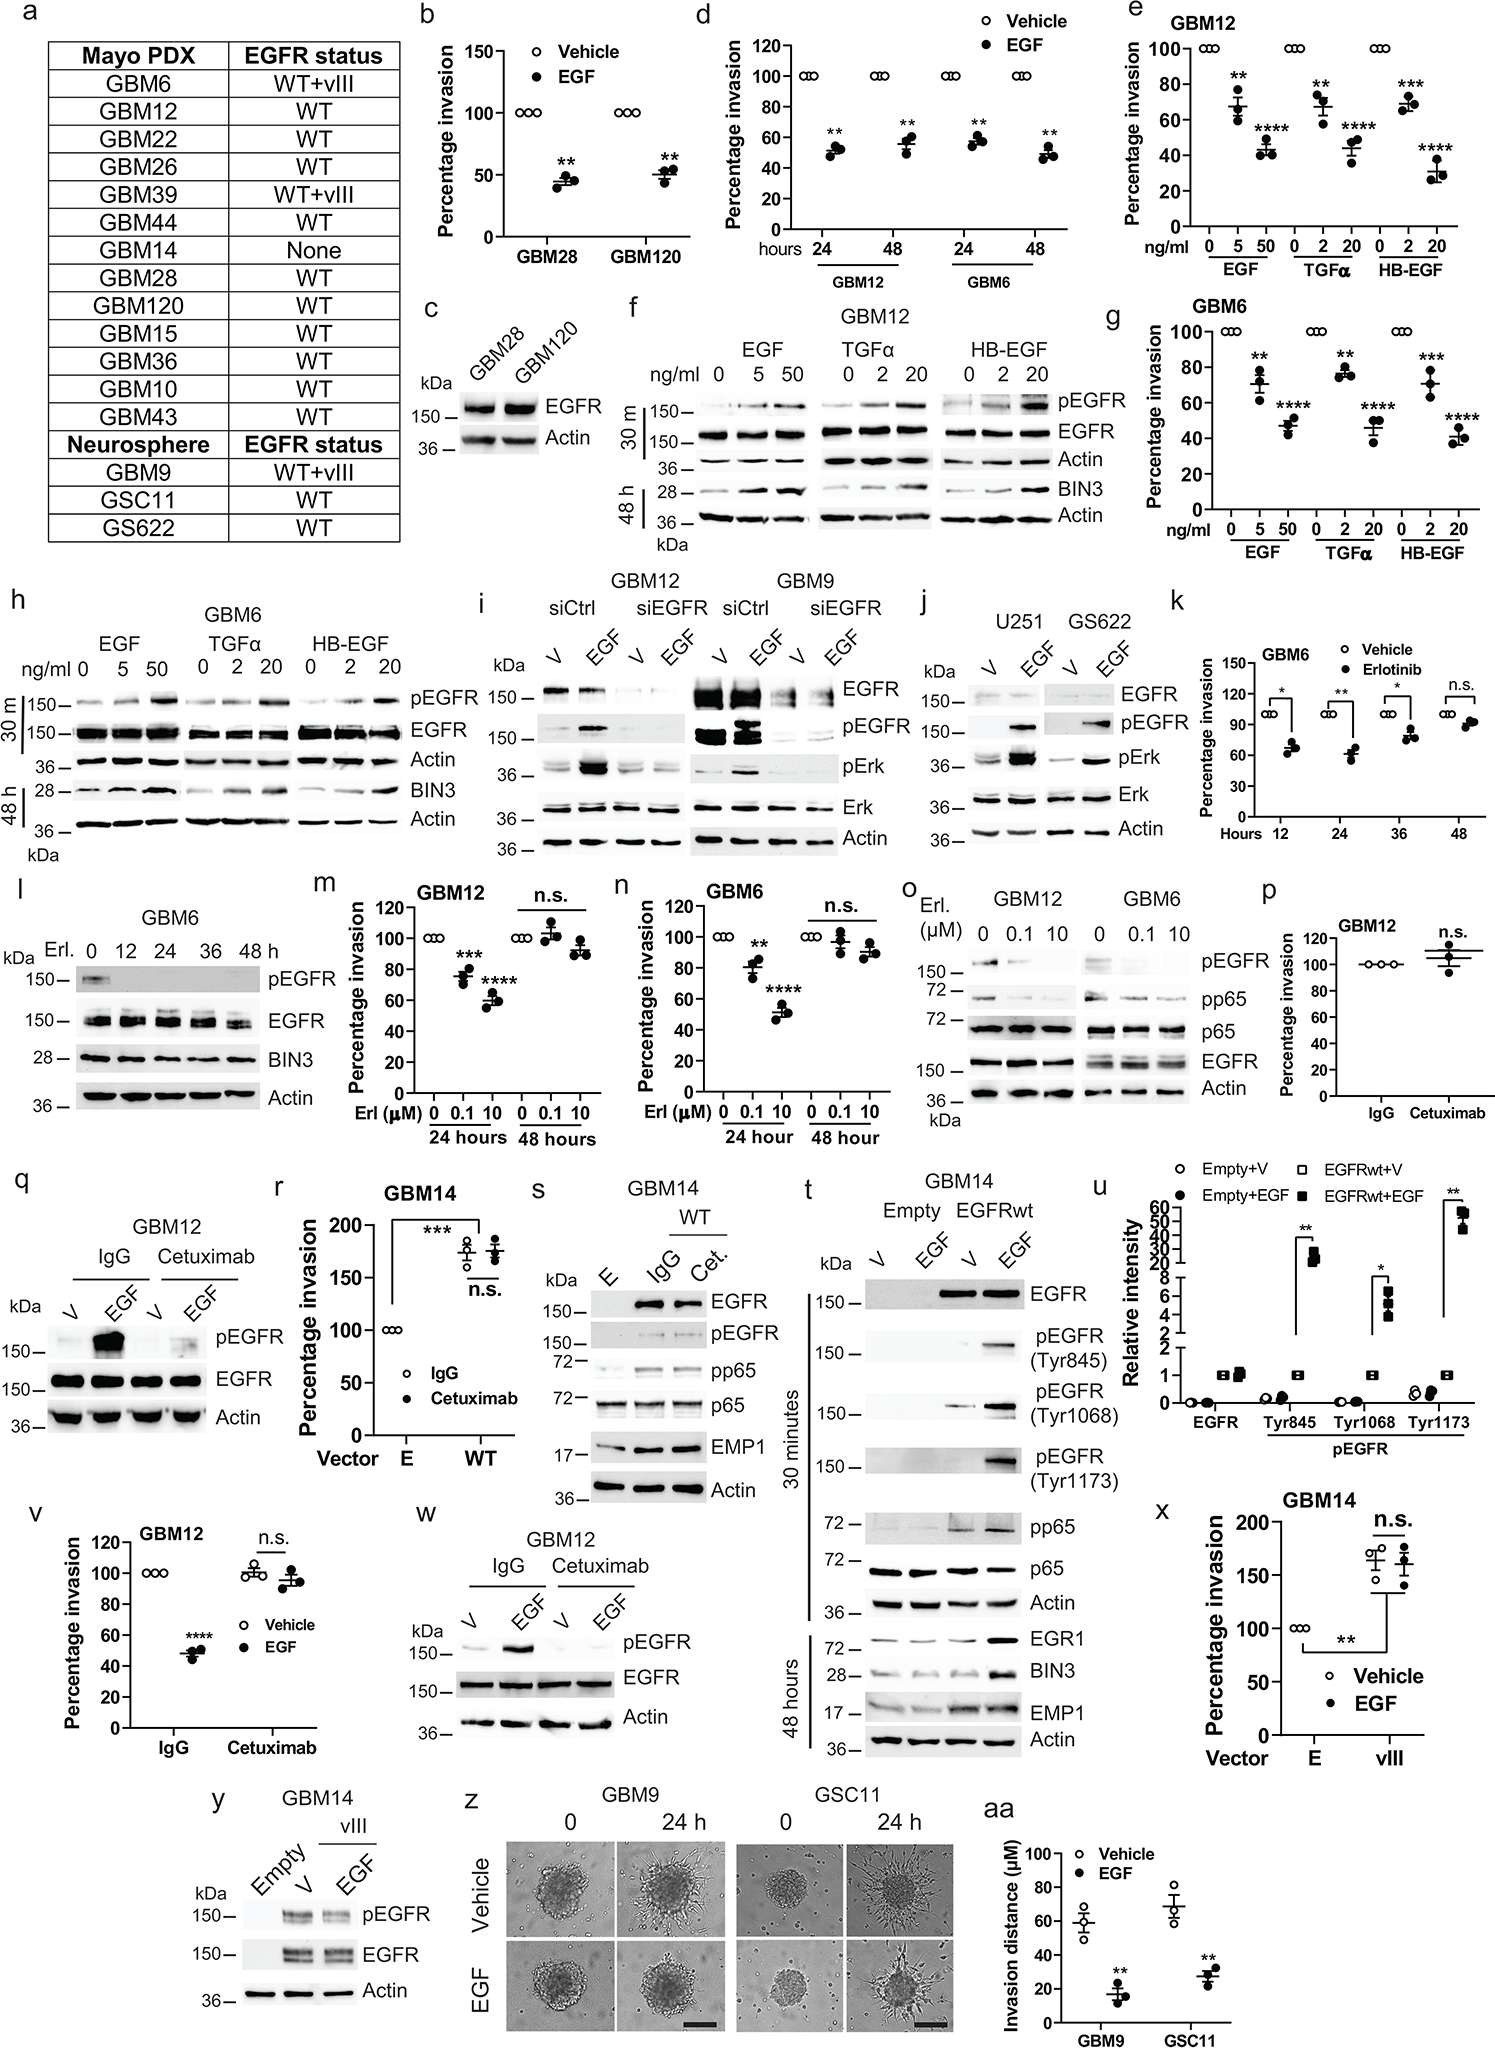
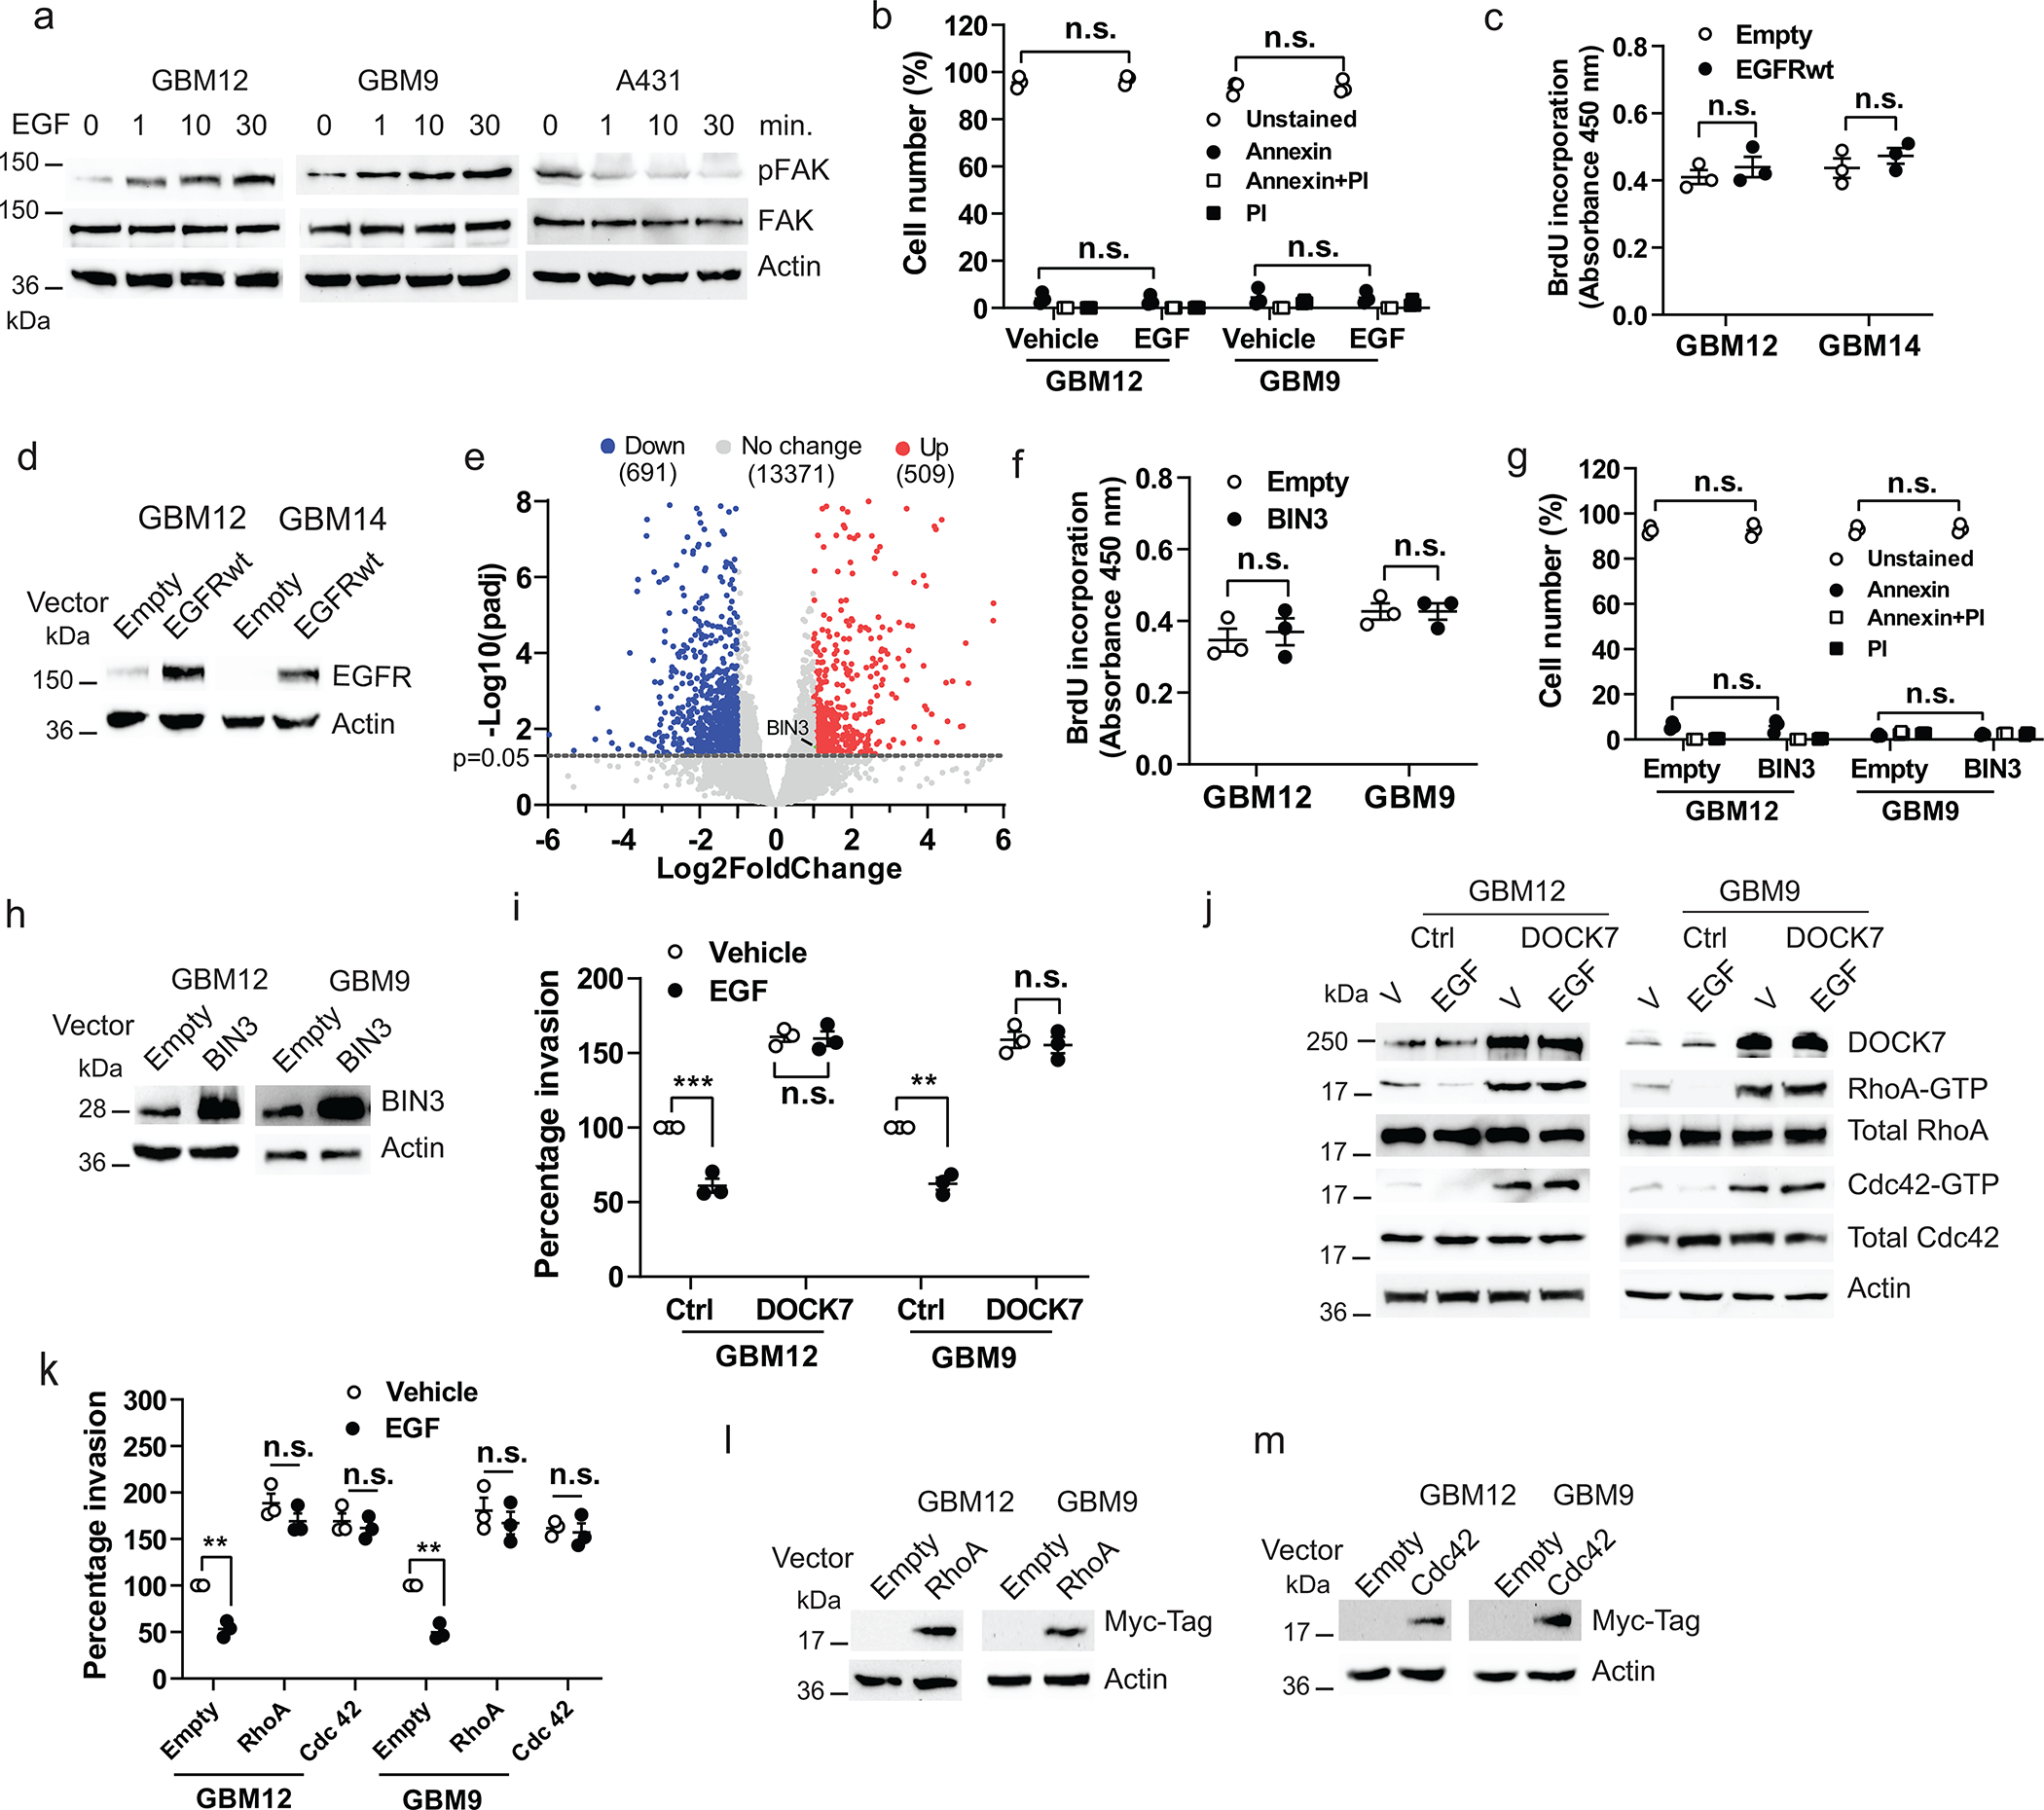
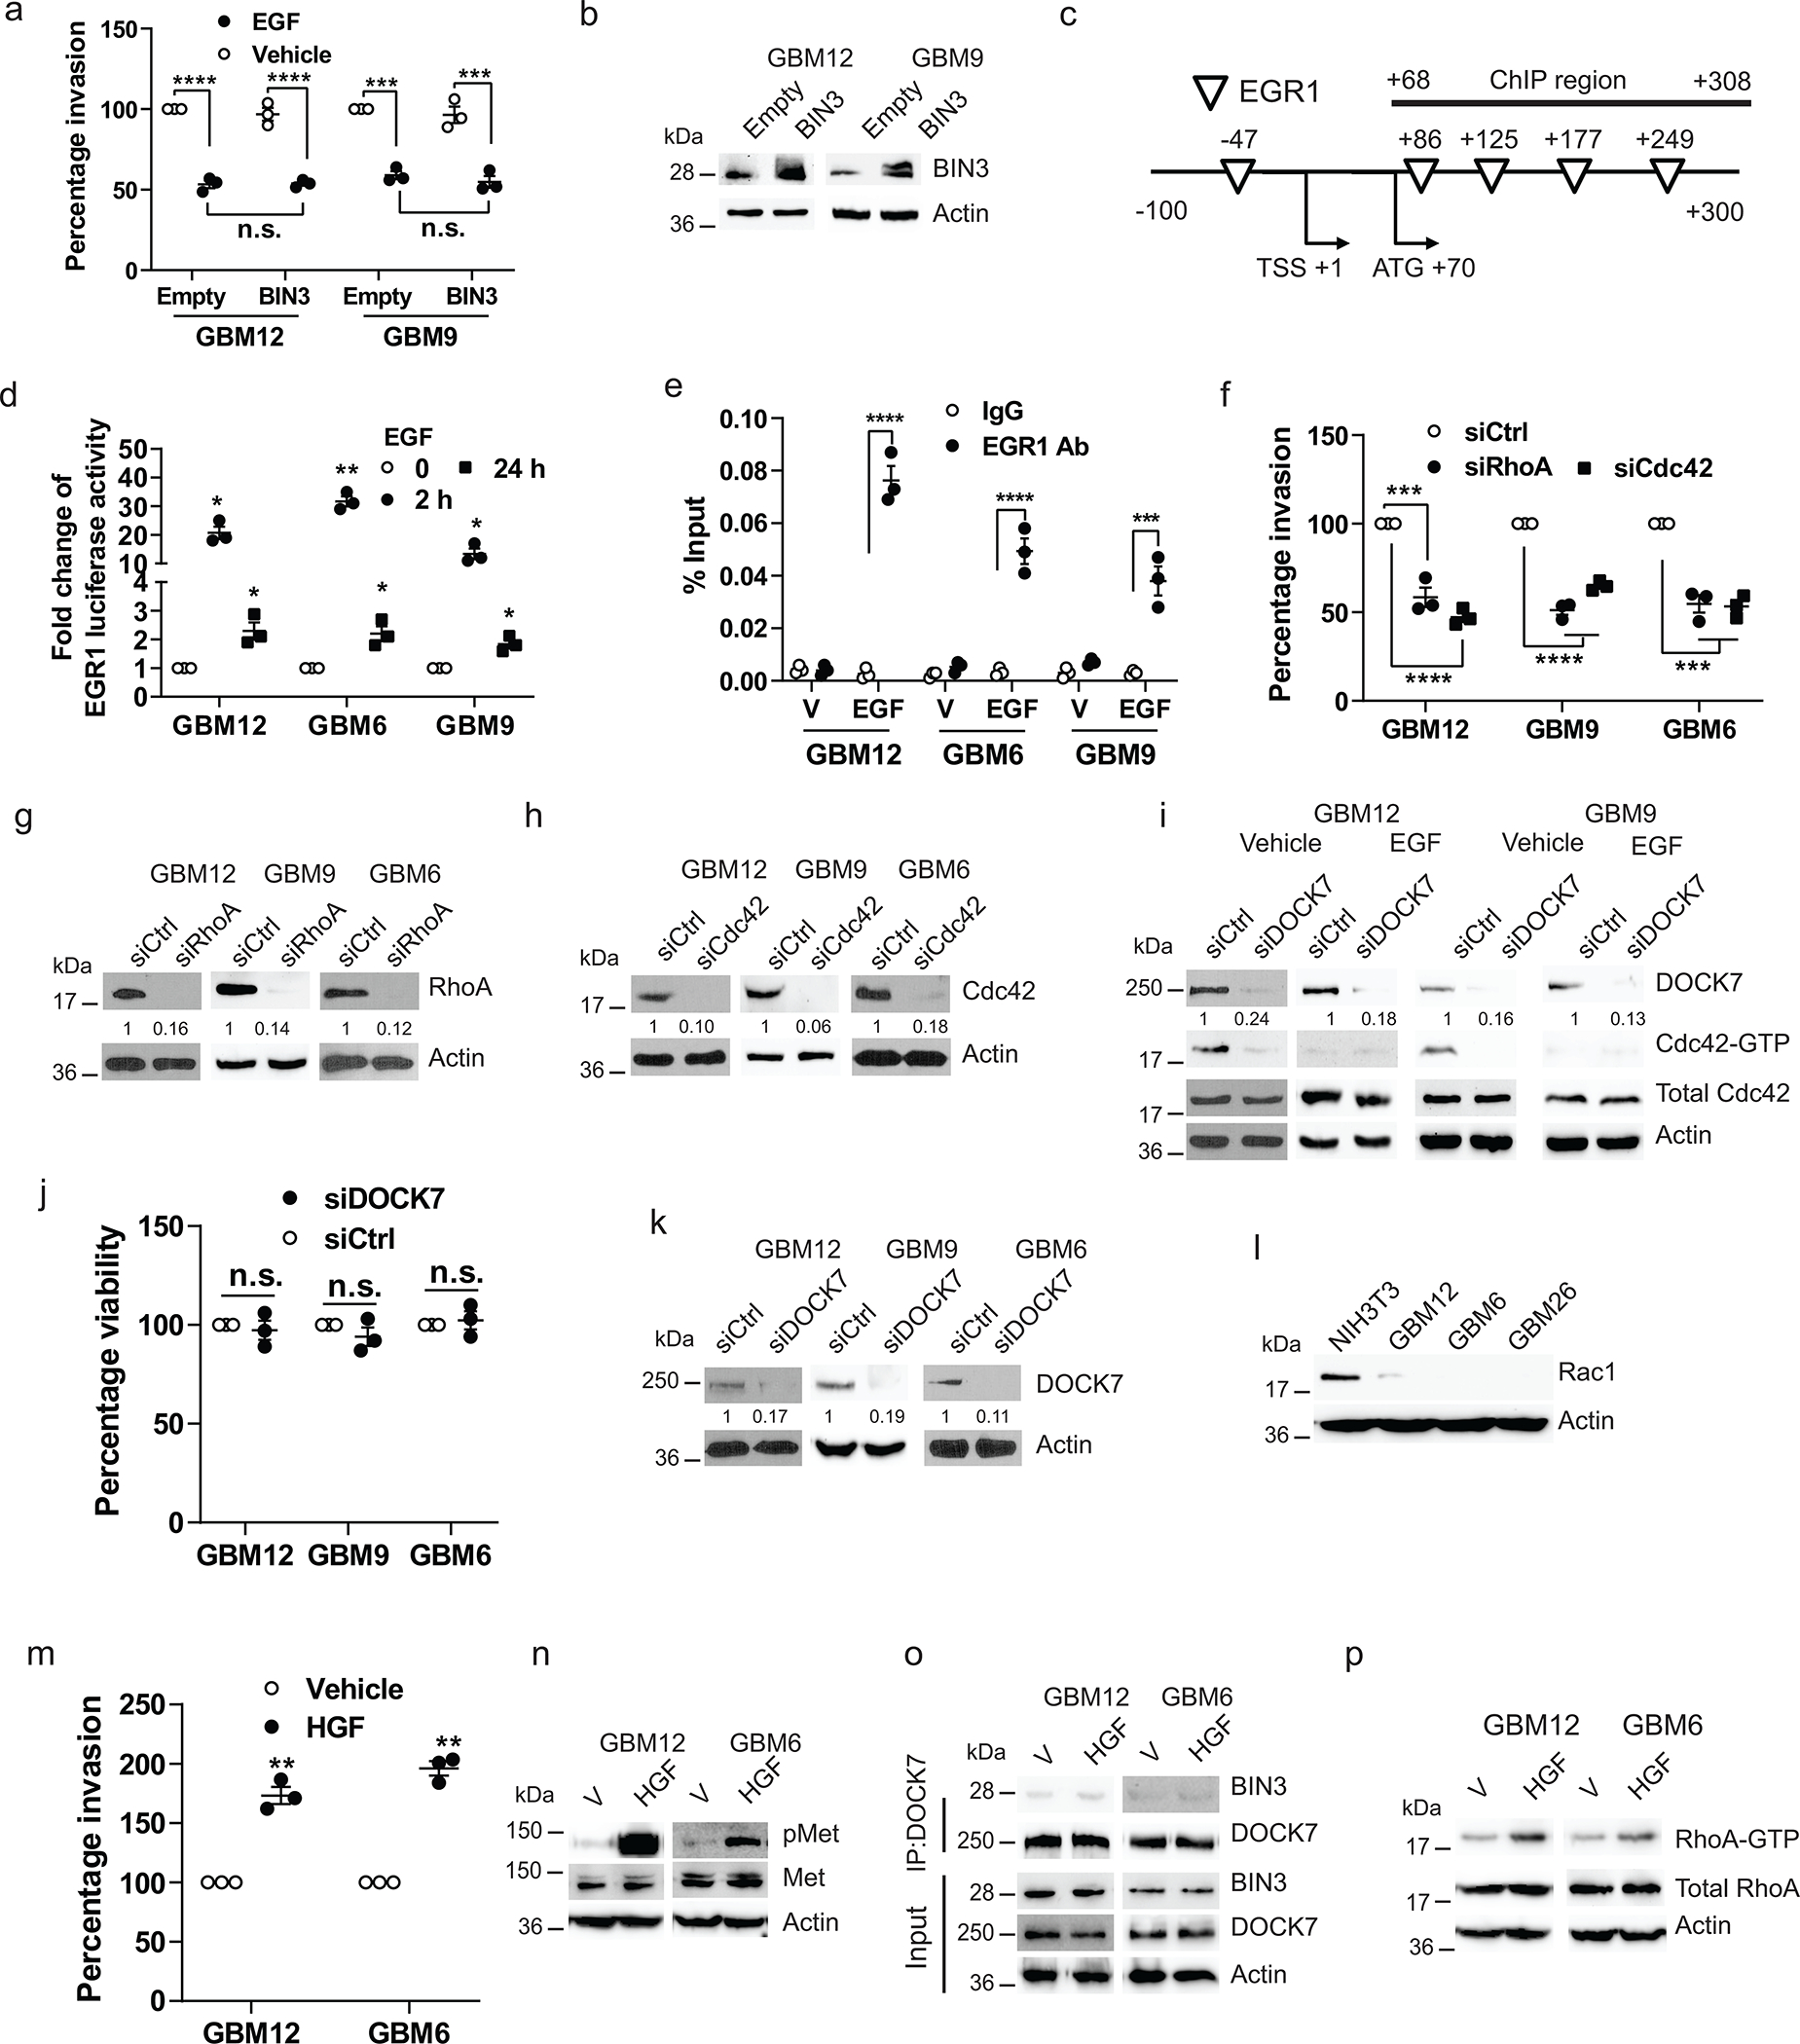
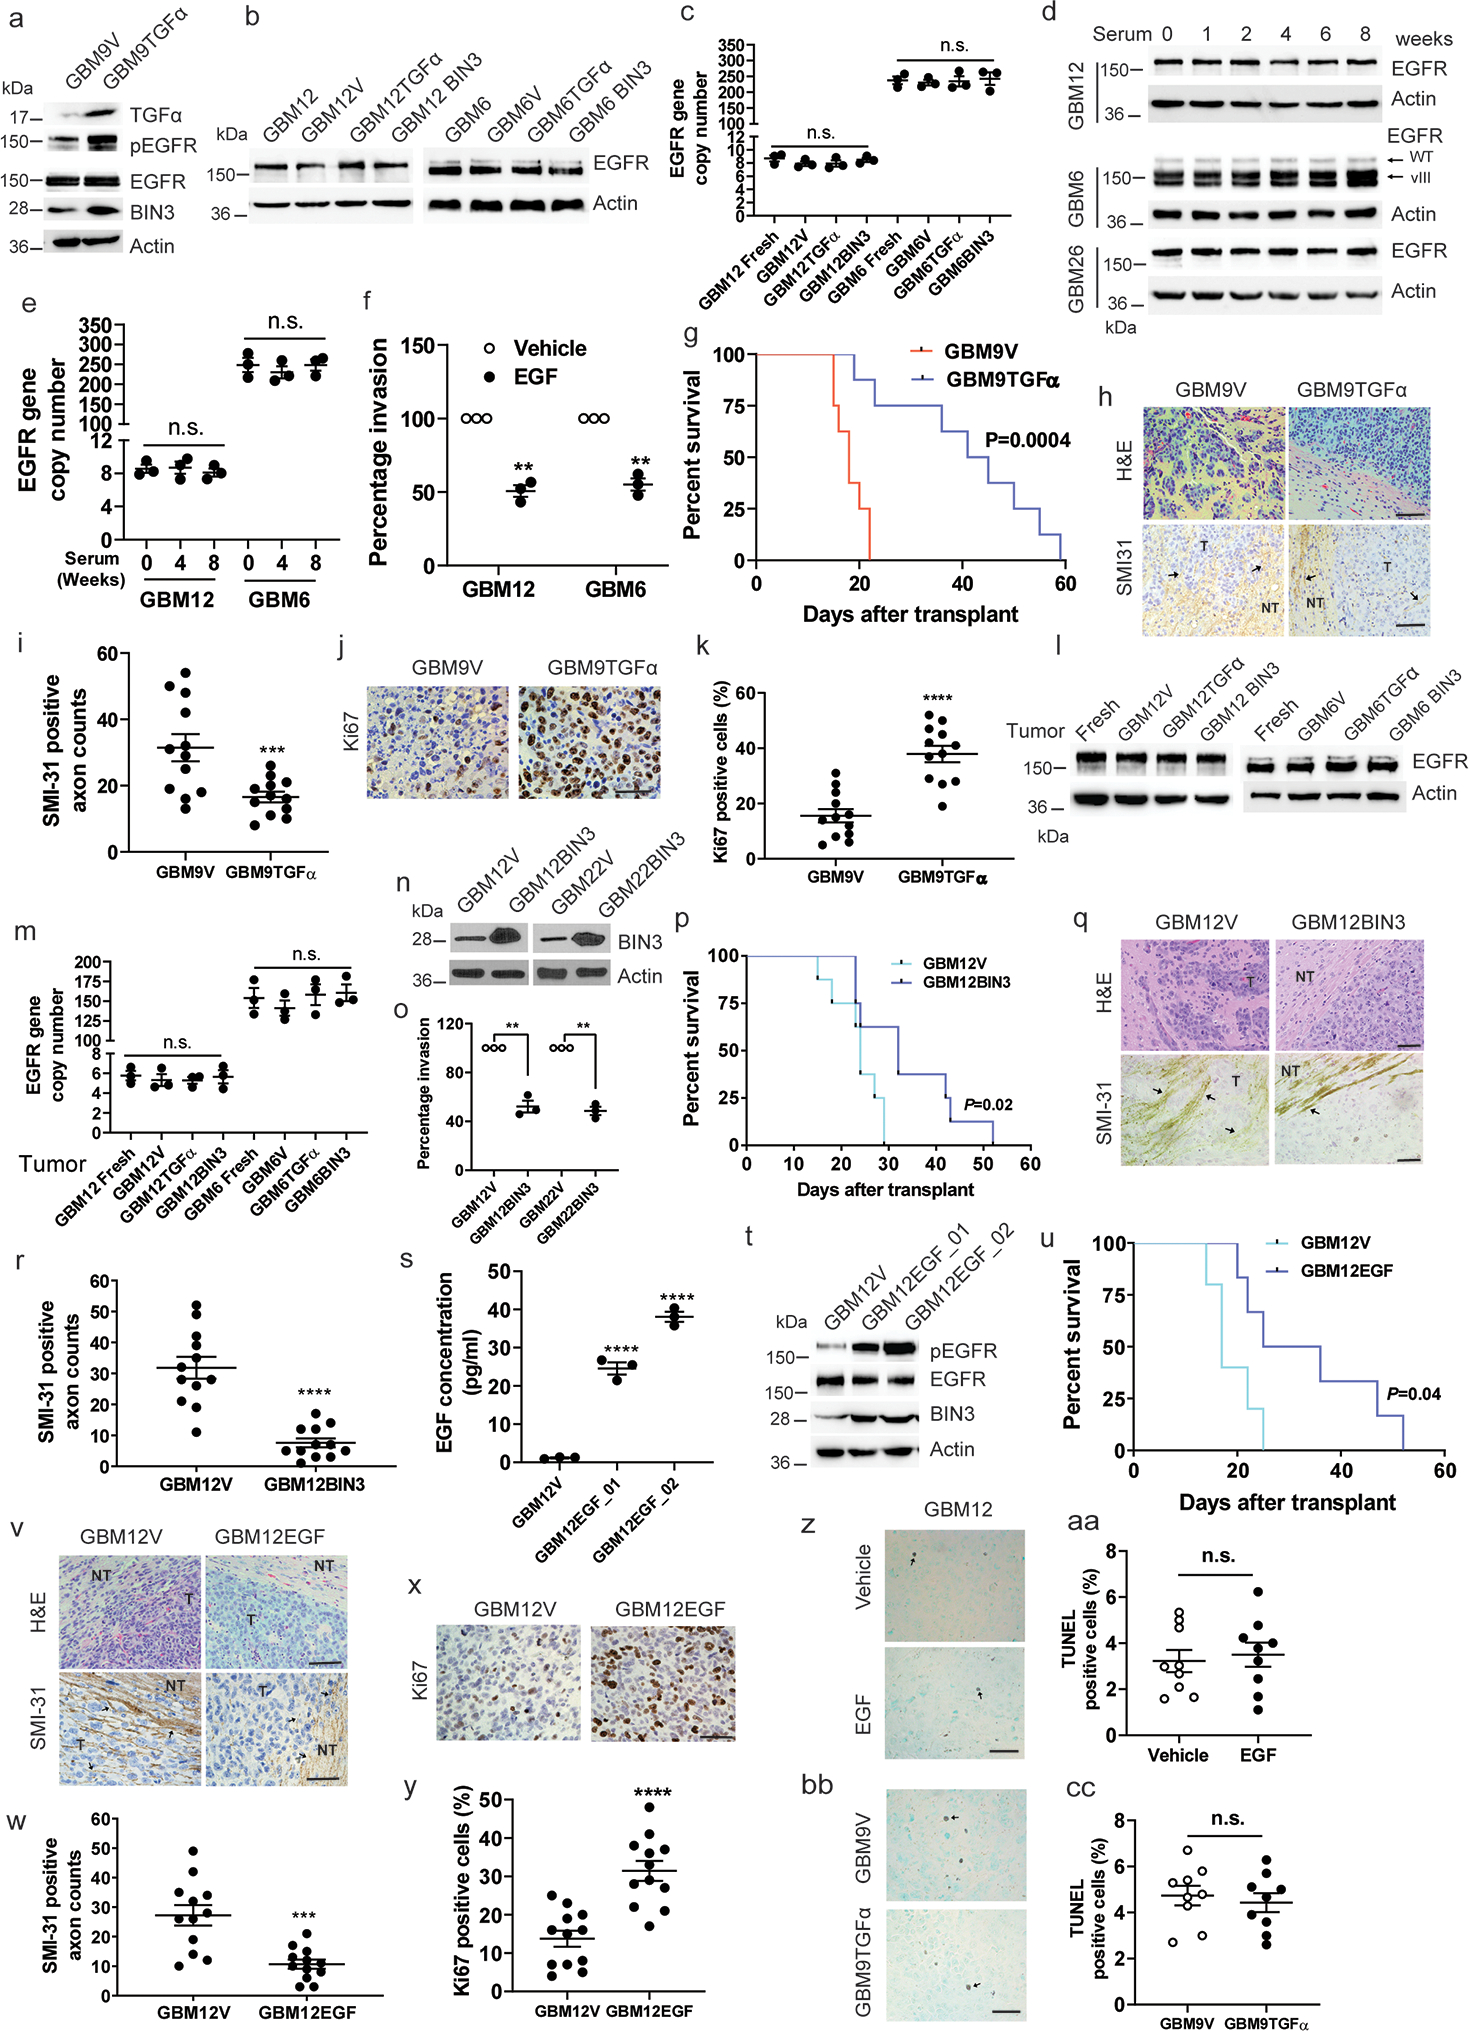
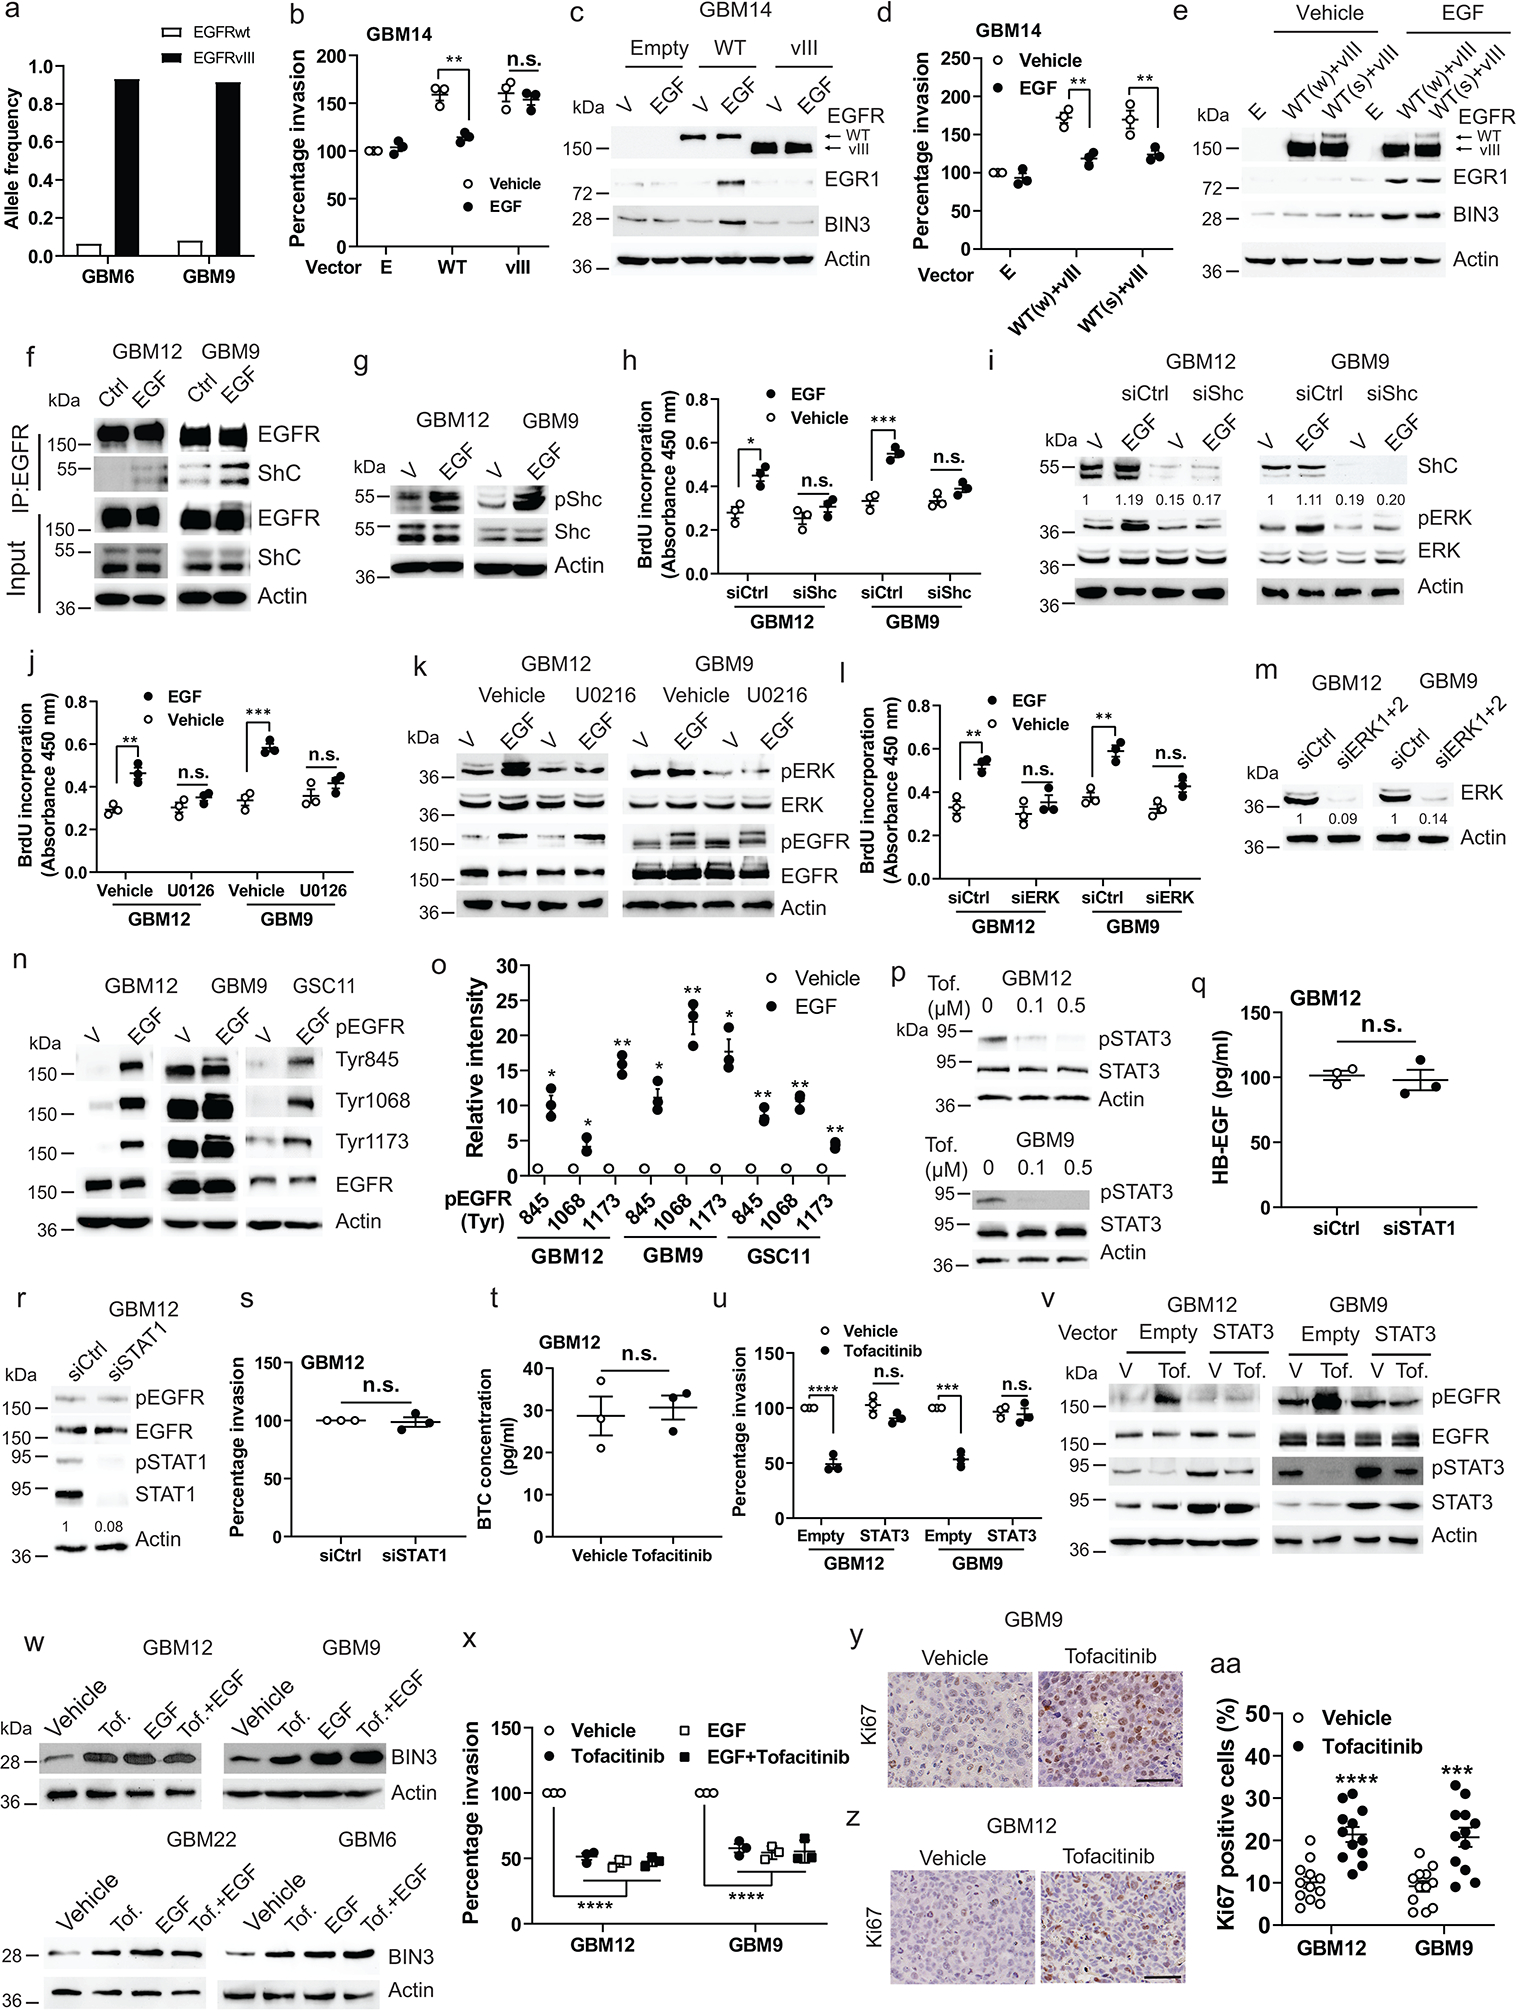
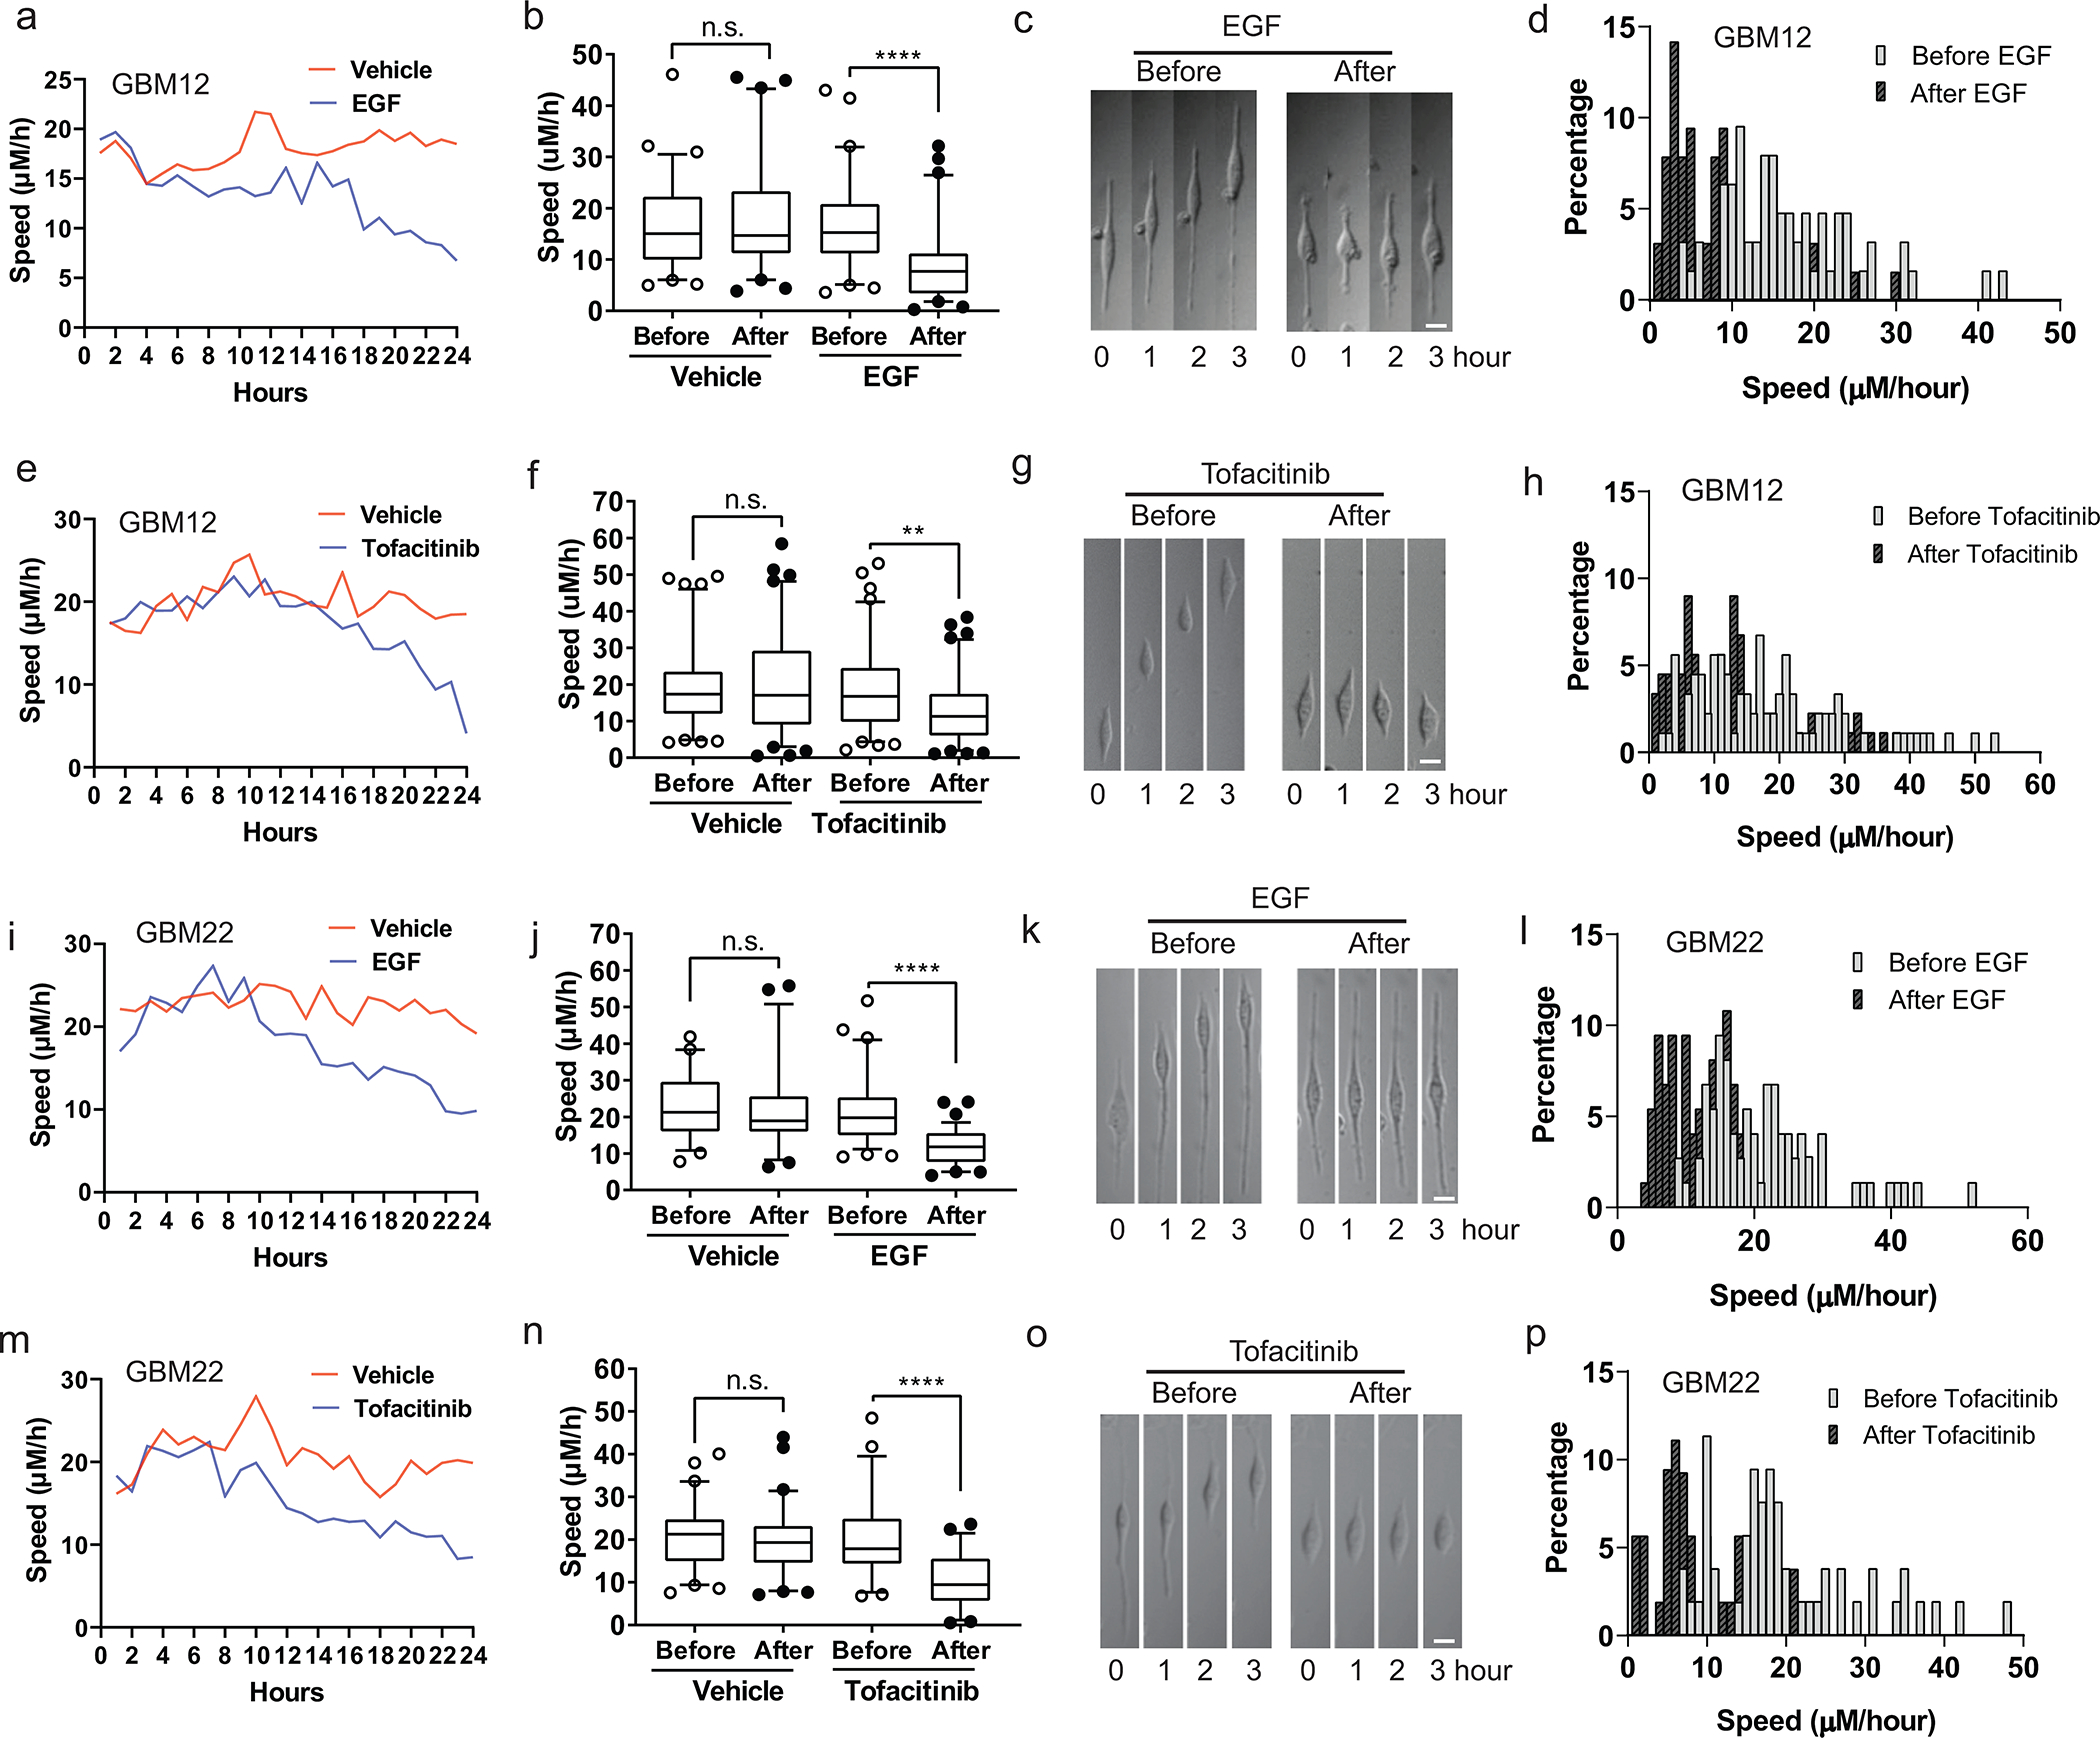
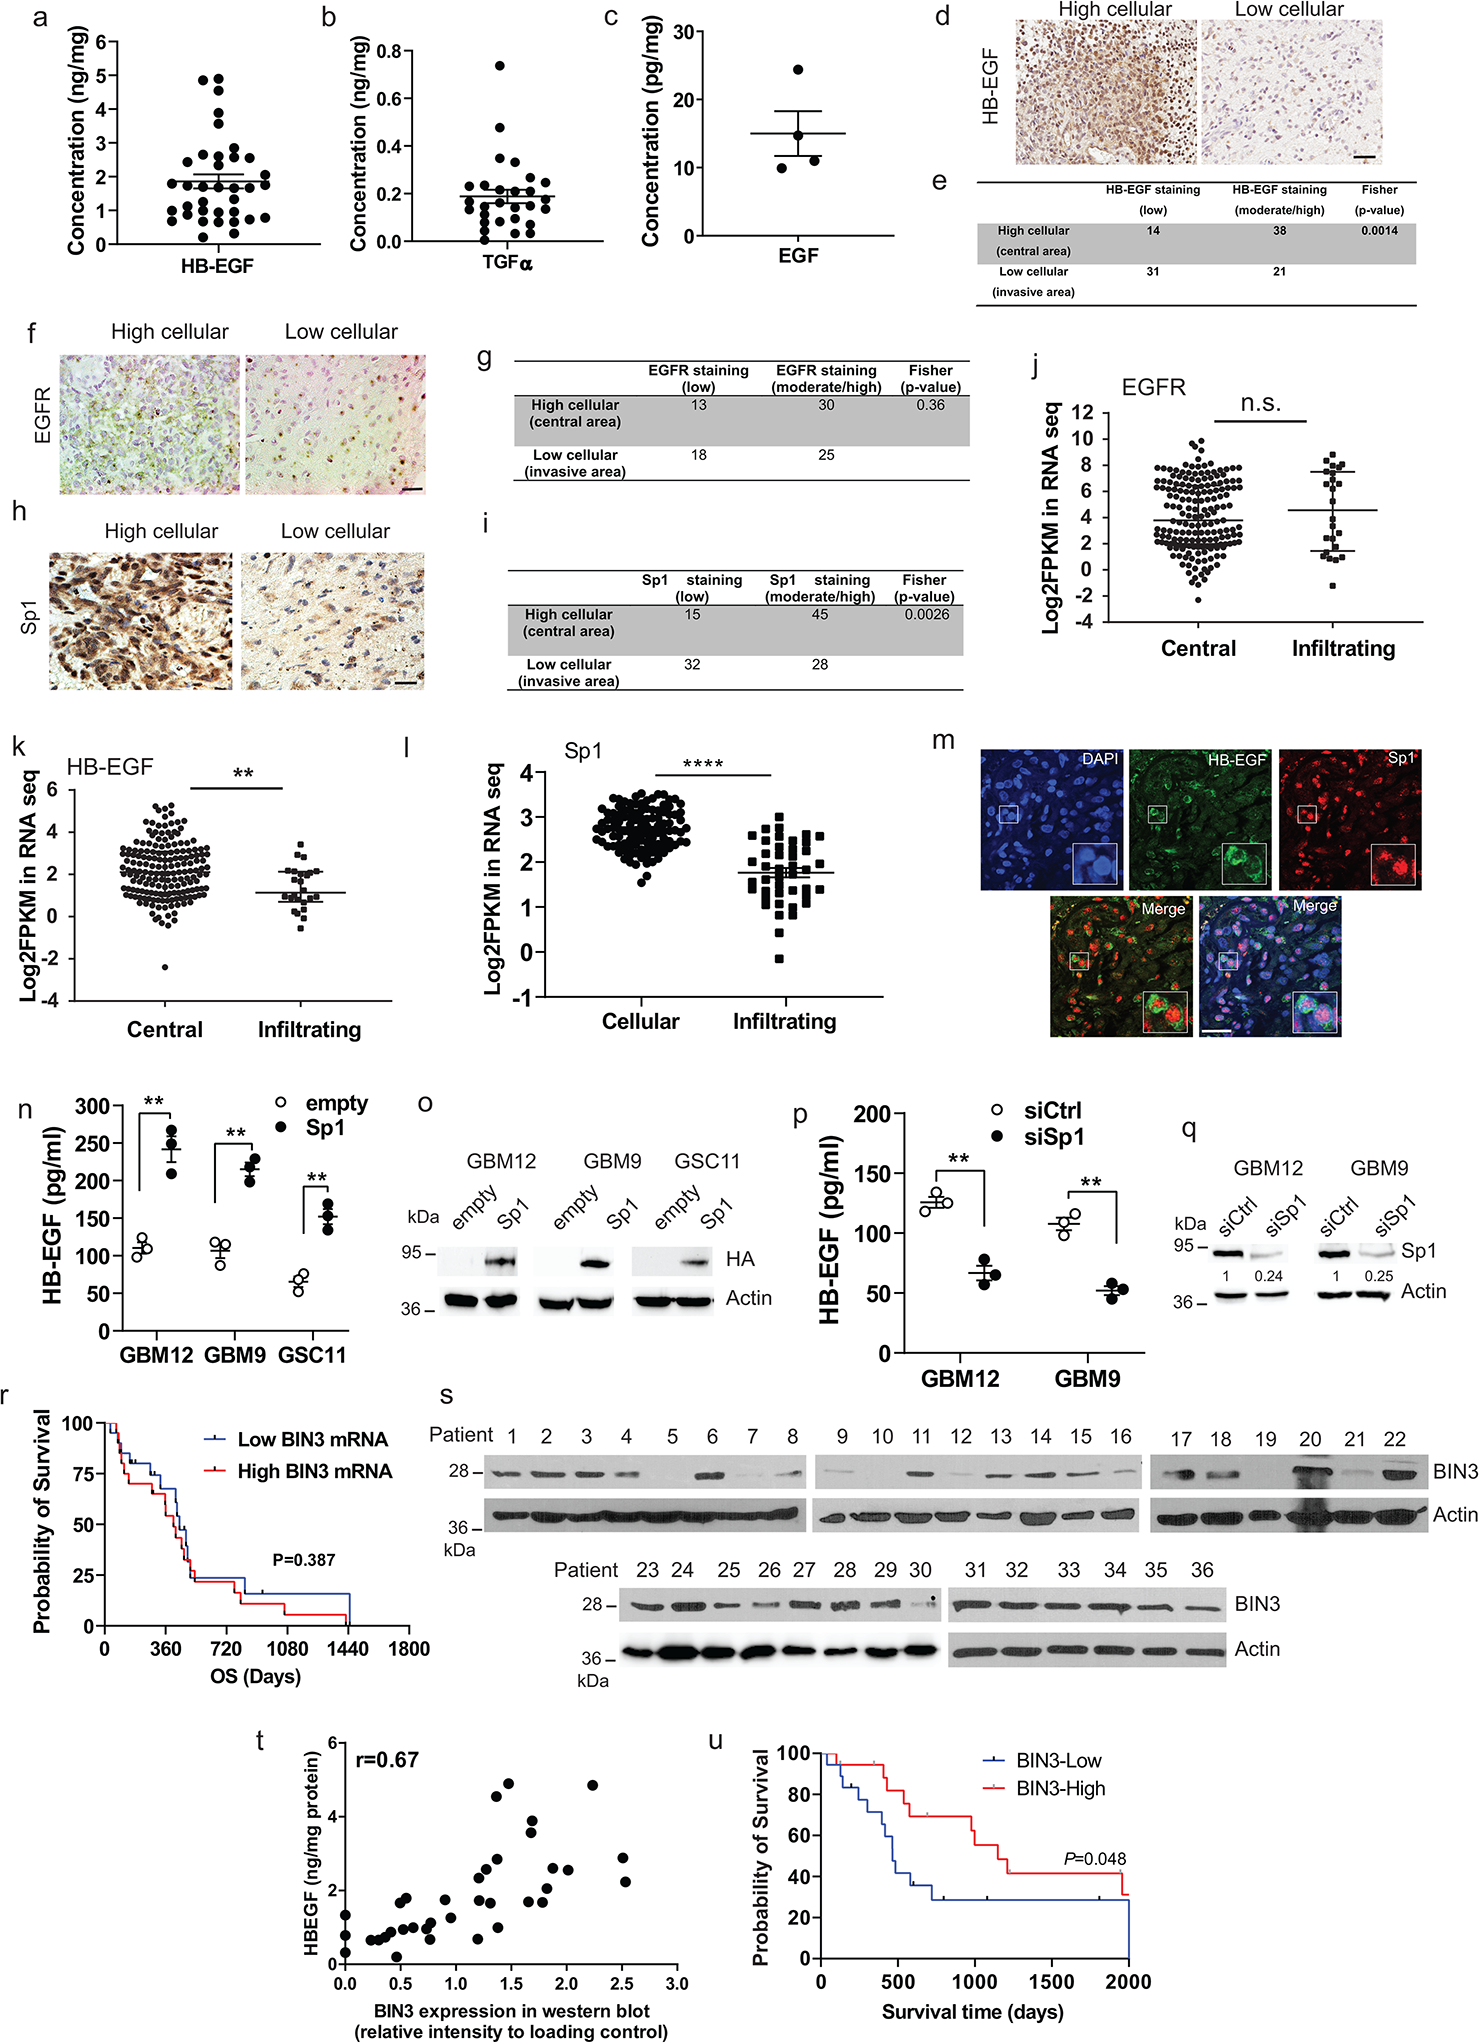
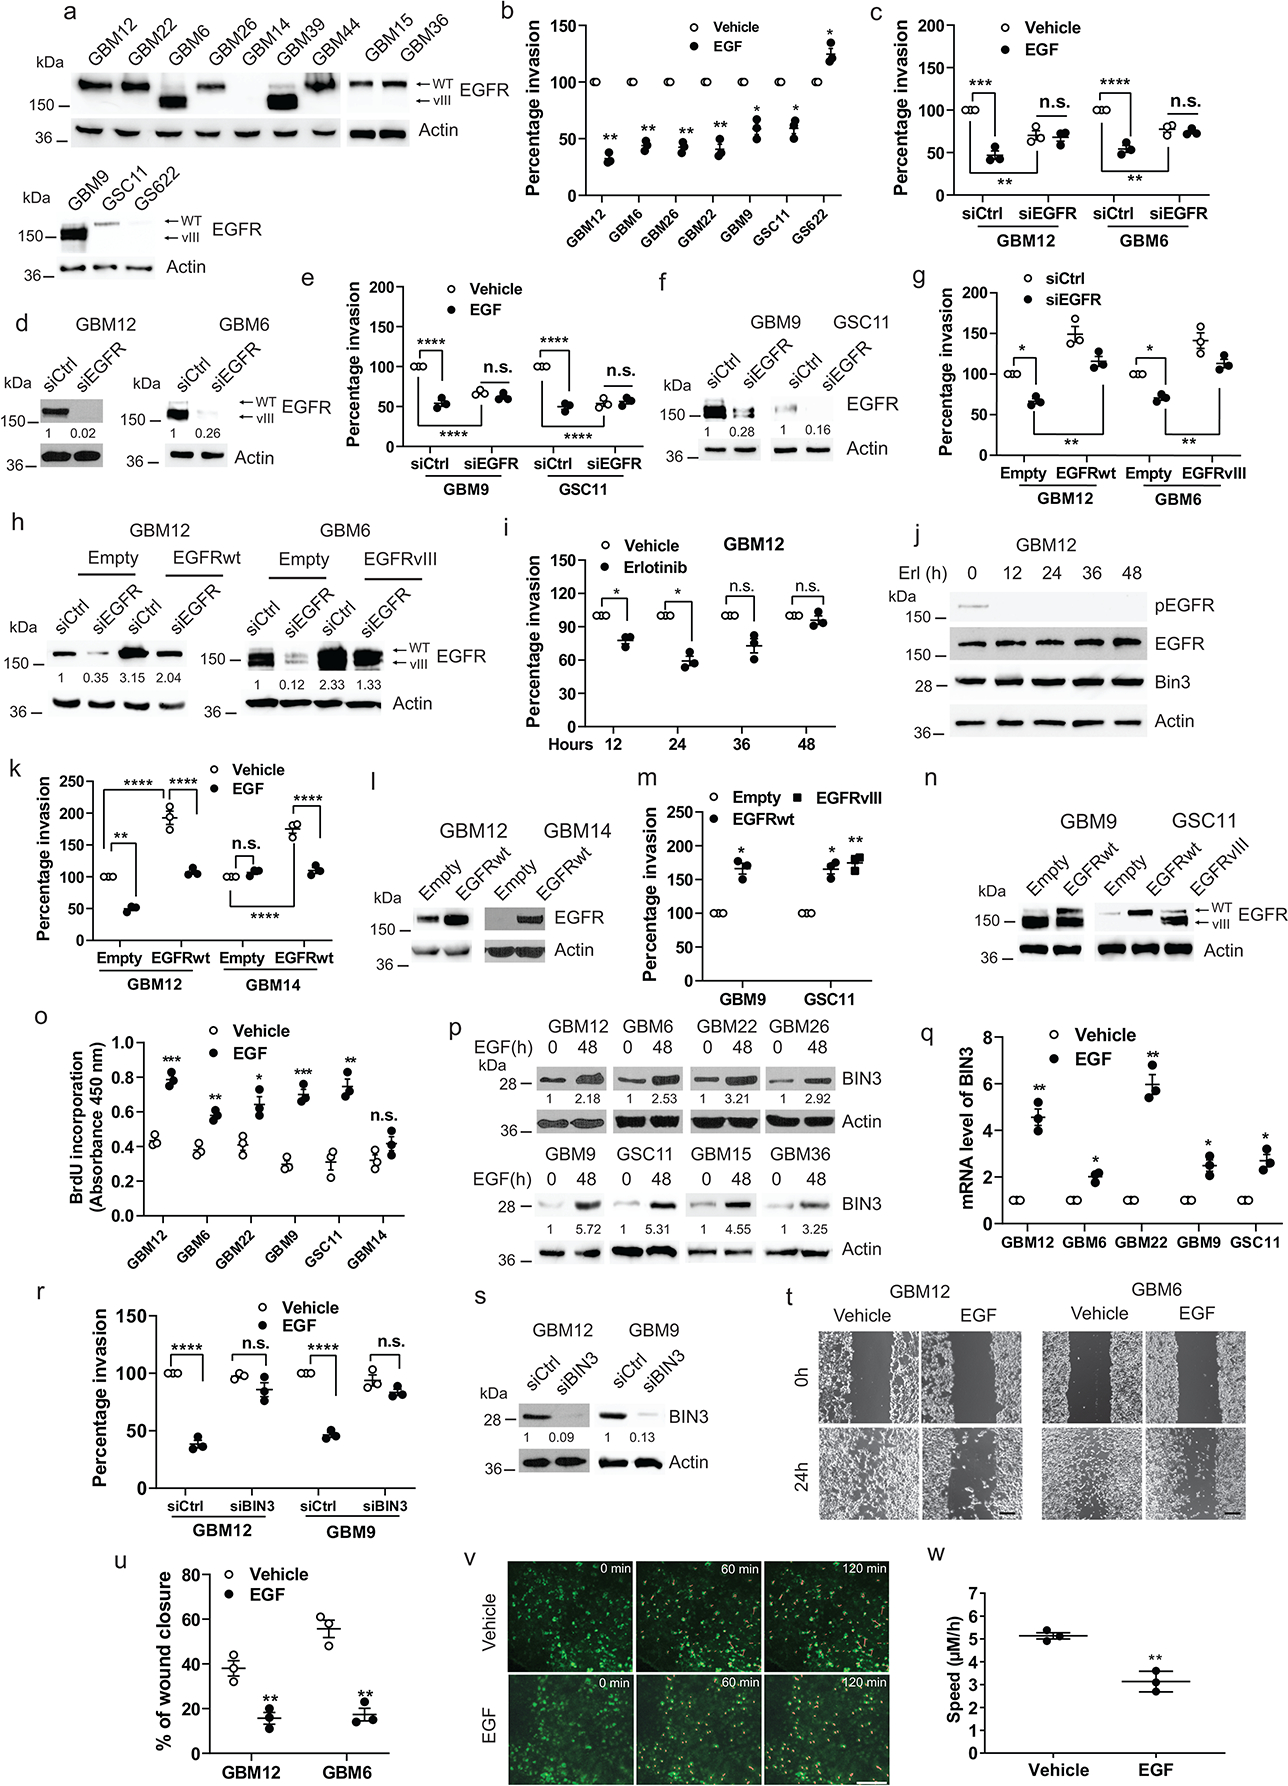
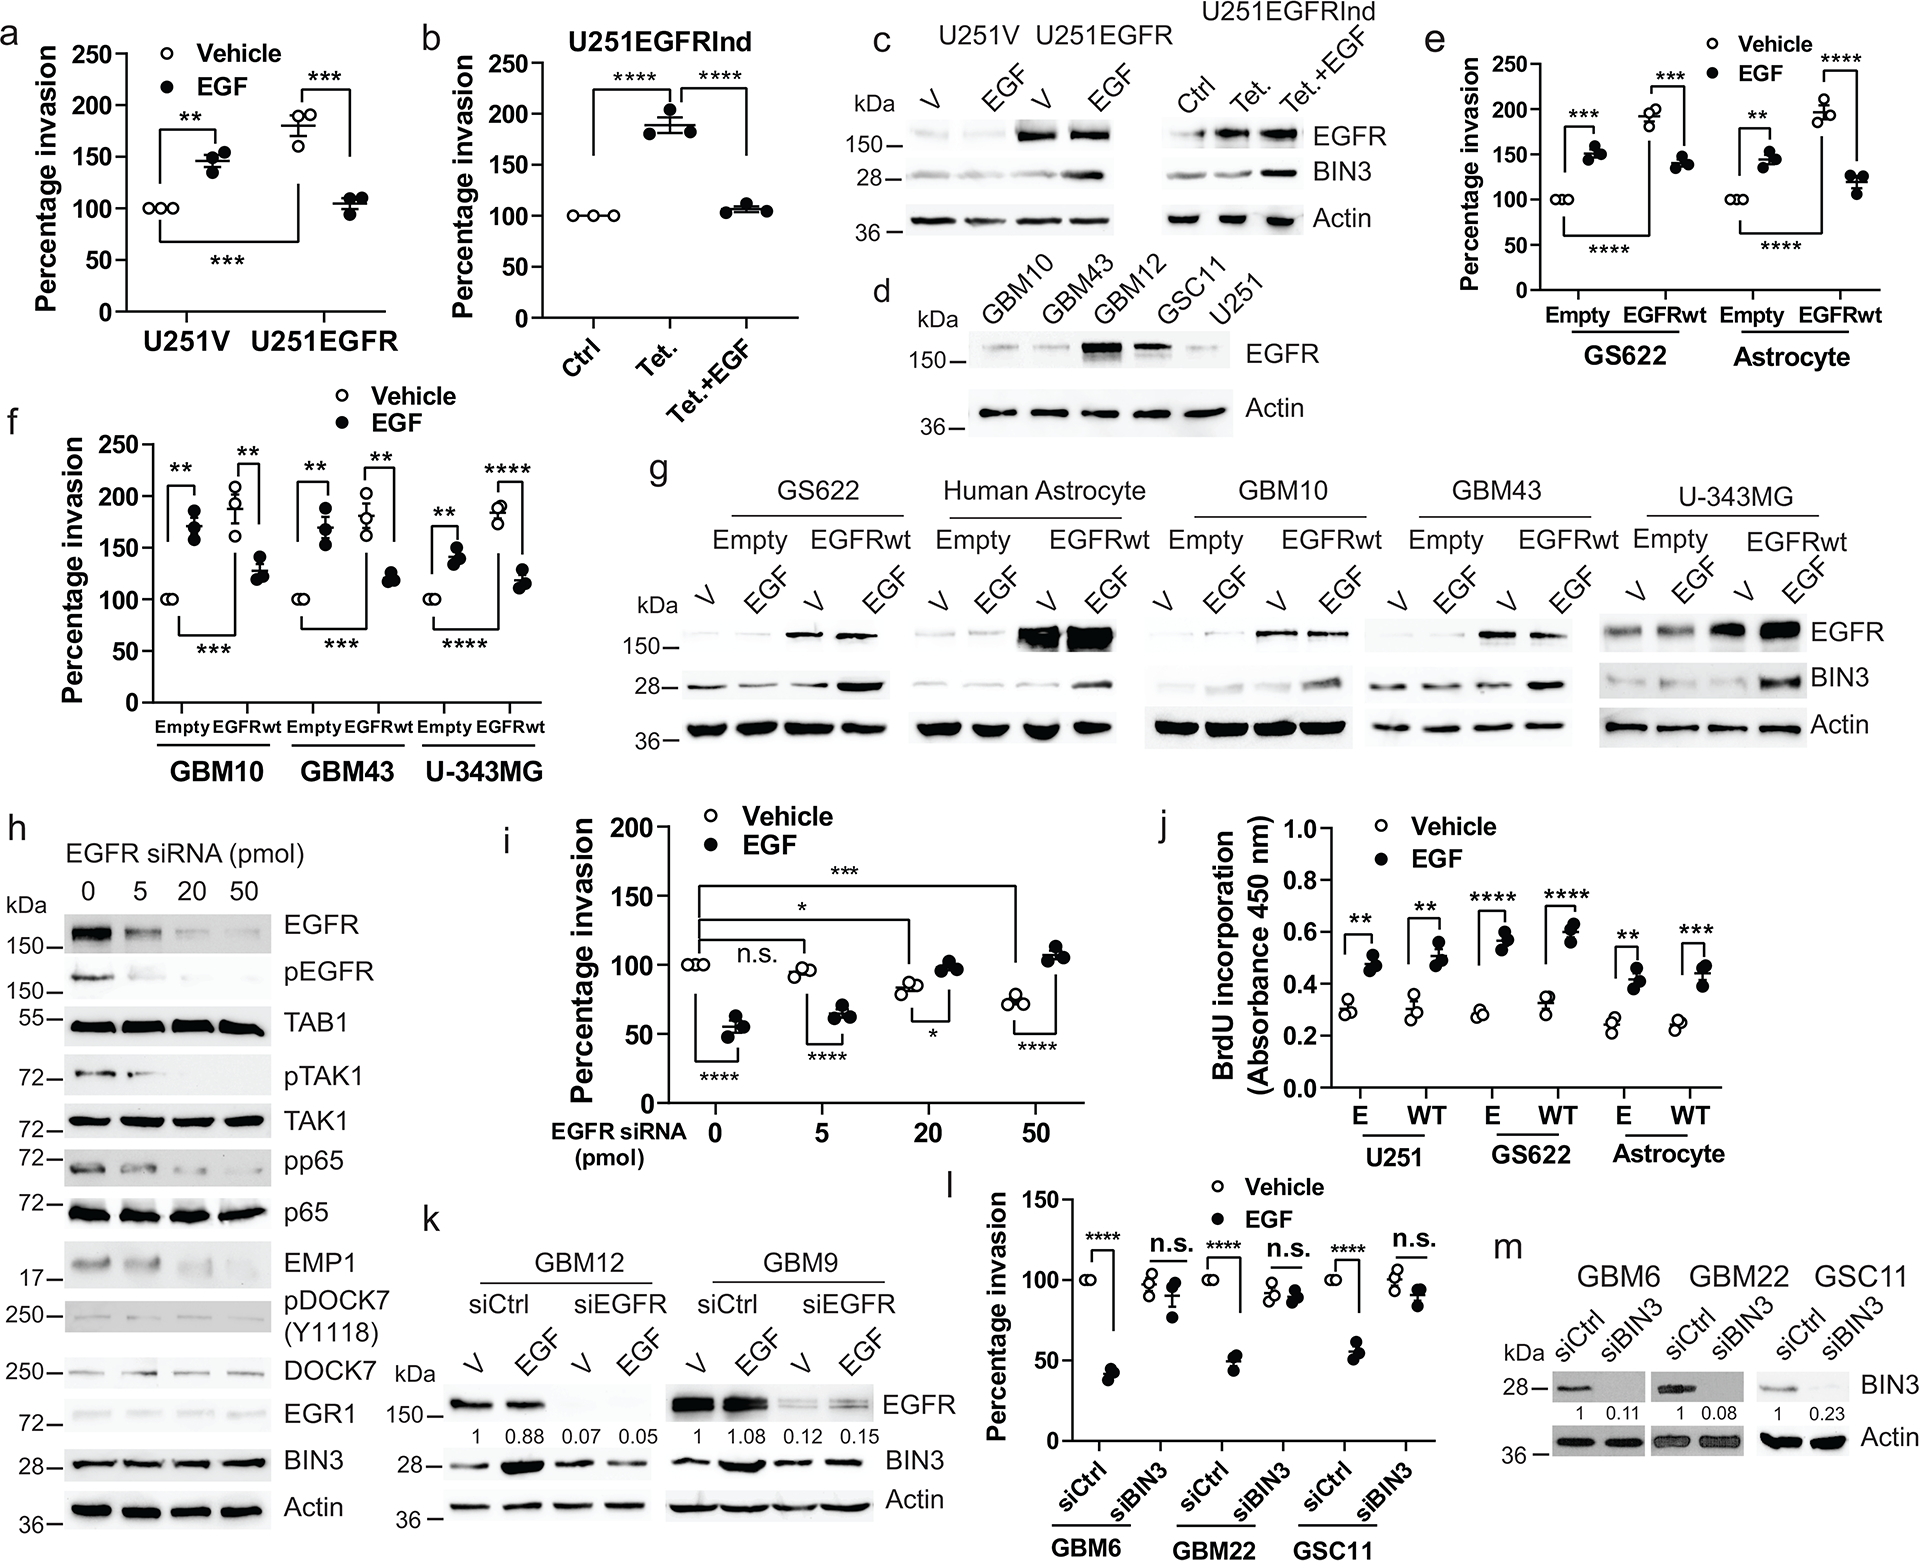
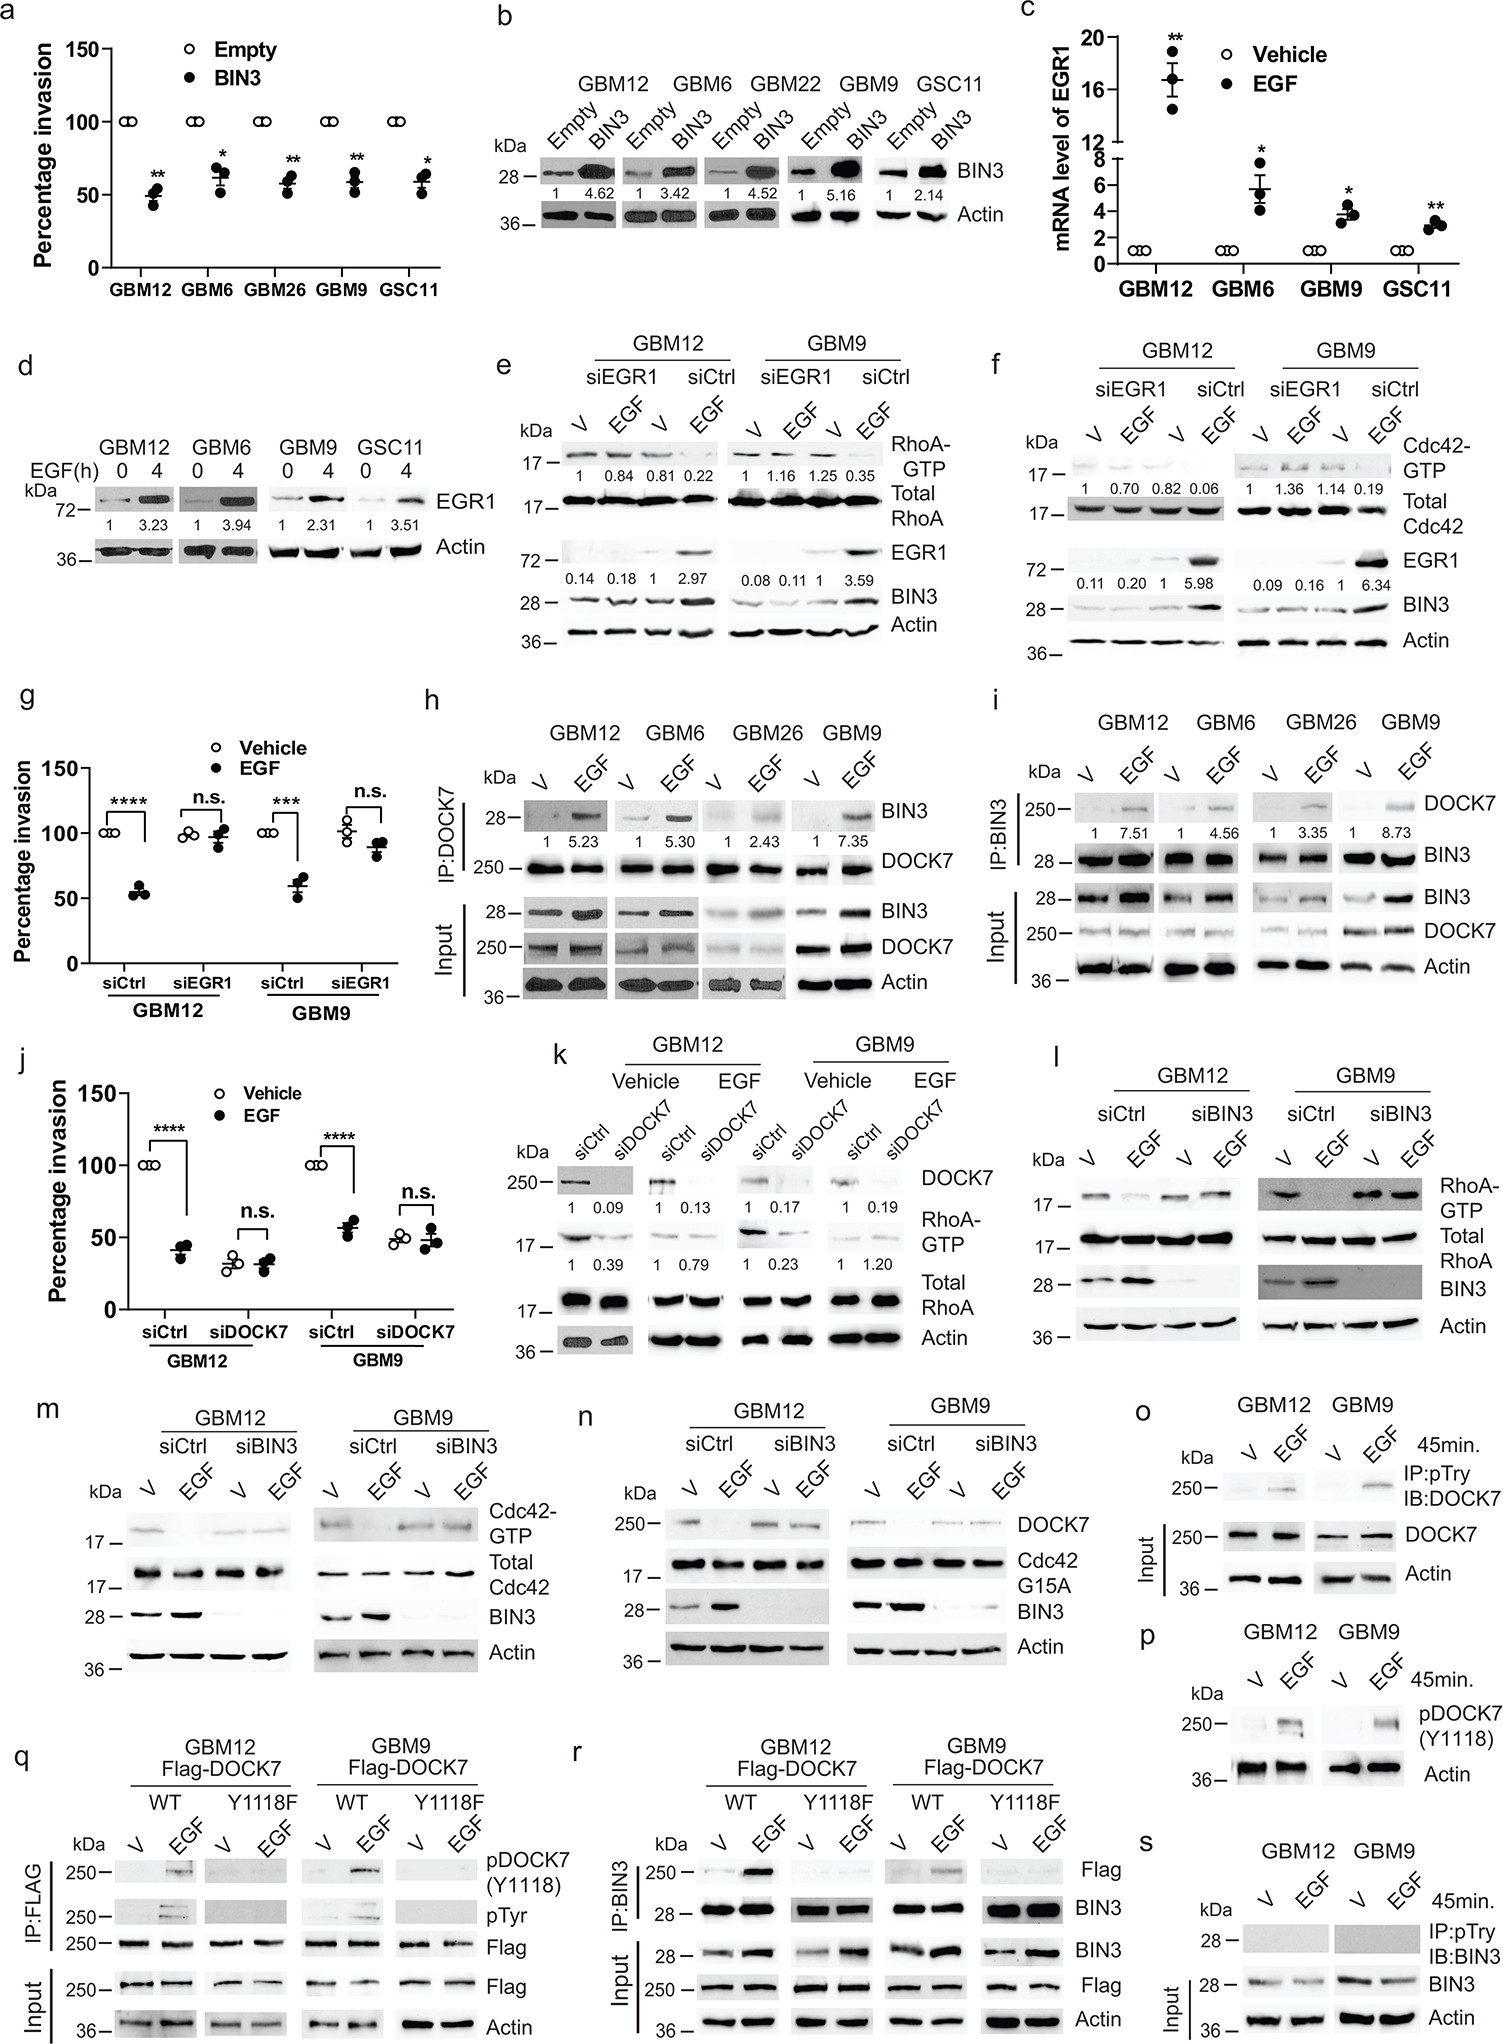
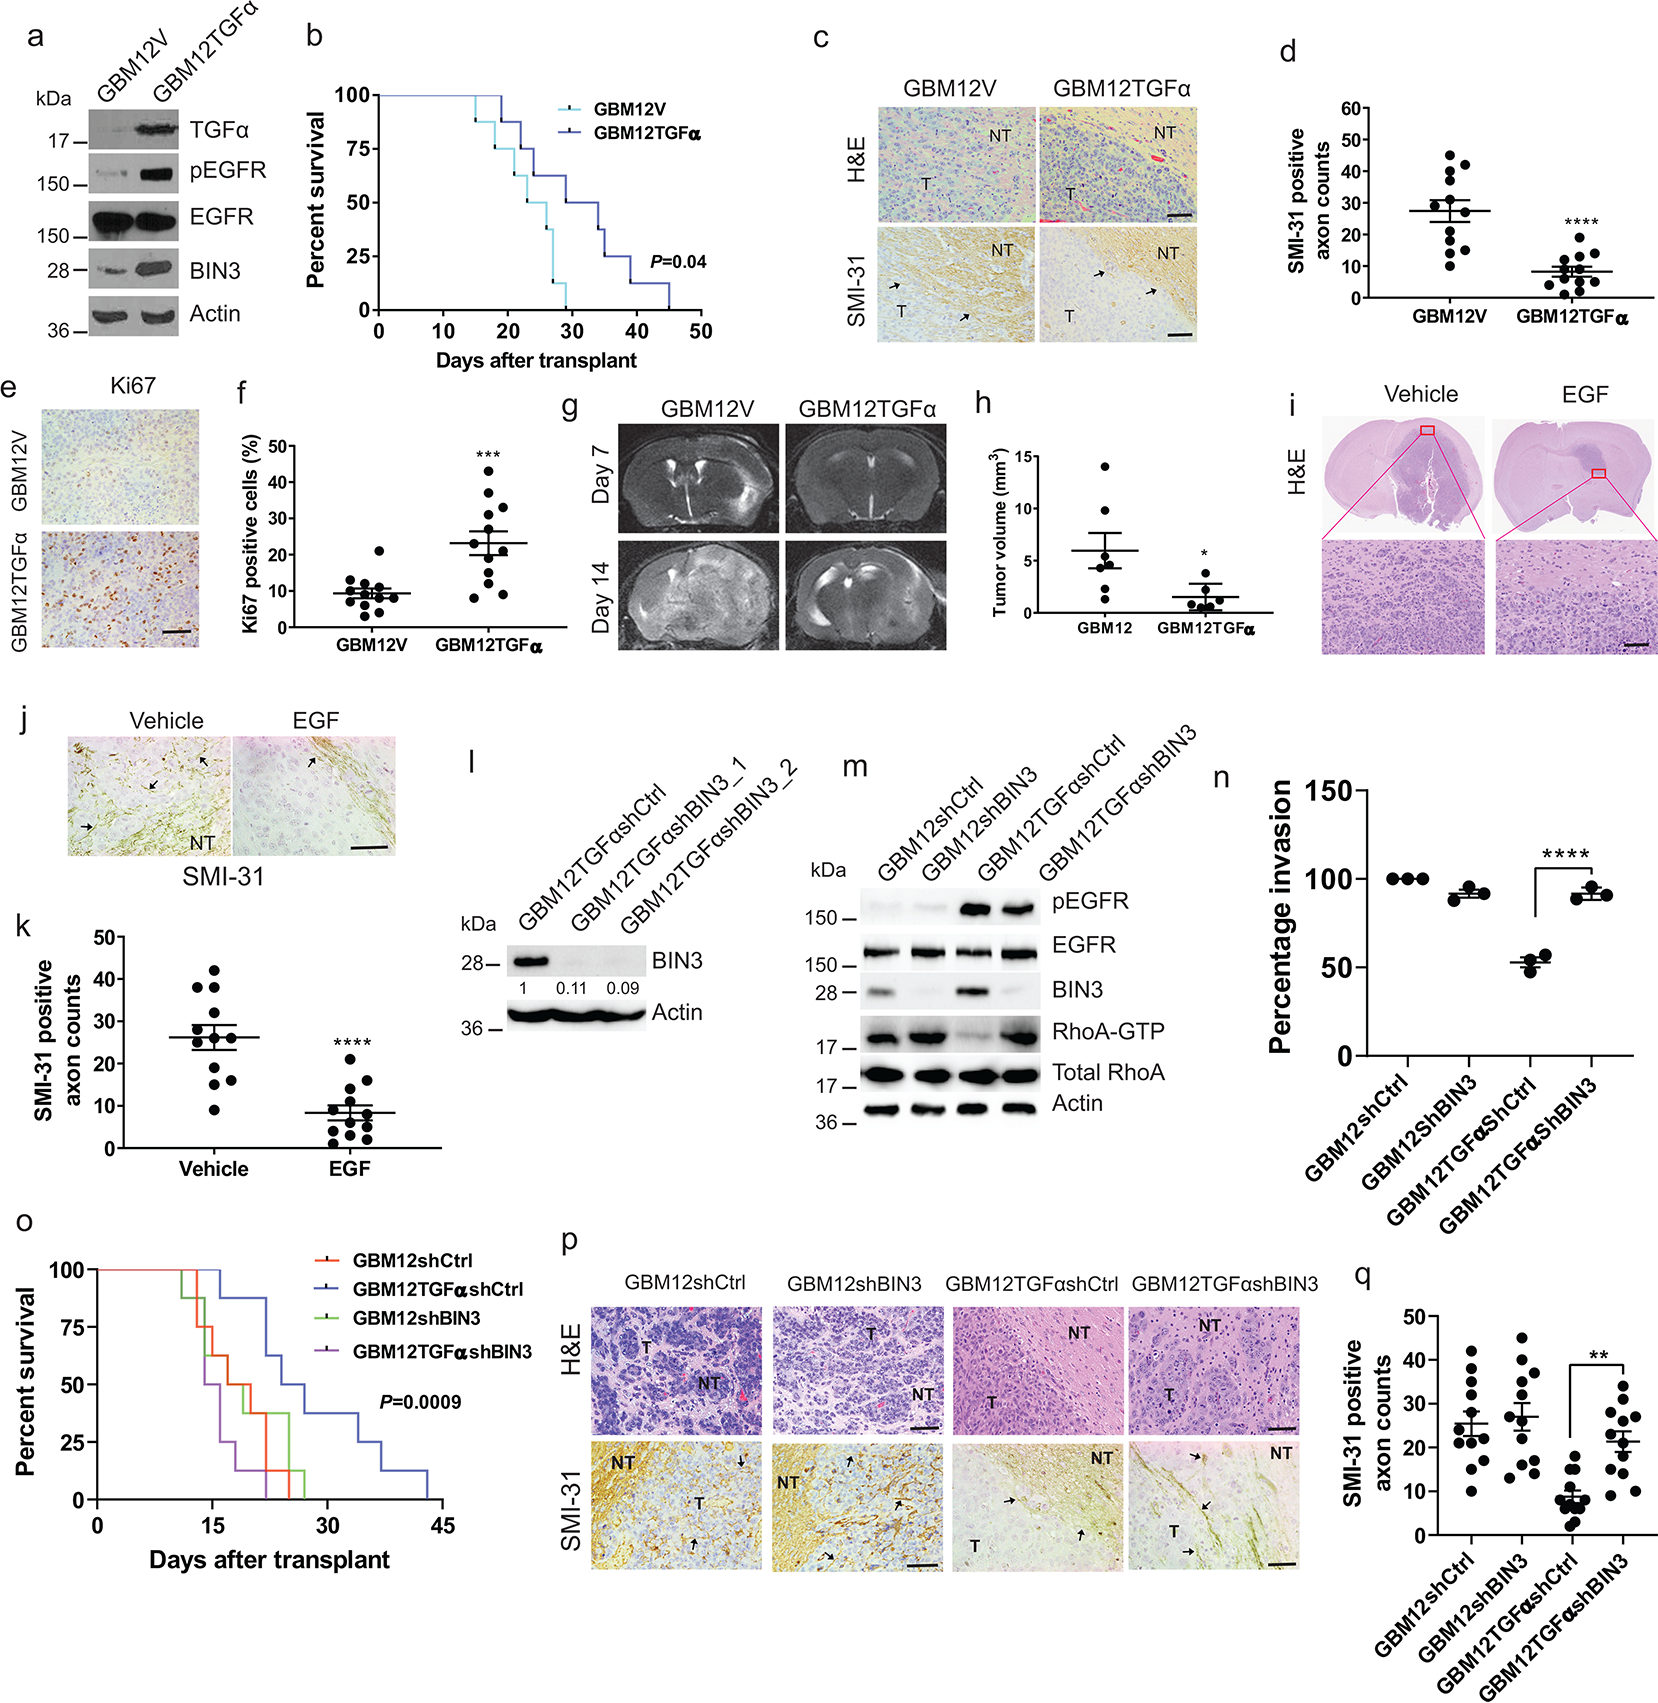
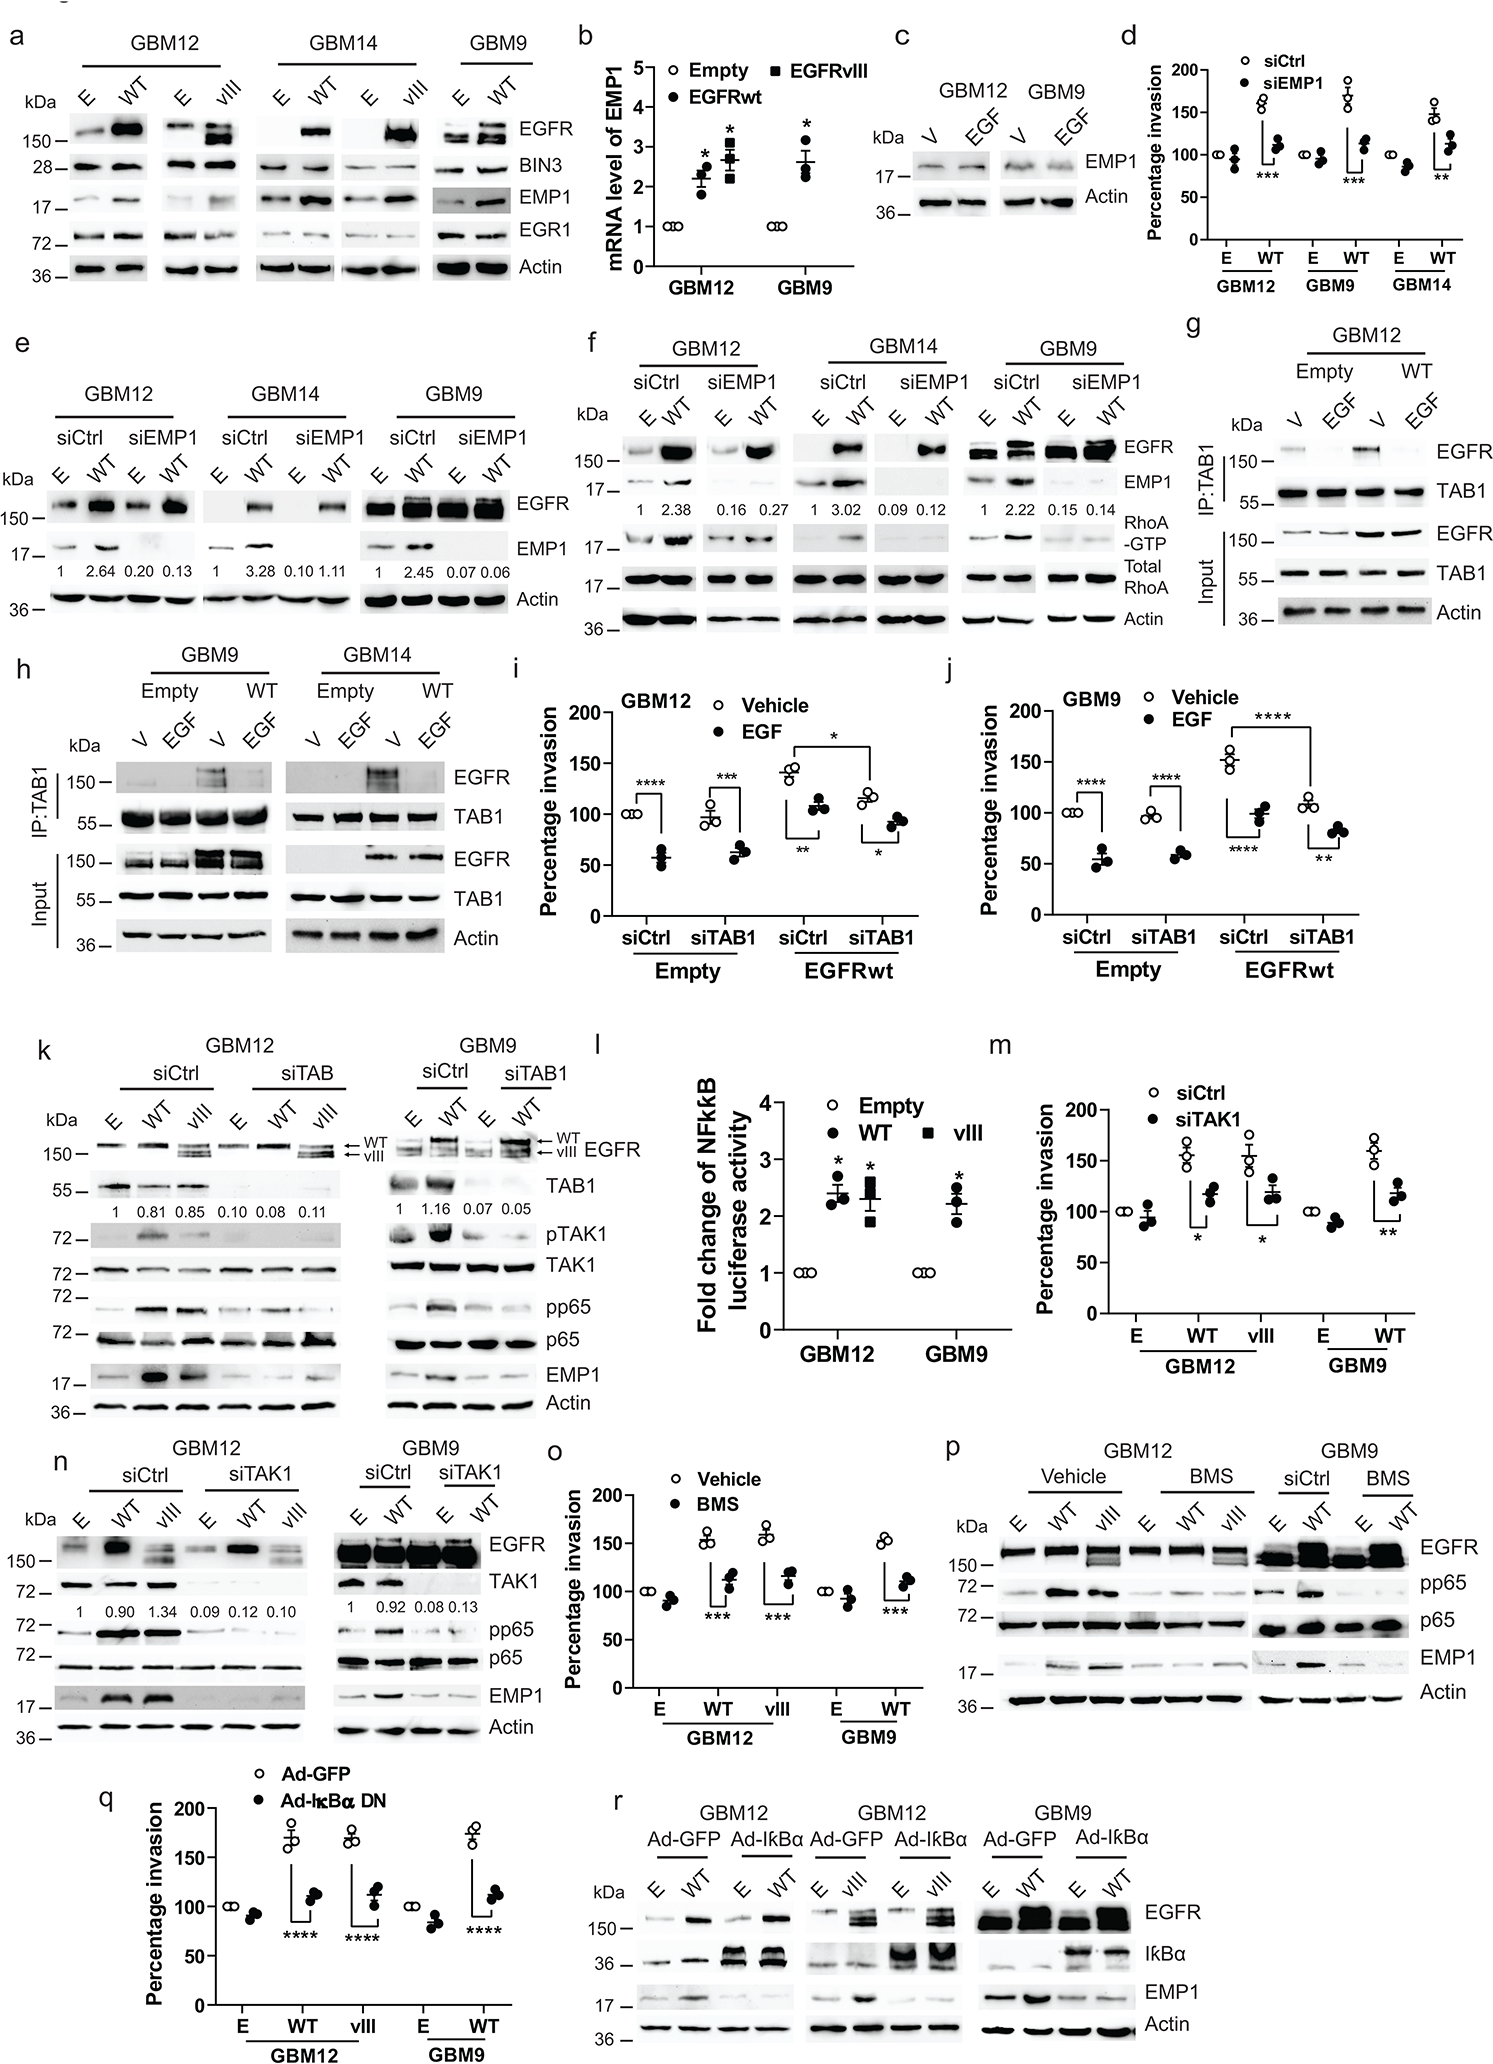
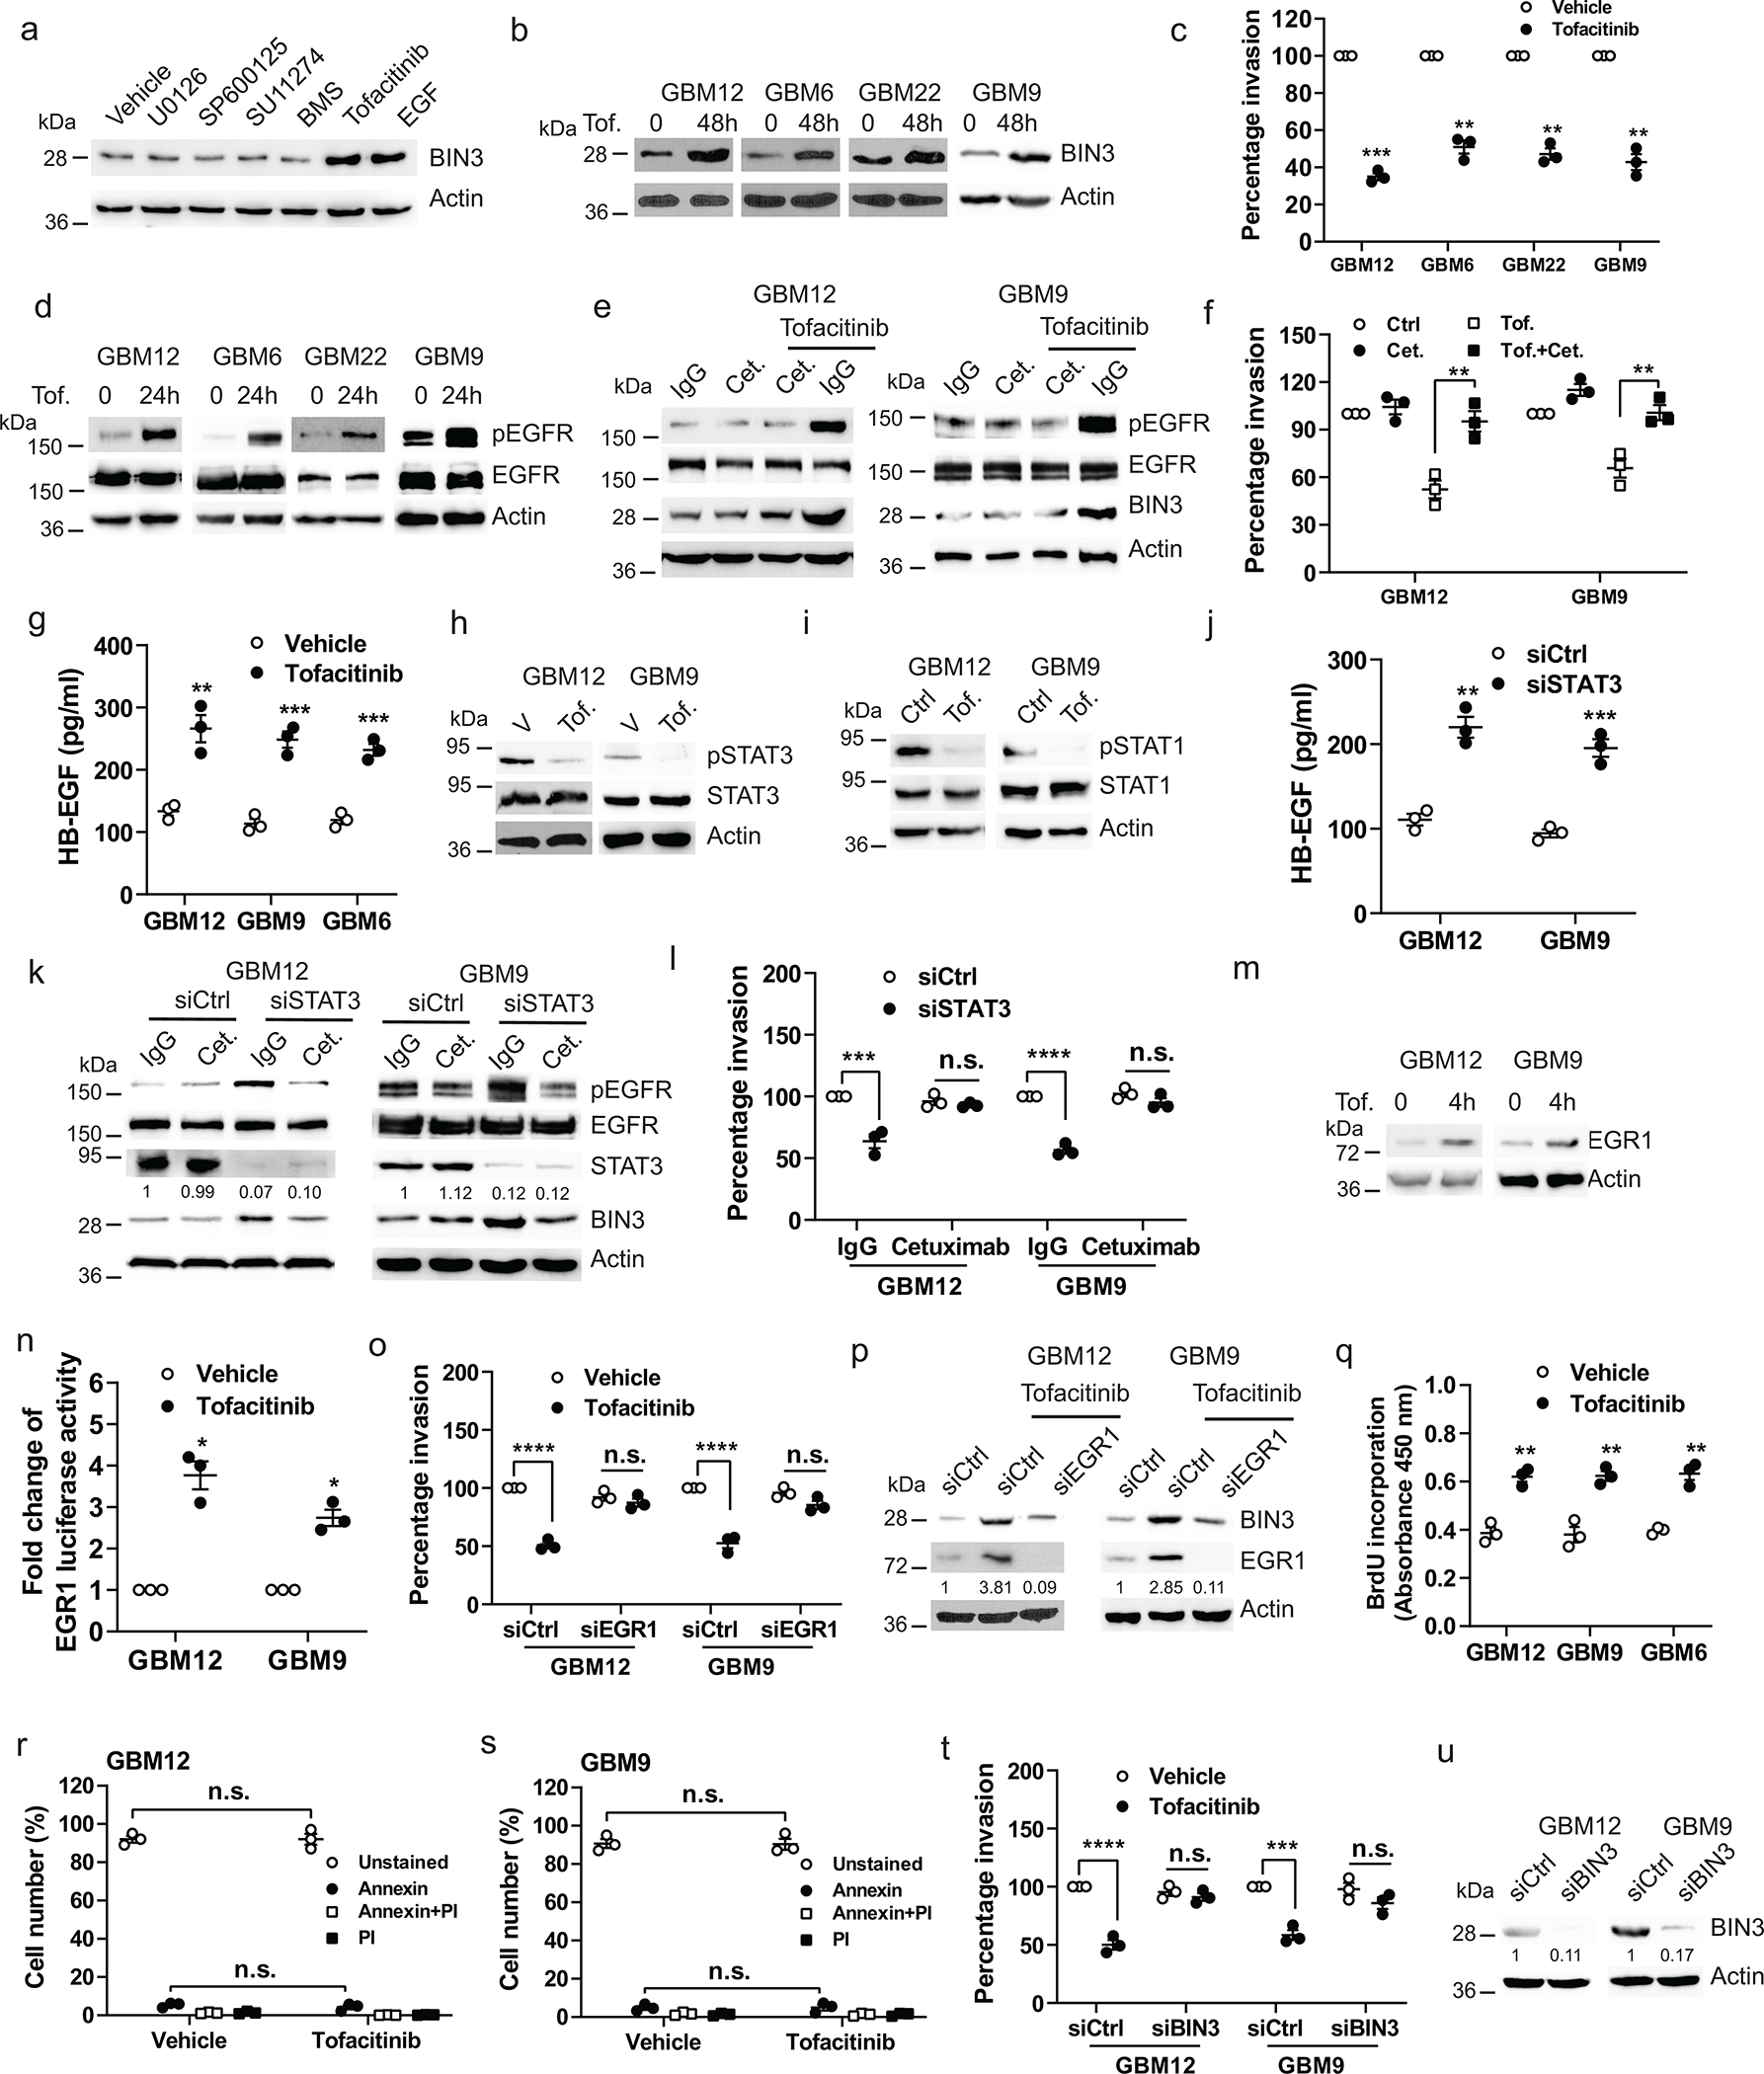
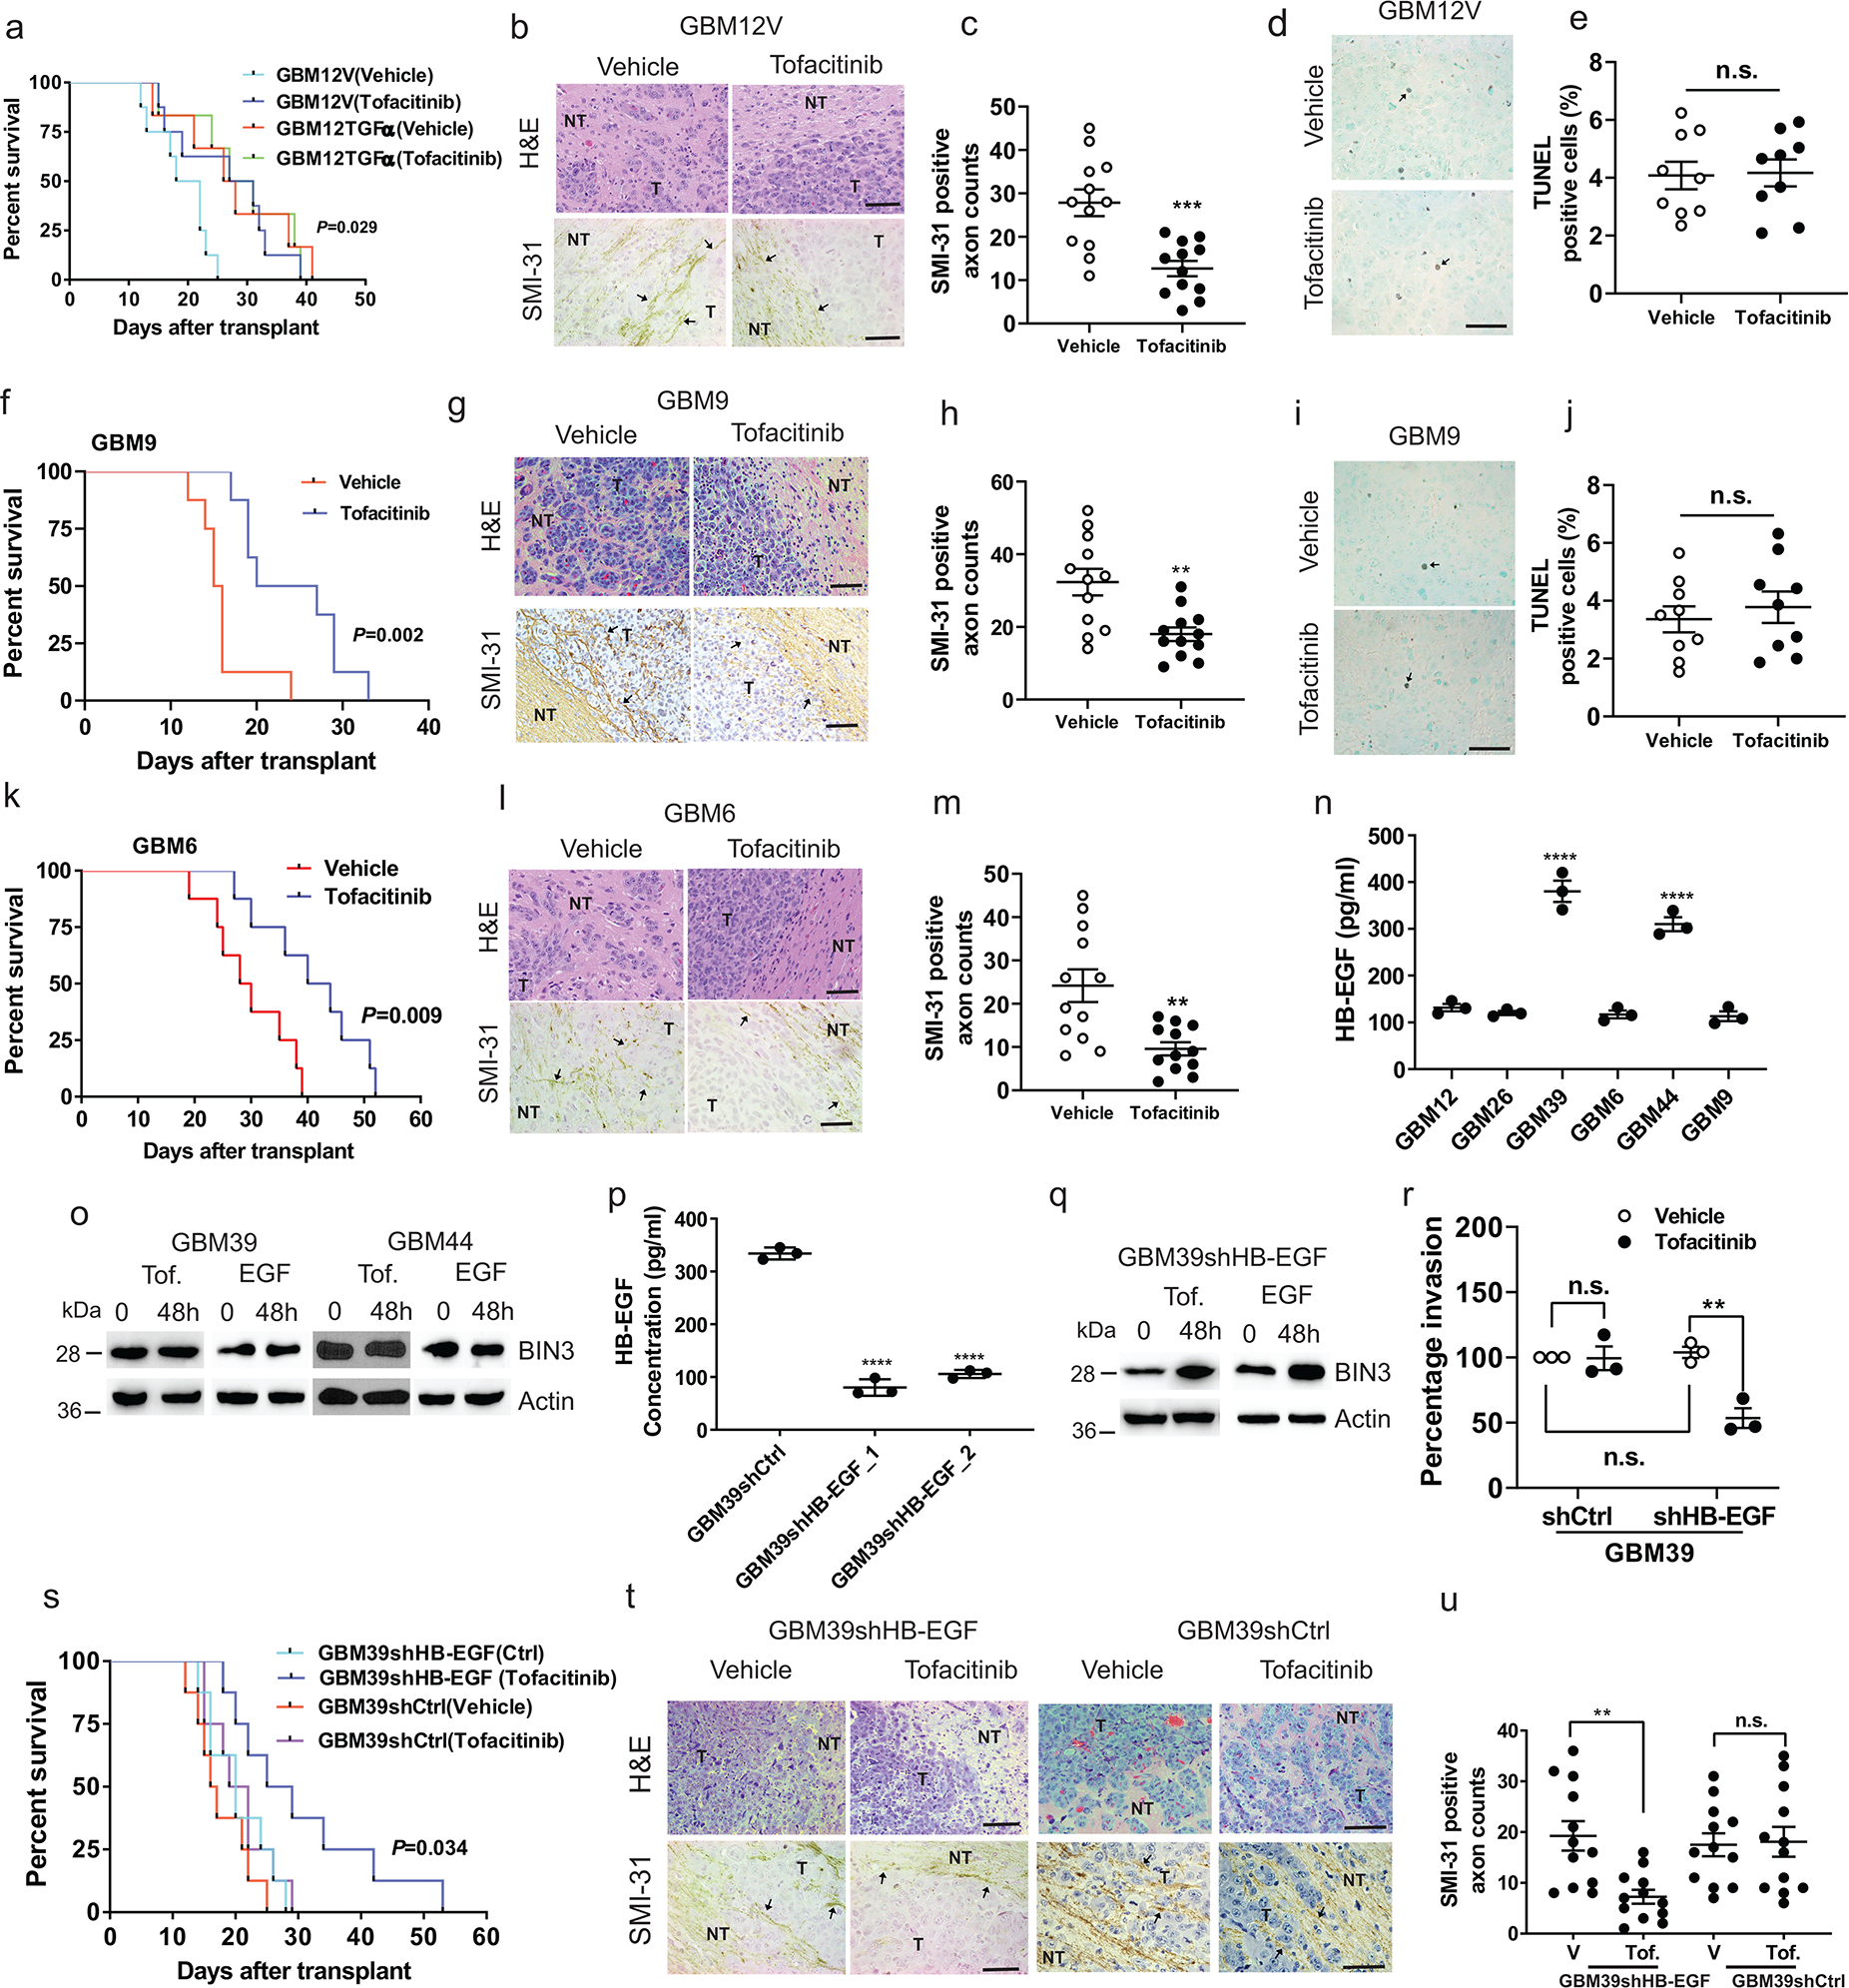
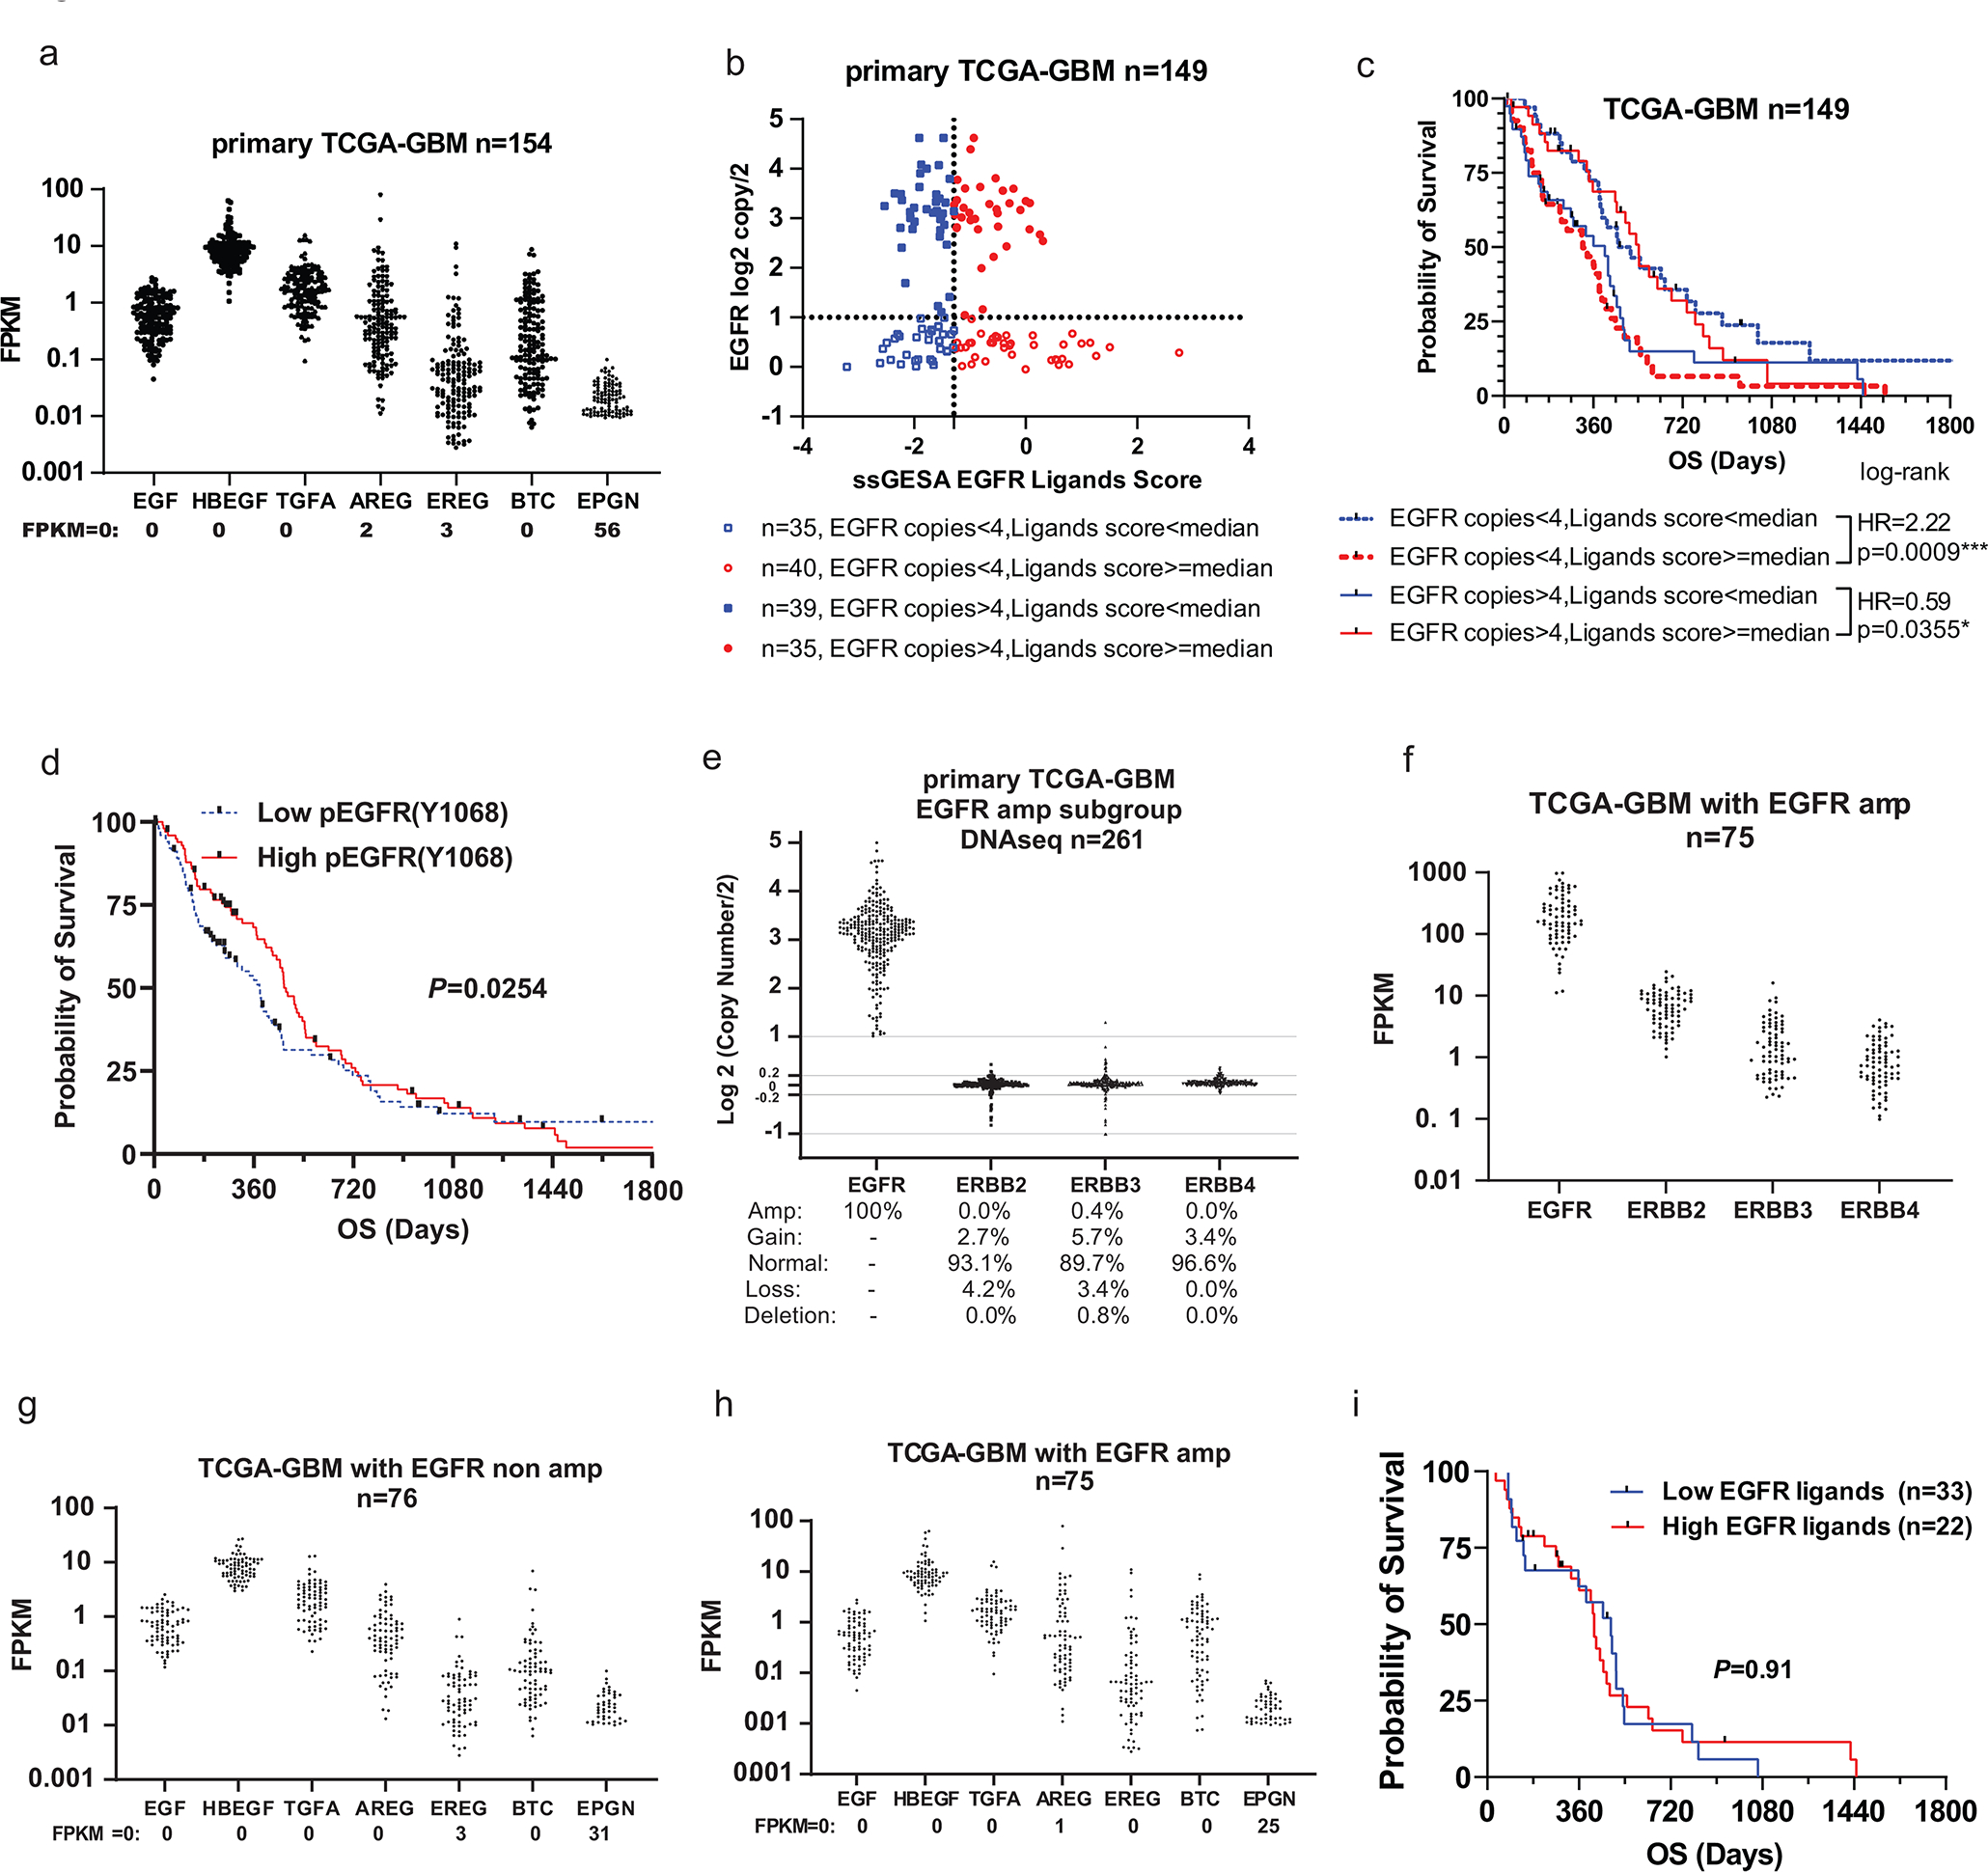
The epidermal growth factor receptor (EGFR) is a prime oncogene that is frequently amplified in glioblastomas. Here we demonstrate a new tumour-suppressive function of EGFR in EGFR-amplified glioblastomas regulated by EGFR ligands. Constitutive EGFR signalling promotes invasion via activation of a TAB1-TAK1-NF-κB-EMP1 pathway, resulting in large tumours and decreased survival in orthotopic models. Ligand-activated EGFR promotes proliferation and surprisingly suppresses invasion by upregulating BIN3, which inhibits a DOCK7-regulated Rho GTPase pathway, resulting in small hyperproliferating non-invasive tumours and improved survival. Data from The Cancer Genome Atlas reveal that in EGFR-amplified glioblastomas, a low level of EGFR ligands confers a worse prognosis, whereas a high level of EGFR ligands confers an improved prognosis. Thus, increased EGFR ligand levels shift the role of EGFR from oncogene to tumour suppressor in EGFR-amplified glioblastomas by suppressing invasion. The tumour-suppressive function of EGFR can be activated therapeutically using tofacitinib, which suppresses invasion by increasing EGFR ligand levels and upregulating BIN3.


Conflict of interest statement

Conflict of Interest disclosure: The Department of Veteran’s Affairs has filed a patent on the use of tofacitinib in glioblastoma, with Amyn Habib as the inventor. The other authors declare no competing interests.

Figures

Extended Data Fig. 1
Extended Data Fig. 1. Ligand induced EGFR signaling suppresses invasion, while constitutive EGFR signaling induces invasion
a, PDXs and neurospheres used in the study. b, Matrigel invasion assay of cells in the presence or absence of EGF(50 ng/ml). c, Immunoblot of EGFR expression. d, Matrigel invasion assay of cellstreated with EGFfor the indicated times. e, Matrigel invasion assay of GBM12 with various EGFR ligands. f, Immunoblot of the indicated proteins in GBM12 treated with EGFR ligands. g-h, Similar experiments in GBM6. i-j, Immunoblot of pEGFR and pERK in EGFR siRNA knockdown cellsand in U251 and GS622 cells treated with vehicle or EGF for 5 minutes. k, Matrigel invasion assay of GBM6 treated with erlotinib (1 μM) for the indicated times. l, Efficacy of erlotinib was analyzed by Western blot. m-n, Matrigel invasion assay of cells treated with the indicated concentrations of erlotinib. o, Immunoblot demonstrating efficacy of erlotinib (Erl). p, Matrigel invasion assay of GBM12 with IgG or cetuximab. q, Immunoblot of pEGFR and EGFR expression in GBM12 treated with EGF, IgG or Cetuximab (5 min.). r, Matrigel invasion assay of EGFRwt overexpressing GBM14 with IgG or cetuximab. s, Immunoblot of the indicated proteins in EGFR overexpressing GBM14 treated withEGF, IgG or cetuximab for 48 hours. t, Immunoblot of the indicated proteins in EGFR overexpressing GBM14 treated with or without EGF. u, Quantification of Western blot band intensity with actin as the reference protein. v, Matrigel invasion assay of GBM12 with the indicated drugs. w, Immunoblot of EGFR and pEGFR in cetuximab pretreated GBM12 with the indicated drugs. x, Matrigel invasion assay of EGFRvIII overexpressing GBM14 in the presence or absence of EGF. y, Immunoblot of EGFR and pEGFR in EGFRvIII overexpressing GBM14 treated with vehicle or EGF for 5 minutes. z, Representative static images showing progression of invasion in cellswith EGF. aa, Quantification of invasion distance of neurospheres. Western blot images are representative of three independent biological replicates. Actin served as the loading control. Data are represented as mean ± SEM from three independent experiments. Statistical significance was determined bytwo-tailed one-sample Student’s t-test (b, d, k, p, u), or by one-way ANOVA adjusted by Bonferroni’s correction (e, g, m, n, r, v, x), or by two-tailed unpaired Student’s t-test (aa). *P<0.05, **P< 0.01, ***P< 0.001, ****P< 0.001, n.s. not significant. Numerical source data, statistic, exact P values and unprocessed blots are available as Source Data.
Extended Data Fig. 2
Extended Data Fig. 2. Suppression of invasion induced by EGF is mediated by an EGFR-BIN3-DOCK7 pathway
a, Immunoblot of pFAK and FAK expression in cells treated with EGF (50 ng/ml) for the indicated times. b, Annexin V/PI positive staining assay of cells treated with EGF. c, BrdU incorporation assay of cells transiently transfected with empty or EGFRwt expression vectors. d, Overexpression of EGFRwt in cells was analyzed by Western blot. e, Volcano plot of differentially expressed genes as assessed by RNA-seq in vehicle or EGF treated GBM12. Significantly upregulated BIN3 is highlighted in green (Fold change=2.1, p=0.03). f, BrdU incorporation assay ofcells transiently transfected with empty or BIN3 vectors. g, Annexin V/PI positive staining assay of cells transiently transfected with empty or BIN3 expression vectors. h, BIN3 overexpression in cells was analyzed by Western blot. i, Matrigel invasion assay of DOCK7 overexpressing cells. Cells were infected with control or DOCK7 lentiviral activation particles, and 72 hours after infection invasion assay was performed in the presence or absence of EGF. j, Immunoblot of the indicated proteins in DOCK7 overexpressing cells treated with EGF for 24 hours. k, Matrigel invasion assay of cells transiently transfected with empty, Myc-RhoA or Myc-Cdc42 expression vectors in the presence or absenceof EGF. l-m, Overexpression of Myc-RhoA and Myc-Cdc42 was analzyed by Western blot. The Western blot images are representative of three independent biological replicates. Actin served as the loading control. The numbers below the blots indicate the relative band intensity of protein against that of actin. Data are represented as mean ± SEM from three independent experiments. Statistical significance was determined bytwo-way ANOVA adjusted by Bonferroni’s correction (b, g, i, k), or by two-tailed unpaired Student’s t-test (c, f). *P<0.05, **P< 0.01, ***P< 0.001, n.s. not significant. Numerical source data, statistic, exact P values and unprocessed blots are available as Source Data.
Extended Data Fig. 3
Extended Data Fig. 3. Regulation and biological effects of BIN3
a, Matrigel invasion of BIN3 overexpressing cells in the presence or absenceof EGF (50 ng/ml). b, BIN3 overexpression was analyzed by Western blot. c, Schematic diagram of the putative EGR binding sites in BIN3 promoter region together with the corresponding ChIP-qPCR amplicons. d, EGR1 luciferase reporter activity in multiple linestreated with EGF. e, Percentage input done by ChIP-qPCR to assess the EGR-1 occupancy of BIN3 gene in multiple lines treated with vehicle (V) or EGF for 24 hours. IgG was used as negative control. f, Matrigel invasion assay of Cdc42 or RhoA siRNA knockdown in multiple lines. g-h, Knockdown efficiency of RhoA and Cdc42 siRNA was analyzed by Western blot. i, Immunoblot of Cdc42-GTP and total Cdc42 expression in DOCK7 siRNA knockdown cells. j, Cell viability assay of control and DOCK7 siRNA knockdown multiple lines. k, Knockdown efficiency of DOCK7 was analyzed by Western blot. l, Immunoblot of Rac1 expression in multiple lines. m, Matrigel invasion assay of cells in the presence or absence of HGF (20ng/ml). n, Immunoblot of pMet and Met expression in cells treated with HGF for 1 hour. o, Immunoblot of immunoprecipitated extracts from cellstreated with HGF for 24 hours. p, Immunoblot of RhoA-GTP expression in cells treated with HGF (20 ng/ml) for 24 hours. The Western blot images are representative of three independent biological replicates. The numbers below the blots indicate the relative band intensity of protein against that of actin. Actin served as the loading control. The numbers below the blots indicate the relative band intensity of protein against that of actin. Data are represented as mean ± SEM from three independent experiments. Statistical significance was determined by two-way ANOVA adjusted by Bonferroni’s correction (a, e), or by two-tailed one- sample Student’s t-test (d, j), or one-way ANOVA adjusted by Bonferroni’s correction (f). *P<0.05, **P< 0.01, ***P< 0.001, ****P< 0.001, n.s. not significant. Numerical source data, statistic, exact P values and unprocessed blots are available as Source Data.
Extended Data Fig. 4
Extended Data Fig. 4. EGFR ligand overexpression prolongs survival, reduces invasiveness and increases proliferation in orthotopic glioblastoma mouse model
a, Immunoblot of the indicated proteins in GBM9 stably transfected with empty (GBM9V) or TGFα expression vector (GBM9TGFα). b, Immunoblot of EGFR expression in cells stably transfected with empty, TGFα, or BIN3 expression vectors. c, EGFR copy numbers in cells described in b. d, Immunoblot of EGFR expression in multiple lines cultured in 10% serum for the indicated times. e, EGFR copy numbers in cellsdescribed in d. f, Matrigel invasion assay of cells cultured in 10% serum for 8 weeks in the presence or absence of EGF. g, Kaplan–Meier survival curves of mice with GBM9V and GBM9TGFα tumours (n=8/group). h-i, H&E staining, SMI-31 immunostaining (black arrow)and quantification of SMI-31 countsin mouse tumours. j-k, Ki67 immunostaining and quantification of Ki67 positive cellsin mouse tumours. l, Immunoblot of EGFR expression in various tumours.. m, EGFR copy numbers in mouse tumours compared to fresh explants cultures. n, Immunoblot of BIN3 expression in cells stably overexpressing BIN3 or empty vector. o, Matrigel invasion assay of multiple lines. p, Kaplan–Meier survival curves of mice with GBM12V and GBM12BIN3 tumours (n=8/group). q-r, H&E staining, SMI-31immunostaining and quantification of SMI-31 counts in mouse tumours. s, ELISA for EGF in GBM12 stably transfected with EGF overexpressing or empty vector. t, Immunoblot of the indicated proteins in EGF-overexpressing GBM12 clones. u, Kaplan–Meier survival curves of mice with GBM12V and GBM12EGF (GBM12EGF_02) tumours (n=6/group). v, H&E staining, SMI-31 immunostaining and quantification of SMI-31 countsin mouse tumours. x-y, Ki67 immunostaining and quantification of Ki67 postive cells in mouse tumours. z-aa, Representative TUNEL staining (black arrows) and quantification of TUNEL positive cells in GBM12 orthotopic tumours from vehicle orEGF treated mice. bb-cc, Representative TUNEL staining and quantification of TUNEL positivecells in mouse tumours. Scale bars: 50 μM. Western blot images are representative of three independent biological replicates. Actin served as the loading control. Data are represented as mean ± SEM from three independent experiments. Statistical significance was determined by one-way ANOVA adjusted by Bonferroni’s correction (c, e, m, s), or by two-tailed one-sample Student’s t-test (f, o), or two-tailed unpaired Student’s t-test (i, k, r, w, y, aa, cc). *P<0.05, **P< 0.01, ***P< 0.001, ****P< 0.001, n.s. not significant. Numerical source data, statistic, exact P values and unprocessed blots are available as Source Data.
Extended Data Fig. 5
Extended Data Fig. 5. Biological effects of EGFR and STAT activation in GBM cells
a, The allele frequency of EGFRwt and EGFRvIII in GBM6 and GBM9. b, Matrigel invasion assay of EGFRwt or EGFRvIII overexpressing GBM14 with or without EGF (50 ng/ml). c, Immunoblot of the indicated proteins in EGFRwt or vIII overexpressing GBM14 cells treated with EGF (24 h). d, Matrigel invasion assay of EGFRwt and vIII overexpressing GBM14 with or without of EGF.WT(w): weak expression of WT; WT(s): strong expression of WT. e, Immunoblot of the indicated proteins in EGFRwt and vIII overexpressing GBM14 treated with EGF (24h). f, Immunoblot of immunoprecipitated extracts from cells treated with EGF (30 min.). g, Immunoblot of the indicated proteins in cells treated with EGF (30 min.)h, BrdU incorporation assay of Shc siRNA knockdown cellstreated with EGF. i, Immunoblot of the indicated proteins in Shc siRNA knockdown cells treated with EGF (30 min.). j, BrdU incorporation assay of cells treated with EGF, U0126 or a combination. k, Immunoblot of the indicated proteins in cells treated with EGF or U0126 or a combination (30 min.). l, BrdU incorporation assay of ERK siRNA knockdown cells treated with EGF. m, Knockdown efficiency of ERK was analyzed by Western blot. n, Immunoblot of different Tyr resides of pEGFR in multiple lines treated with EGF (30 min.). o, Quantification of Western blot band intensity with actin as reference. p, Immunoblot of the indicated proteins in cells treated with tofacitinib (Tof.). q, ELISA for HB-EGF in the supernatant of STAT1 siRNA knockdown GBM12. r, Immunoblot of pEGFR and pSTAT1 in STAT1 siRNA knockdown GBM12. s, Matrigel invasion assay of control or STAT1 siRNA knockdown GBM12. t, ELISA for BTC in the supernatants of GBM12 treated with tofacitinib (72 h). u, Matrigel invasion assay of STAT3 overexpressing GBM12 in response to tofacitinib. v, Immunoblot of the indicated proteins in STAT3 overexpressingcells treated with tofacitinib. w, Immunoblot of BIN3 in multiple lines treated with EGF, tofacitinib or both (48 h). x, Matrigel invasion assay with EGF or tofacitinib or both. y-aa, Ki67 immunostaining and quantification of KI67 positive cells in GBM12 and GBM9 tumours from tofacitinib treated mice. Scale bars: 50 μM. The Western blot images are representative of three independent biological replicates. Actin served as the loading control. The numbers below the blots indicate the relative band intensity of protein against that of actin. Data are represented as mean ± SEM from three independent experiments. Statistical significance was determined by two-way ANOVA adjusted by Bonferroni’s correction (b, d, h, j, l, u), or by two-tailed one-sample Student’s t-test (o, s), or by two-tailed unpaired Student’s t-test (q, aa), or by one-way ANOVA adjusted by Bonferroni’s correction (x). *P<0.05, **P< 0.01, ***P< 0.001, ****P< 0.001, n.s. not significant. Numerical source data, statistic, exact P values and unprocessed blots are available as Source Data.
Extended Data Fig. 6
Extended Data Fig. 6. EGF and tofacitinib suppress migration in single cell analysis
a, Time-lapse migration speed in GBM12 before and after addition of vehicle (n=67) or EGF (50 ng/ml)(n=63). b, Quantification of migration velocity of GBM12 before and after addition of vehicle or EGF. Cell migration velocity was calculated over a period of 6 hours. c, Representative static time-lapse images of the same cell migration before and after addition of EGF. d, Percentage of cell migration speed before and after addition of EGF. e, Time-lapse migration speed in GBM12 before and after addition of vehicle (n=81) or tofacitinib (1 μM) (n=89). f, Quantification of migration velocity of GBM12 before and after addition of vehicle or tofacitinib. g, Representative static time-lapse images of the same cell migration before and after addition of tofacitinib. h, Percentage of cell migration speed before and after addition of tofacitinib. i, Time-lapse migration speed in GBM22 before and after addition of vehicle (n=57) or EGF (n=74). j, Quantification of migration velocity of GBM22 before and after addition of vehicle or EGF. k, Representative static time-lapse images of the same cell migration before and after addition of EGF. l, Percentage of cell migration speed before and after addition of EGF. m, Time-lapse migration speed in GBM22 before and after addition of vehicle (n=61) or tofacitinib (n=53). n, Quantification of migration velocity of GBM22 before and after addition of vehicle or tofacitinib. o, Representative static time-lapse images of the same cell migration before and after addition of tofacitinib. p, Percentage of cell migration speed before and after addition of tofacitinib. Scale bars: 10 μM (c, g, k and o). Whiskers of the boxplot mark the 5th and 95th percentiles, the box marks the 25th to the 75th percentiles with the median (b, f, j, m). **P < 0.001, **** P < 0.0001, n.s. not significant, P values were determined using two-tailed Wilcoxon matched pair tests(b, f, j, n). The results are representative of two independently repeated experiments. Numerical source data, statistic and exact P values are available as Source Data.
Extended Data Fig. 7
Extended Data Fig. 7. EGFR ligands, EGFR, BIN3 and Sp1 expression in human glioblastoma
a-c, ELISA for HB-EGF, TGFα and EGF in human glioblastoma lysates. d, Representative immunohistochemical staining of HB-EGF in human glioblastoma. e, Summary of HB-EGF staining in high and low cellular areas across the tissue sections from 20 samples. Score 0 and 1 are defined as low, 2 and 3 are defined as moderate/high. Staining intensity in the two areas were compared using Fisher’s exact test. f, Representative EGFR immunostaining in high cellular (central) and low cellular (infiltrating) areas of human glioblastoma. g, Summary of EGFR staining of the tissue sections from 20 samples. h, Representative Sp1 immunostaining in high cellular and low cellular areas of human glioblastoma. i, Summary of Sp1 staining of the tissue sections from 20 samples. j-l, Ivy Atlas distribution of EGFR, HB-EGF and Sp1 mRNA expression in central and infiltrating areas of human GBM. m, Representative images of fluorescent double staining of HB-EGF (green) and Sp1 (red) in human GBM tissue sections. n, ELISA for HB-EGF in multiple lines transiently transfected with empty or HA-Sp1 vectors. o, HA-Sp1 overexpression was analyzed by Western blot. p, ELISA for HB-EGF in Sp1 siRNA knockdown cells. q, Sp1 siRNA knockdown was analyzed by Western blotting. r, Overall survival (OS) analysis according to BIN3 mRNA levels in classical GBM patients with amplified EGFR. s, Immunoblot of BIN3 expression in human glioblastoma extracts. t, Scatter plot of HB-EGF and BIN3 expression in human glioblastoma lysates (n=36). u, Kaplan-Meier curves of survival rates for high and low levels of BIN3 assessed by Western blot. The Western blot images are representative of three independent biological replicates. Actin served as the loading control. The numbers below the blots indicate the relative band intensity of protein against that of actin. Scale bars: 50 μM. Data are represented as mean ± SEM from three independent experiments. Significance was determined by Kolmogorov Smimov test (j, k, l), or by two-tailed unpaired Student’s t-test (n, p), or by log-rank test (r, u). **P< 0.01, ****P< 0.001, n.s. not significant. Numerical source data, statistic, exact P values and unprocessed blots are available as Source Data.
Figure 1
Figure 1. Ligand induced EGFR signaling inhibits invasion by upregulation of BIN3
a, EGFR expression in multiple GBM PDXs and neurospheres line. b, Matrigel invasion assay of multiple lines with or without EGF (50 ng/ml). c, Matrigel invasion assay of EGFR siRNA knockdown cells in the presence or absence of EGF. d, Knockdown efficiency of EGFR siRNA was analyzed by Western blot. e-f, Similar experiments in neurospheres. g, Matrigel invasion assay of EGFR siRNA knockdown cells retransfected with EGFRwt or EGFRvIII expression vector. h, Western blot showing knockdown or re-expression efficiency of EGFRwt or EGFRvIII. I-j, Matrigel invasion assay and Western blot of GBM12 with or without erlotinib (1 μM) for indicated times. k-l, Matrigel invasion assay of EGFRwt overexpressing cells in the presence or absence of EGF and Western blot of EGFR expression. m-n, Matrigel invasion assay of EGFRwt or EGFRvIII overexpressing cells and Western blot of EGFR expression. o, BrdU incorporation assay of multiple lines treated with or without EGF (50ng/ml). p-q, Western blot and qPCR analysis of BIN3 in multiple lines treated with EGF (50 ng/ml). r, Matrigel invasion assay of BIN3 siRNA knockdown cells with or without EGF. s, Knockdown efficiency of BIN3 siRNA was analyzed by Western blot. t-u, Representative images and quantitative analysis of scratch assay in cells treated with EGF (50 ng/ml) for 24 hours. Scale bar: 100 μm. v, Representative time-lapse imaging of migrating tumour cells (red lines) through a cranial window. Scale bar: 100 μm. w, Quantification of cell velocity for vehicle and EGF treated group (n=3/group). The Western blot images are representative of three independent biological replicates. Actin served as the loading control. The numbers below the blots indicate the relative band intensity of protein against that of actin. Data are represented as mean ± SEM from three independent experiments. Statistical significance was determined by two-tailed one-sample Student’s t-test (b, i, m, q), or by two-way analysis of variance (ANOVA) adjusted by Bonferroni’s correction (c, e, g, k, r), or by two-tailed unpaired Student’s t-test (o, u, w). *P <0.05, **P < 0.01, ***P < 0.001, ****P < 0.001, n.s. not significant. Numerical source data, statistic, exact P values and unprocessed blots are available as Source Data.
Figure 2
Figure 2. EGFR level determines the invasion response to EGFR ligand via BIN3 regulation
a, Matrigel invasion assay of U251 cells stably transfected with the empty (U251V) or EGFRwt expression vector (U251EGFR) in the presence or absence of EGF (50 ng/ml). b, Matrigel invasion assay of tetracycline (Tet.) induced EGFR overexpressing U251 cells (U251EGFRInd) in the presence or absence of EGF. c, Immunoblot of EGFR and BIN3 expression in cells treated with EGF for 48 hours. d, Immunoblot of EGFR expression in multiple lines. e-f, Matrigel invasion assay of EGFRwt overexpressing cells in the presence or absence of EGF. g, Immunoblot of EGFR and BIN3 expression in EGFRwt overexpressing cells treated with EGF for 48 hours. h, Immunoblot of EGFR, pEGFR and proteins involved in TAB1-BIN3 axis expression in cells transfected with indicated dose of EGFR siRNA. i, Matrigel invasion assay of GBM12 transfected with indicated doses of EGFR siRNA. j, BrdU incorporation assay of cells transiently transfected with empty (E) or EGFRwt (WT) expression vector in the presence or absence of EGF for 48 hours. k, Immunoblot of EGFR and BIN3 expression in EGFR siRNA knockdown cells treated with EGF (50ng/ml). l, Matrigel invasion assay of BIN3 siRNA knockdown cells in the presence or absence of EGF. m, BIN3 siRNA knockdown efficiency was analyzed by Western blot. The Western blot images are representative of three independent biological replicates. Actin served as the loading control. The numbers below the blots indicate the relative band intensity of protein against that of actin. Data are represented as mean ± SEM from three independent experiments. Statistical significance was determined by two-way ANOVA adjusted by Bonferroni’s correction (a, e, f, i, j, l), or by one-way ANOVA adjusted by Bonferroni’s correction (b). * P<0.01, ** P < 0.01, *** P<0.001, **** P<0.0001, n.s. not significant. Numerical source data, statistic, exact P values and unprocessed blots are available as Source Data.
Figure 3
Figure 3. BIN3 inhibits invasiveness of glioma cells through its interaction with DOCK7
a, Matrigel invasion assay of multiple lines with BIN3 overexpression. b, BIN3 overexpression was analyzed by Western blot. c, EGR1 mRNA levels in multiple lines treated with EGF (50 ng/ml) for 2 hours. d, Immunoblot of EGR1 in cells treated with EGF. e-f, Immunoblot of the indicated proteins in EGR1 siRNA knockdown cells treated with EGF. g, Matrigel invasion assay of EGR1 siRNA knockdown cells in the presence or absence of EGF. h-i, Immunoblot of immunoprecipitated (IP) extracts from multiple lines treated with EGF for 24 hours. j, Matrigel invasion assay of DOCK7 siRNA knockdown GBM12 and GBM9 in the presence or absence EGF (50 ng/ml). k, Immunoblot of the indicated proteins in DOCK7 siRNA knockdown in cells treated with EGF for 24 hours. l-m, Immunoblot of the indicated proteins in BIN3 siRNA knockdown cells treated with EGF (50 ng/ml) for 24 hours. n, Immunoblot of active DOCK7 in EGF treated control or BIN3 siRNA knockdown cells. o, Immunoblot of IP extracts from cells treated with vehicle or EGF. p, Immunoblot of phosphorylated DOCK7(Y1118) in cells treated with vehicle or EGF. q-r, Immunoblot of IP extracts from wild-type or mutant (Y1118F) Flag-DOCK7 overexpressing cells treated with vehicle or EGF. s, Immunoblot of IP extracts from cells treated with vehicle or EGF. The Western blot images are representative of three independent biological replicates. Actin served as the loading control. The numbers below the blots indicate the relative band intensity of protein against that of actin. Data are represented as mean ± SEM from three independent experiments. Statistical significance was determined by two-tailed one-sample Student’s t-test (a, c), or by two-way ANOVA adjusted by Bonferroni’s correction (g, j). *P <0.05, **P < 0.01, ***P < 0.001, ****P < 0.001, n.s. not significant. Numerical source data, statistic, exact P values and unprocessed blots are available as Source Data.
Figure 4
Figure 4. TGFα overexpression prolongs survival, reduces invasiveness and increases proliferation in orthotopic glioblastoma mouse model
a, Immunoblot of the indicated proteins in GBM12 stably transfected with empty (GBM12V) or TGFα expression vector (GBM12TGFα). b, Kaplan–Meier survival curves of mice with orthotopic xenotransplant model of GBM12TGFα and GBM12V (n=8/group). c, Representative H&E staining and SMI-31 immunostaining in GBM12V and GBM12TGFα tumour tissue sections. T: Tumour; NT: Normal tissue. d, Quantification of SMI-31 counts within tumour region. e-f, Representative images and quantification of Ki67 immunostaining in mouse tumour tissue sections. g, Representative MRI imaging of orthotopic tumour bearing mice obtained at 7 and 14 days after transplantation of GBM12V or GBM12TGFα. h, Tumour volume of two groups after 14 days (GBM12V n=7, GBM12TGFα n=6). i, H&E staining of GBM12 orthotopic tumours from mice intracranially infused with EGF or vehicle (n=4/group). j-k, Representative immunostaining and quantification for SMI-31 in GBM12 orthotopic tumours from mice treated with vehicle or EGF. l, Immunoblot of BIN3 in GBM12TGFα stably transfected with control or BIN3 shRNA. m, Immunblot of the indicated proteins in the indicated cells. n, Matrigel invasion assay of multiple lines. o, Kaplan–Meier survival curves of orthotopic mouse xenotransplant model of the indicated cells (n=8/group). p, Representative H&E staining and SMI-31 immunostaining in tumour tissue sections. q, Quantification of SMI-31 counts. The Western blot images are representative of three independent biological replicates. Actin served as the loading control. The numbers below the blots indicate the relative band intensity of protein against that of Actin. Scale bar: 100 μm. Data are represented as mean ± SEM from three independent experiments. Statistical significance was determined by log-rank test (b, o), or by two-tailed unpaired Student’s t-test (d, f, h, k), or by two-way ANOVA adjusted by Bonferroni’s correction (n, q). *P <0.05, **P < 0.01, ***P < 0.001, ****P < 0.001, n.s. not significant. Numerical source data, statistic, exact P values and unprocessed blots are available as Source Data.
Figure 5
Figure 5. Constitutive EGFR signaling induces TAB1-TAK1-p65-EMP1 pathway
a, Immunoblot of the indicated proteins in cells transiently transfected with empty (E), EGFRwt (WT) or EGFRvIII (vIII) expression vectors. b, mRNA level of EMP1 in cells transiently transfected with empty, EGFRwt or vIII expression vectors. c, Immunoblot of EMP1 protein expression in cells treated with EGF (50 ng/ml) for 24 hours. d, Matrigel invasion of multiple lines transiently transfected with empty or EGFRwt expression vectors, along with control or EMP1 siRNA. e, Efficiency of EMP1 knockdown and EGFRwt overexpression was analyzed by Western blot. f, Immunoblot of the indicated proteins in multiple lines transiently transfected with empty or EGFRwt expression vectors, along with control or EMP1 siRNA. g-h, Immunoblot of immunoprecipitated extracts from EGFRwt overexpressing multiple lines treated with vehicle or EGF for 30 minutes. i-j, Matrigel invasion of EGFRwt or EGFRvIII overexpressing and/or TAB1 siRNA knockdown cells. k. Immunoblot of the indicated proteins in cells as described in i-j. l, NF-κB luciferase reporter activity in EGFRwt or EGFRvIII overexpressing cells. m, Matrigel invasion of EGFRwt or vIII overexpressing and/or TAK1 siRNA knockdown cells. n, Immunoblot of the indicated proteins in cells as described in m. o, Matrigel invasion of EGFRwt or EGFRvIII overexpressing cells treated with NF-κB inhibitor BMS (BMS-345541). p, Immunoblot of the indicated proteins in EGFRwt or vIII overexpressing cells treated with BMS for 48 hours. q, Matrigel invasion of EGFRwt or vIII and/or IκBα dominant negative (DM) overexpressing cells. r, Immunoblot of the indicated proteins in cells as described in q. Western blot images are representative of three independent biological replicates. Actin served as the loading control. The numbers below the blots indicate the relative band intensity of protein against that of actin. Data are represented as mean ± SEM from three independent experiments. Statistical significance was determined by two-tailed one-sample Student’s t-test (b, l), or by two-way ANOVA adjusted by Bonferroni’s correction (d, i, j, m, o, q). *P < 0.05, ** P < 0.01, *** P < 0.001, ****P < 0.0001. Numerical source data, statistic, exact P values and unprocessed blots are available as Source Data.
Figure 6
Figure 6. Tofacitinib inhibits invasion of glioma cells by EGR1-mediated BIN3 upregulation
a, Immunoblot of BIN3 expression in GBM12 treated with the indicated drugs for 48 hours. b, Immunoblot of BIN3 expression in multiple lines treated with tofacitinib (1 μM). c, Matrigel invasion of multiple lines in the presence or absence of tofacitinib (1 μM). d, Immunoblot of pEGFR and EGFR in multiple lines treated with tofacitinib (1 μM). e, Immunoblot of the indicated proteins in cells treated with either tofacitinib, cetuximab (cet.), IgG control or their combination for 24 hours. f, Matrigel invasion assay of cells in the presence or absence tofacitinib, cextuximab or their combination. g, ELISA for HB-EGF in the supernatant of tofacitinib treated multiple lines. h-i, Immunoblot of the indicated proteins in cells treated with tofacitinib. j, ELISA for HB-EGF in the supernatant of STAT3 siRNA knockdown cells. k, Immunoblot of the indicated proteins in STAT3 siRNA knockdown cells treated with IgG or cetuximab for 24 hours. l, Matrigel invasion assay of STAT3 siRNA knockdown cells in the presence or absence of IgG or cextuximab. m, Immunoblot of EGR1 expression in cells treated with tofacitinib. n, EGR1 promoter luciferase assay of cells treated with tofacitinib for 2 hours. o, Matrigel invasion assay of EGR1 siRNA knockdown cells in the presence or absence of tofacitinib. p, Immunoblot of BIN3 expression in EGR1 siRNA knockdown cells treated with tofacitinib for 24 hours. q, BrdU incorporation assay of multiple lines treated with tofacitinib. r-s, Annexin V/PI positive staining assay of cells treated with tofacitinib for 24 hours. t, Matrigel invasion assay of BIN3 siRNA knockdown cells in the presence or absence of tofacitinib. u, Knockdown efficiency of BIN3 in cells was analyzed by Western blot. The Western blot images are representative of three independent biological replicates. Actin served as the loading control. The numbers below the blots indicate the relative band intensity of protein against that of actin. Data are represented as mean ± SEM from three independent experiments. Statistical significance was determined by two-tailed one-sample Student’s t-test (c, n), or by two-way ANOVA adjusted by Bonferroni’s correction (f, l, o, r, s, t), or by two-tailed unpaired Student’s t-test (g, j, q). *P <0.05, **P < 0.01, ***P < 0.001, ****P < 0.001, n.s. not significant. Numerical source data, statistics, exact P values and unprocessed blots are available as Source Data.
Figure 7
Figure 7. Tofacitinib prolongs survival, reduces invasiveness and increases proliferation in an orthotopic glioblastoma mouse model
a, Kaplan–Meier survival curves of mice in an orthotopic model of GBM12V and GBM12TGFα treated with vehicle or tofacitinib (50 mg/kg) (n=8 for GBM12TGFα, n=6 for GBM12V). P-value represents vehicle vs. tofacitinib in GBM12TGFα groups. b-c, H&E staining, SMI-31 immunostaining (black arrows) and quantification of SMI-31 counts in GBM12V orthotopic tumours. d-e, TUNEL staining (black arrows) and quantification of TUNEL positive cells in GBM12V orthotropic tumour from vehicle and tofacitinib treated mice. f, Kaplan–Meier survival curves of mice with orthotopic model of GBM9 treated with vehicle or tofacitinib. g-h, H&E staining, SMI-31 immunostaining and quantification of SMI-31 counts in GBM9 orthotopic tumours from vehicle and tofacitinib treated mice. i-j, TUNEL staining and quantification of TUNEL positive cells in a GBM9 orthotopic tumour. k, Kaplan–Meier survival curves of mice with an orthotopic model of GBM6 treated with vehicle or tofacitinib. l-m, H&E staining, SMI-31 immunostaining and quantification of SMI-31 counts in GBM6 orthotopic tumour. n, ELISA for HB-EGF in the supernatants of multiple lines. o, Immunoblot of BIN3 expression in cells treated with tofacitinib or EGF. p, Knockdown efficiency of HB-EGF in GBM39 control shRNA and HB-EGF shRNA clones was confirmed by ELISA. q, Immunoblot of BIN3 expression in GBM39shHB-EGF (GBM39shHB-EGF_1) treated with either tofacitinib or EGF. r, Matrigel invasion assay of the inciated cells in the presence or absence of tofacitinib. s, Kaplan–Meier survival curves of mice with orthotopic models of GBM39shCtrl and GBM39shHB-EGF treated with vehicle or tofacitinib (n=8/group). t-u, H&E staining, SMI-31 immunostaining and quantification of SMI-31 counts in GBM39shHB-EGF and GBM39shCtrl orthotopic tumours from vehicle and tofacitinib treated mice. The Western blot images are representative of three independent biological replicates. Actin served as the loading control. Scale bars: 50 μM. Data are represented as mean ± SEM from three independent experiments. Statistical significance was determined by log-rank test (a, f, k, s), or by two-tailed unpaired Student’s t-test (c, e, h, j, m, u), or by one-way ANOVA adjusted by Bonferroni’s correction (n, p), or by two-way ANOVA adjusted by Bonferroni’s correction (r). *P <0.05, **P < 0.01, ***P < 0.001, ****P < 0.001, n.s. not significant. Numerical source data, statistic, exact P values and unprocessed blots are available as Source Data.
Figure 8
Figure 8. TCGA analysis of EGFR and EGFR ligands in GBM
a, The expression distribution of 7 EGFR ligands was represented by Fragments per Kilobase of transcript per Million (FPKM) among 154 primary GBM patients from The Cancer Genome Atlas (TCGA) with RNAseq data. b, Distribution of EGFR ligands signature score and EGFR copy numbers among 149 primary GBM patients from TCGA. EGFR ligands signature score was calculated by Single-sample Gene Set Enrichment Analysis (ssGSEA) of mRNA levels of 7 EGFR ligands. Details are described in the methods. GBM cases with EGFR copy number over 4 were defined as EGFR amplification. c, Kaplan-Meier survival analysis of the four groups of patients as described in b. The Log-rank test was used to identify EGFR ligands’ dual and opposite effects on prognosis between EGFR amp (amplification) and non-amp (non-amplification) GBM patients.* P <0.05, ***: P <0.001. Hazard Ratio (HR): groups with high ligands scores comparing to groups with low scores. d, Overall survival (OS) analysis according to pEGFR expression in GBM patients. The 204 primary TCGA-GBM patients were divided into high-50% and low-50% groups by pEGFR (Y1068) expression level and the effect on survival was examined (N=204). e, EGFR, ERBB2, ERBB3, and ERBB4 mRNA levels in EGFR amplified samples. Primary TCGA-GBM samples with DNAseq and RNAseq data were divided by EGFR copy numbers. f, EGFR, ERBB2, ERBB3 and ERBB4 mRNA levels in EGFR amp samples. g-h, 7 EGFR ligands mRNA levels in EGFR non-amp and amp samples. i, Overall survival analysis according to signature score of 7 EGFR ligands in patients with classical subtype of GBM. Statistical significance was determined by log-rank test (c, i), or by Gehan-Breslow-Wilcoxon test (d). Numerical source data, statistic and unprocessed blots are available as Source Data.

Comment in

  • EGFR ligands dictate tumour suppression.
    Beytagh MC, Weiss WA. Beytagh MC, et al. Nat Cell Biol. 2022 Aug;24(8):1189-1191. doi: 10.1038/s41556-022-00967-z. Nat Cell Biol. 2022. PMID: 35915160 Free PMC article.

References

    1. Ramnarain DB, Park S, Lee DY, Hatanpaa KJ, Scoggin SO, Otu H, Libermann TA, Raisanen JM, Ashfaq R, Wong ET, Wu J, Elliott R, and Habib AA (2006) Differential gene expression analysis reveals generation of an autocrine loop by a mutant epidermal growth factor receptor in glioma cells, Cancer Res 66, 867–874. - PubMed
    1. Chakraborty S, Li L, Puliyappadamba VT, Guo G, Hatanpaa KJ, Mickey B, Souza RF, Vo P, Herz J, Chen MR, Boothman DA, Pandita TK, Wang DH, Sen GC, and Habib AA (2014) Constitutive and ligand-induced EGFR signalling triggers distinct and mutually exclusive downstream signalling networks, Nat Commun 5, 5811. - PMC - PubMed
    1. Mishima K, Higashiyama S, Asai A, Yamaoka K, Nagashima Y, Taniguchi N, Kitanaka C, Kirino T, and Kuchino Y (1998) Heparin-binding epidermal growth factor-like growth factor stimulates mitogenic signaling and is highly expressed in human malignant gliomas, Acta Neuropathol (Berl) 96, 322–328. - PubMed
    1. Hatanpaa KJ, Burma S, Zhao D, Habib AA (2010) Epidermal growth factor receptor (EGFR) in glioma: Signal transduction, neuropathology, imaging and radioresistance Neoplasia 12, 675–684. - PMC - PubMed
    1. An Z, Aksoy O, Zheng T, Fan QW, and Weiss WA (2018) Epidermal growth factor receptor and EGFRvIII in glioblastoma: signaling pathways and targeted therapies, Oncogene 37, 1561–1575. - PMC - PubMed

Publication types