Meta-Analysis
. 2022 Aug;54(8):1167-1177.
doi: 10.1038/s41588-022-01115-x. Epub 2022 Aug 1.

Cross-ancestry genome-wide meta-analysis of 61,047 cases and 947,237 controls identifies new susceptibility loci contributing to lung cancer

Jinyoung Byun #  1   2 Younghun Han #  1   2 Yafang Li #  1   2   3 Jun Xia #  1   4 Erping Long #  5 Jiyeon Choi  5 Xiangjun Xiao  1 Meng Zhu  6 Wen Zhou  1 Ryan Sun  7 Yohan Bossé  8 Zhuoyi Song  1   4 Ann Schwartz  9   10 Christine Lusk  9   10 Thorunn Rafnar  11 Kari Stefansson  11 Tongwu Zhang  5 Wei Zhao  5 Rowland W Pettit  1 Yanhong Liu  2   3 Xihao Li  12 Hufeng Zhou  12 Kyle M Walsh  13 Ivan Gorlov  1   2   3 Olga Gorlova  1   2   3 Dakai Zhu  1   2 Susan M Rosenberg  3   4 Susan Pinney  14 Joan E Bailey-Wilson  15 Diptasri Mandal  16 Mariza de Andrade  17 Colette Gaba  18 James C Willey  18 Ming You  19 Marshall Anderson  14 John K Wiencke  20 Demetrius Albanes  5 Stephan Lam  21 Adonina Tardon  22 Chu Chen  23 Gary Goodman  24 Stig Bojeson  25   26 Hermann Brenner  27   28   29 Maria Teresa Landi  5 Stephen J Chanock  5 Mattias Johansson  30 Thomas Muley  31   32 Angela Risch  31   32   33   34 H-Erich Wichmann  35 Heike Bickeböller  36 David C Christiani  37 Gad Rennert  38 Susanne Arnold  39 John K Field  40 Sanjay Shete  7   41 Loic Le Marchand  42 Olle Melander  43 Hans Brunnstrom  43 Geoffrey Liu  44 Angeline S Andrew  45 Lambertus A Kiemeney  46 Hongbing Shen  47 Shanbeh Zienolddiny  48 Kjell Grankvist  49 Mikael Johansson  50 Neil Caporaso  5 Angela Cox  51 Yun-Chul Hong  52 Jian-Min Yuan  53 Philip Lazarus  54 Matthew B Schabath  55 Melinda C Aldrich  56 Alpa Patel  57 Qing Lan  5 Nathaniel Rothman  5 Fiona Taylor  51 Linda Kachuri  58 John S Witte  59 Lori C Sakoda  60 Margaret Spitz  2 Paul Brennan  30 Xihong Lin  12 James McKay  30 Rayjean J Hung  61   62 Christopher I Amos  63   64   65
Affiliations
Meta-Analysis

Cross-ancestry genome-wide meta-analysis of 61,047 cases and 947,237 controls identifies new susceptibility loci contributing to lung cancer

Jinyoung Byun et al. Nat Genet. 2022 Aug.

Abstract

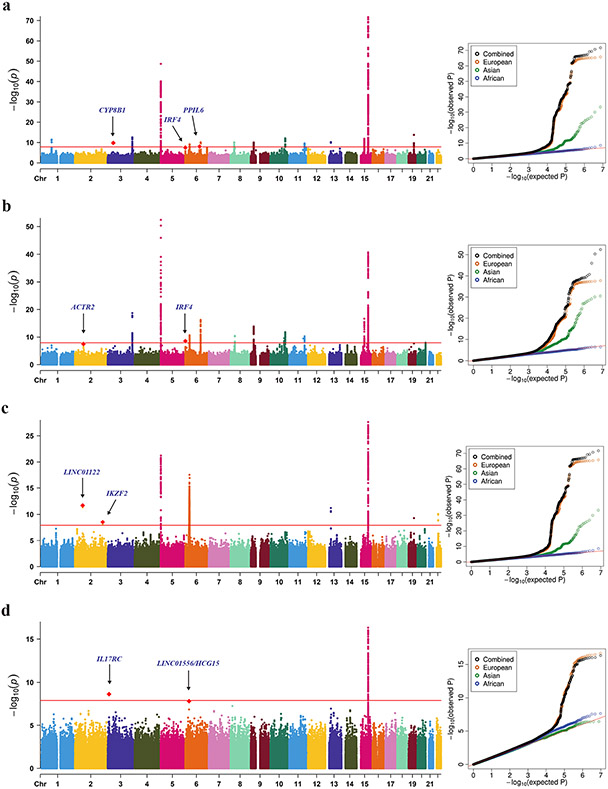
To identify new susceptibility loci to lung cancer among diverse populations, we performed cross-ancestry genome-wide association studies in European, East Asian and African populations and discovered five loci that have not been previously reported. We replicated 26 signals and identified 10 new lead associations from previously reported loci. Rare-variant associations tended to be specific to populations, but even common-variant associations influencing smoking behavior, such as those with CHRNA5 and CYP2A6, showed population specificity. Fine-mapping and expression quantitative trait locus colocalization nominated several candidate variants and susceptibility genes such as IRF4 and FUBP1. DNA damage assays of prioritized genes in lung fibroblasts indicated that a subset of these genes, including the pleiotropic gene IRF4, potentially exert effects by promoting endogenous DNA damage.


Figures

Extended Data Fig. 1
Extended Data Fig. 1. LocusZoom regional plots of newly identified cross-ancestry genetic variants.
Newly identified cross-ancestry variant is colored in purple, and colors of other dots indicate linkage disequilibrium measure r2 with the lead variant in purple. (a-b) Regional association plots at the CYP8B1 and IRF4 locus, in overall lung cancer (Lung). (c) Regional association plot at the ACTR2 locus in lung adenocarcinoma (ADE). (d) Regional association plot at the LINC01122 locus in lung squamous cell carcinoma (SQC). (e) Regional association plot at the IL17RC locus in small cell lung cancer (SCC).
Extended Data Fig. 2
Extended Data Fig. 2. Gating strategies for DNA damage assays.
(a-c) Gating strategy, associated with Figure 3a. (d) histograms of γH2AX in EmGFP-FUBP1 and EmGFP-Tubulin overproducing cells. (e-g) Gating strategy, associated with Figure 3b. (h-j) Gating strategy, associated with methods: flow-cytometric DNA damage assays, Q2/Q2+Q3 calculation in overproduction experiments.
Extended Data Fig. 3
Extended Data Fig. 3. Inference of ancestry membership in three intercontinental populations using FastPop.
The colored points in grey indicate 70,639 individuals from diverse populations. Those in orange, green, and blue denote HapMap samples with European (CEU), East Asian (CHB), African (YRI) ancestry, respectively.
Figure 1
Figure 1
Manhattan plots and quantile-quantile plots of the GWAS meta-analysis for lung cancer in the cross-ancestry analyses. (a) Lung carcinoma: 35,732 cases and 34,424 controls. (b) Lung adenocarcinoma: 15,359 cases and 32,558 controls. (c) Lung squamous cell carcinoma: 7,896 cases and 32,558 controls. (d) Small cell lung carcinoma: 2,499 cases and 32,558 controls. The x-axis represents chromosomal location, and the y-axis −log10(P-value). The gene annotation for newly identified loci are in blue. The red horizontal line denotes the Bonferroni-corrected genome-wide significant two-sided P-value of P = −log10(1.25 × 10⁻⁸). P-values are based on random binary-effects meta-analysis of three ancestry-specific summary statistics adjusted for principal components and study sites using Firth test.
Figure 2.
Figure 2.
Functional validation of the prioritized genes from cross-ancestry lung cancer GWAS. (a, c) eQTL signals in GTEx v8 lung tissues (n = 515) for IRF4 (a) and FUBP1 (c) colocalize with those of overall lung cancer GWAS by eCAVIAR (CLPP = 0.976 for rs12203592 and 1.000 for rs34517439) and coloc (PPH4 = 0.979 for rs12203592 and 0.996 for rs34517439). Pearson correlation is shown between log-transformed P values of eQTL (y-axis) and GWAS (x-axis). Variants are color-coded based on the LD R2 (1000 Genomes, EUR, phase 3) with the candidate variants (red dots). Variants with imputation quality > 0.6 were plotted in this region. (b, d) Regional association plots of eQTL (blue shadow) and GWAS (green shadow) within +/− 100kb of rs12203592 (b) and rs34517439 (d) are presented. The horizontal line indicates Bonferroni-corrected genome-wide significant P-value for GWAS (1.25×10⁻⁸) and genome-wide empirical P-value threshold for eQTL of IRF4 (1×10⁻⁴) or FUBP1 (1.8×10⁻⁴). UCSC genes tracks are displayed as the full mode in this region.
Figure 3.
Figure 3.
Dysregulation of cross-ancestry lung cancer GWAS-nominated risk genes promotes DNA damage. (a, b) A flow-cytometric screen for lung cancer DNA damageome genes and proteins. (a) Overproduction screen. Upper: assay scheme, N-terminal EmGFP fusions of lung cancer risk genes were transiently overproduced for 72hours, followed by DNA damage detection using flow cytometry. Lower: normalized γH2AX level of each of the overproduction candidate (GFP positive cells). FUBP1 (Representative histogram shown in the upper right corner), CCDC97, IRF4, DCBLD1, SECISBP2L, CCDC97, CYP21A2, and AK9 promote DNA damage when overexpressed. Gating strategy is shown in Extended Data figure 2 (a-d). All candidates are normalized to the median γH2AX intensity of GFP+ Tubulin (Tub) overproducing cells. mean ± SEM, n>=6. Two sample two-sided t-test assuming equal variances, * P < 0.00263 after Bonferroni correction, exact P-values in Supplementary table 20. (b) siRNA knockdown screen identifies PPIL6 as loss-of-function DNA damageome gene. Upper: assay scheme, siRNAs targeting several lung cancer risk genes were transfected for 72 hours to achieve knockdown, followed by DNA damage measurements by flow cytometry. Lower left: normalized DNA damage for each siRNA knockdown. γH2AX-high cells are quantified using a threshold described in the methods, and gating strategy is shown in Extended Data figure 2 (e-g). All candidates are normalized to non-targeting (NT) pooled siRNAs. mean ± SEM, n>=6. Two sample t-test assuming unequal variances, * P < 0.0125 after Bonferroni correction, exact P-values in Supplementary table 20.

References

    1. Sampson JN et al. Analysis of Heritability and Shared Heritability Based on Genome-Wide Association Studies for Thirteen Cancer Types. J Natl Cancer Inst 107, djv279 (2015). - PMC - PubMed
    1. Bosse Y & Amos CI A Decade of GWAS Results in Lung Cancer. Cancer Epidemiol Biomarkers Prev 27, 363–379 (2018). - PMC - PubMed
    1. Park SL, Cheng I & Haiman CA Genome-Wide Association Studies of Cancer in Diverse Populations. Cancer Epidemiol Biomarkers Prev 27, 405–417 (2018). - PMC - PubMed
    1. Popejoy AB & Fullerton SM Genomics is failing on diversity. Nature 538, 161–164 (2016). - PMC - PubMed
    1. Rosenberg NA et al. Genome-wide association studies in diverse populations. Nat Rev Genet 11, 356–66 (2010). - PMC - PubMed

Methods-only references

    1. Ji X et al. Protein-altering germline mutations implicate novel genes related to lung cancer development. Nat Commun 11, 2220 (2020). - PMC - PubMed
    1. Lan Q et al. Genome-wide association analysis identifies new lung cancer susceptibility loci in never-smoking women in Asia. Nat Genet 44, 1330–5 (2012). - PMC - PubMed
    1. Byun J et al. Genome-wide association study of familial lung cancer. Carcinogenesis 39, 1135–1140 (2018). - PMC - PubMed
    1. Landi MT et al. Environment And Genetics in Lung cancer Etiology (EAGLE) study: an integrative population-based case-control study of lung cancer. BMC Public Health 8, 203 (2008). - PMC - PubMed
    1. McKay JD et al. Large-scale association analysis identifies new lung cancer susceptibility loci and heterogeneity in genetic susceptibility across histological subtypes. Nat Genet 49, 1126–1132 (2017). - PMC - PubMed

Publication types

MeSH terms