. 2022 Aug;25(8):1020-1033.
doi: 10.1038/s41593-022-01127-0. Epub 2022 Aug 1.

Peripheral apoE4 enhances Alzheimer's pathology and impairs cognition by compromising cerebrovascular function

Affiliations

Peripheral apoE4 enhances Alzheimer's pathology and impairs cognition by compromising cerebrovascular function

Chia-Chen Liu et al. Nat Neurosci. 2022 Aug.

Abstract

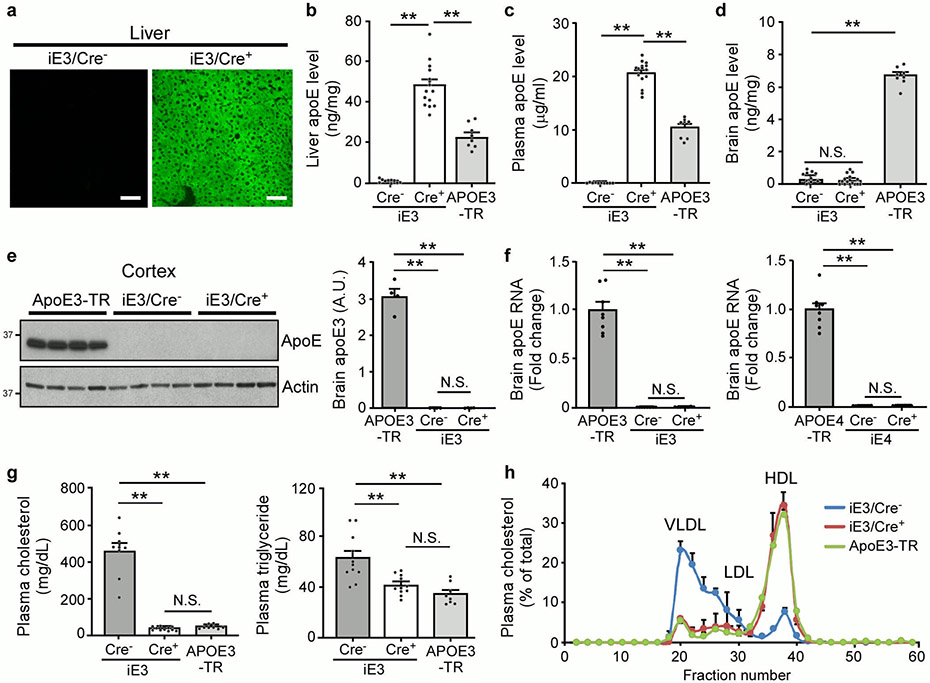
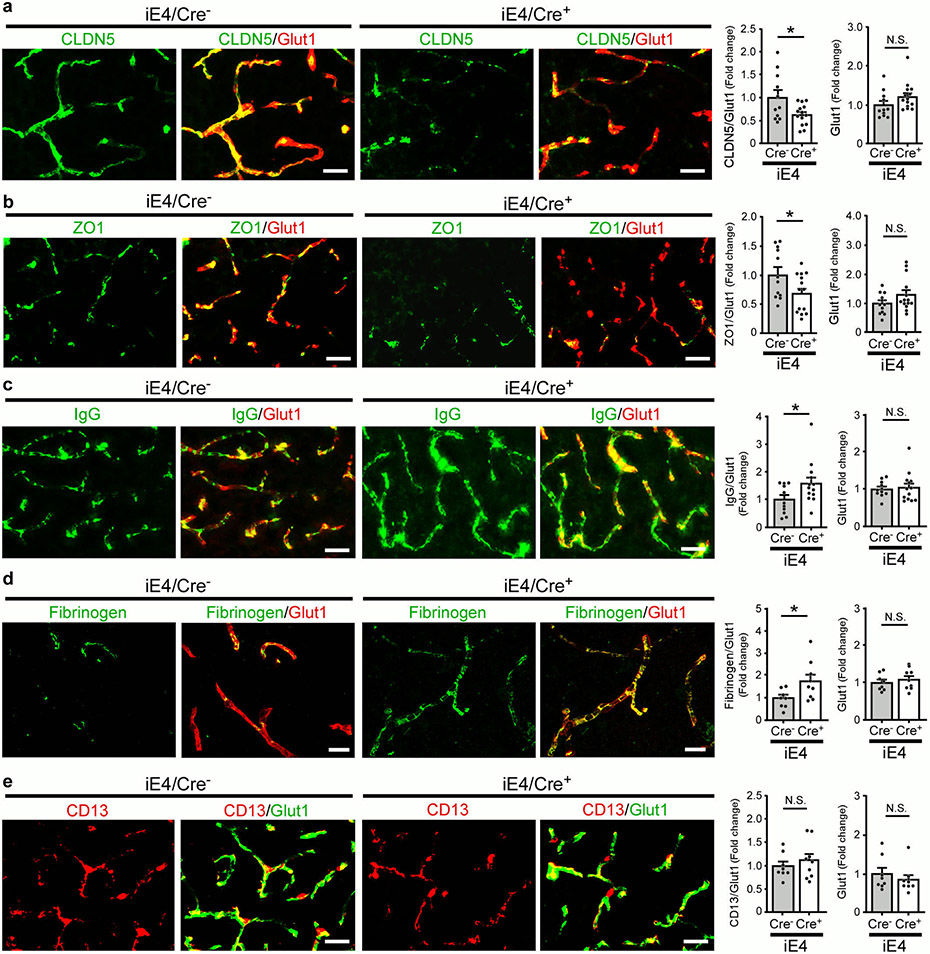
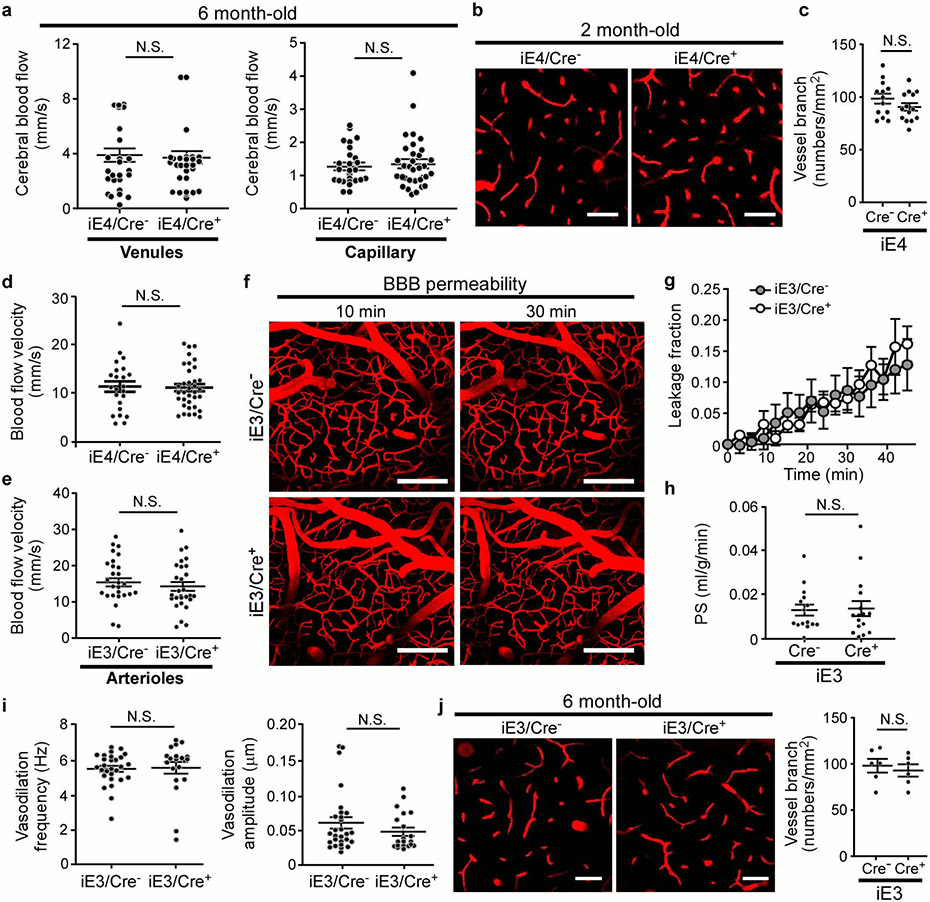
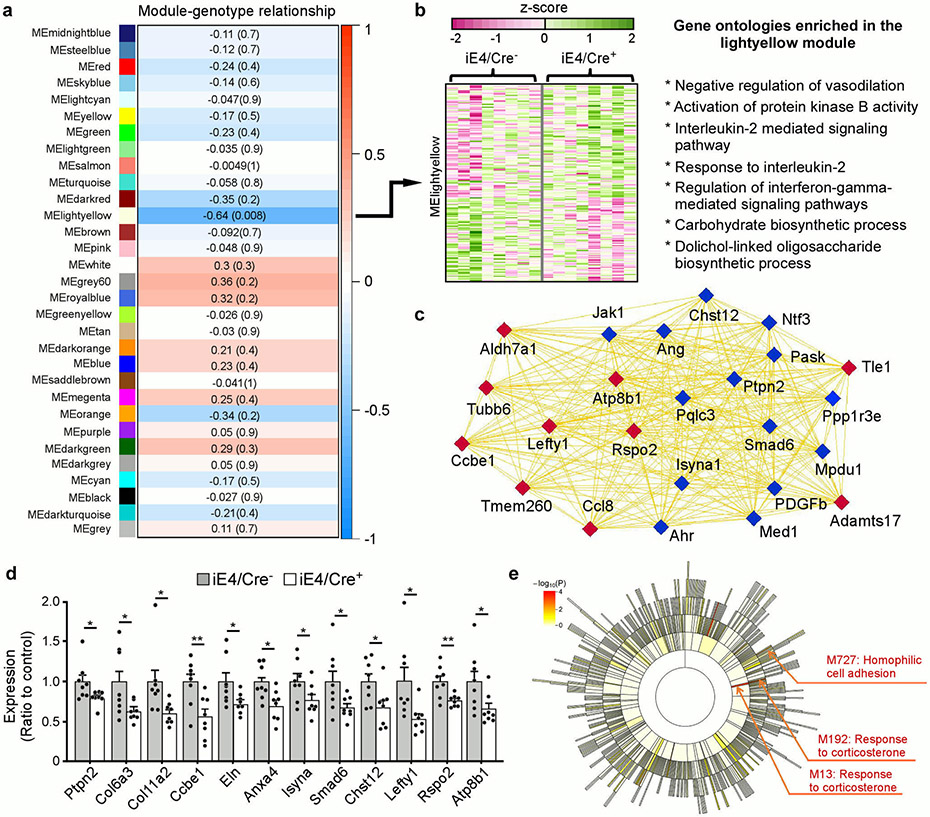
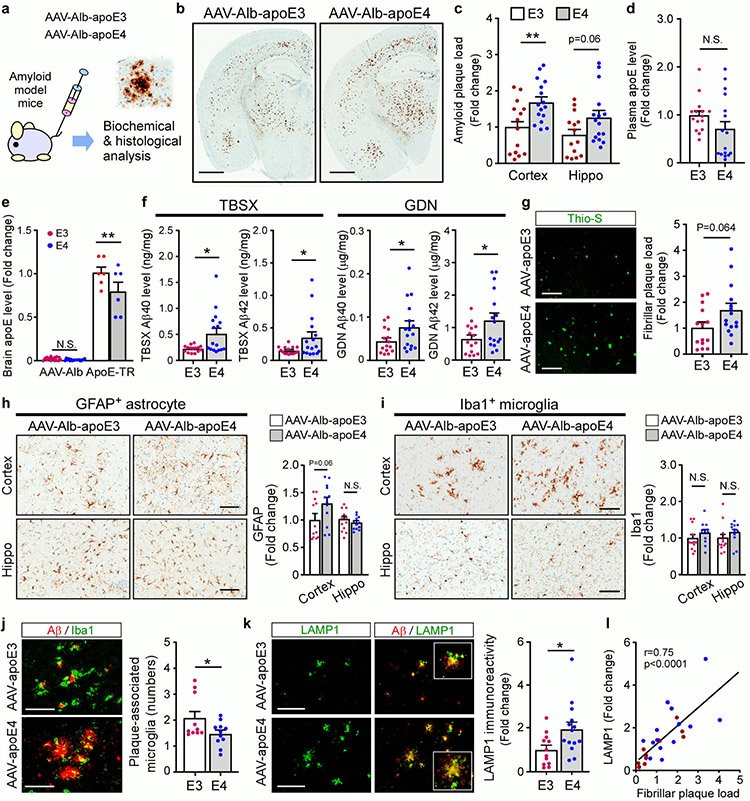
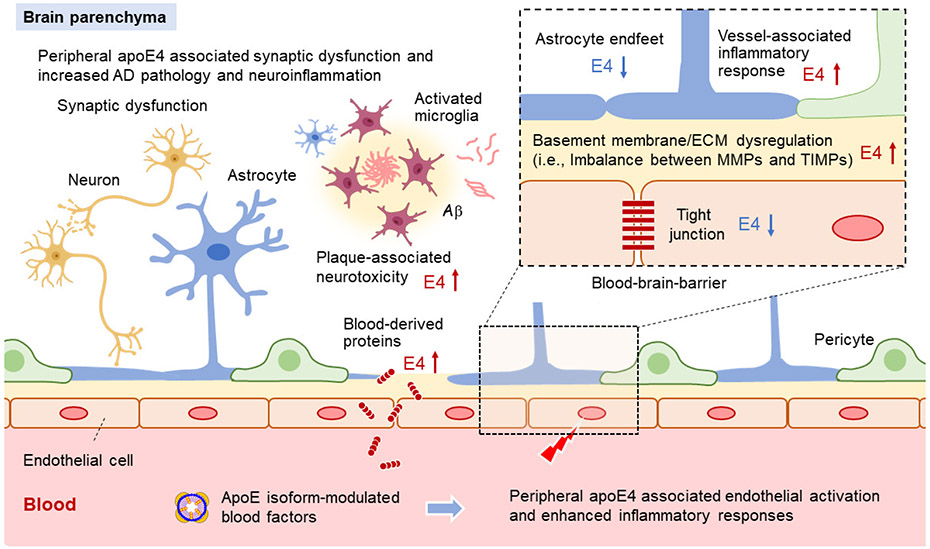
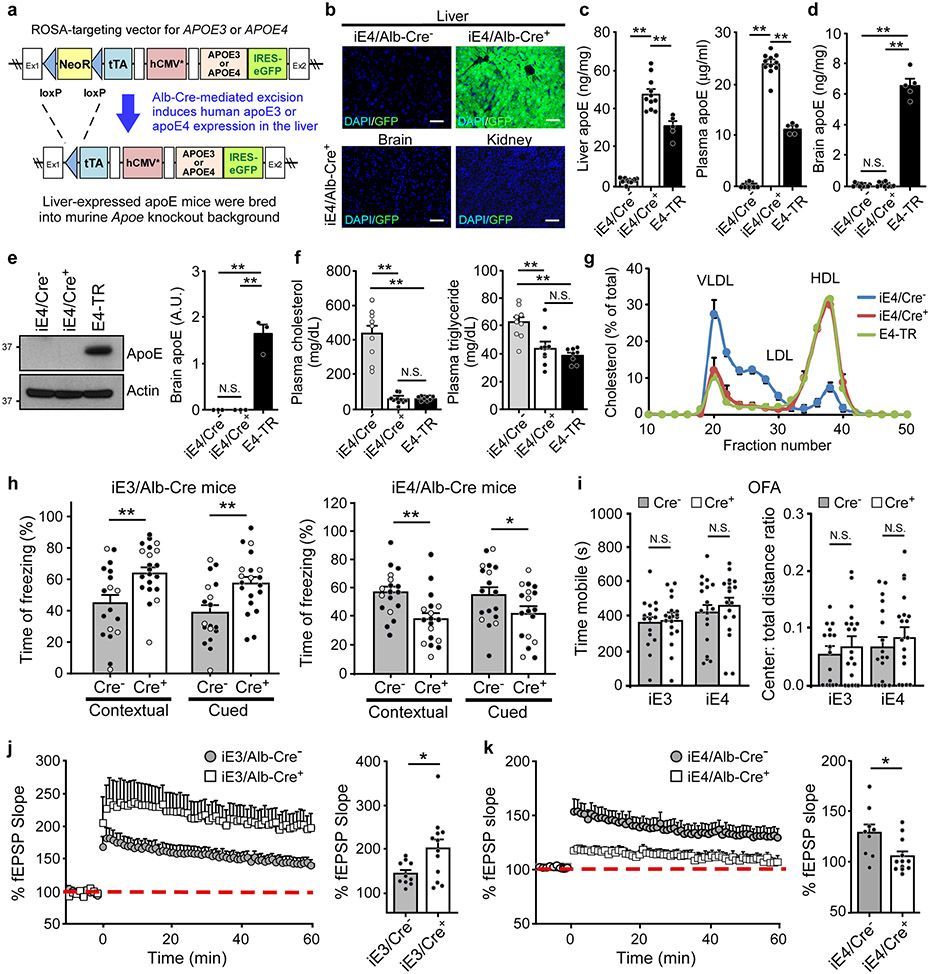
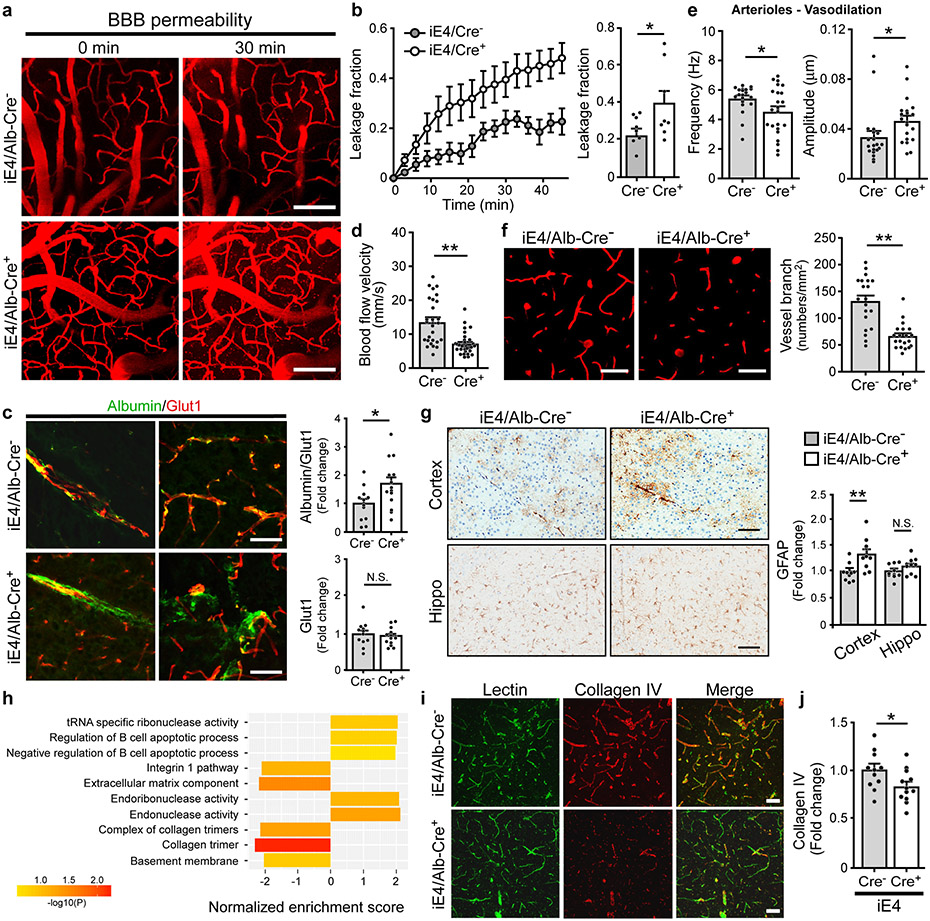
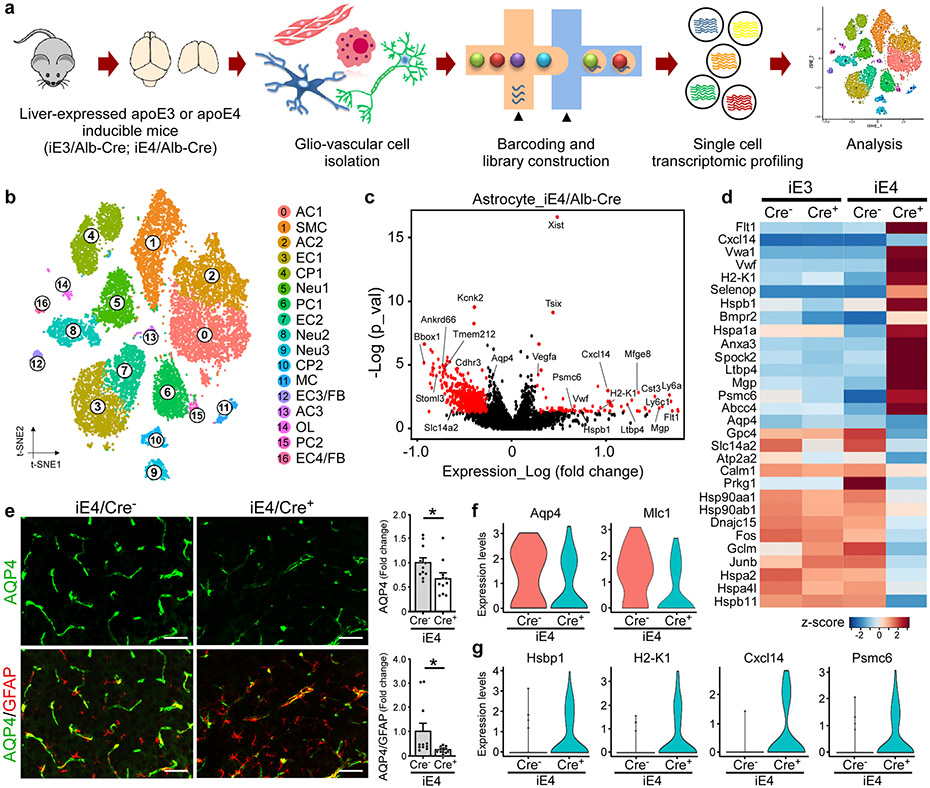
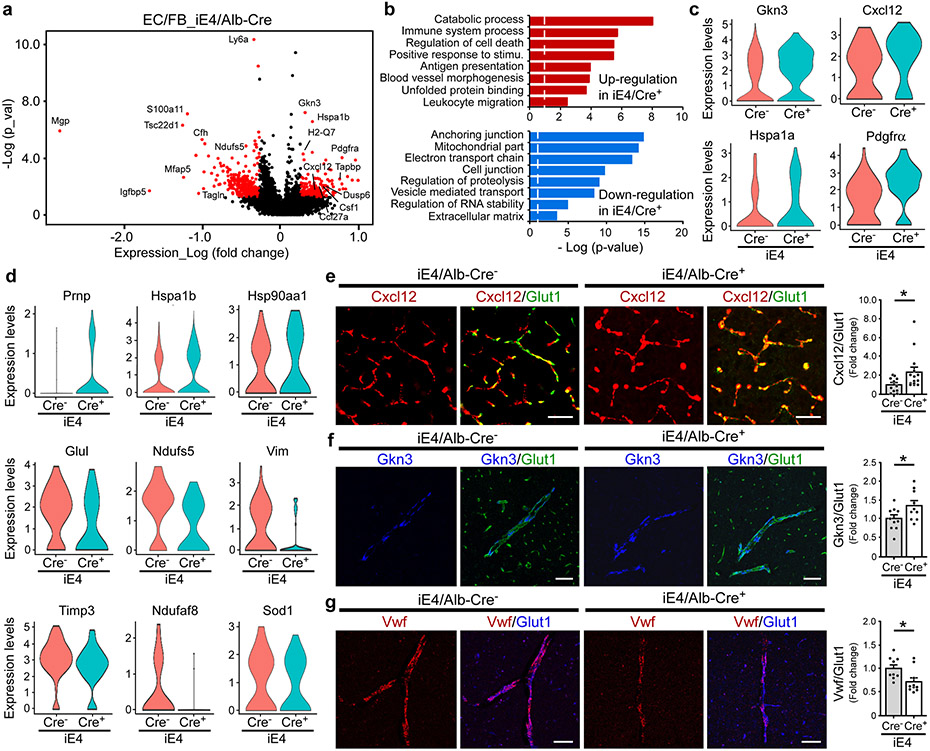
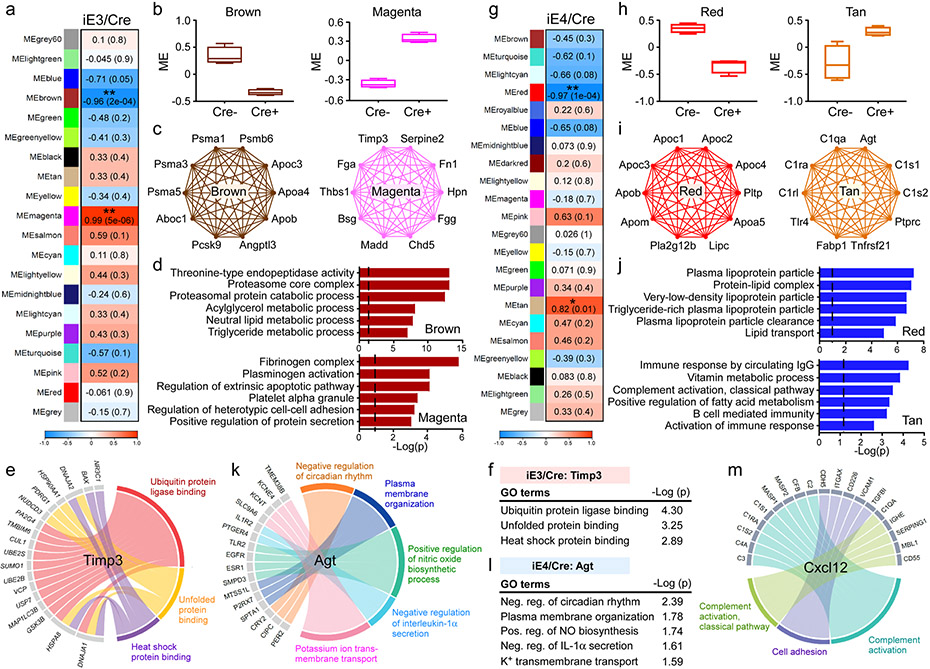
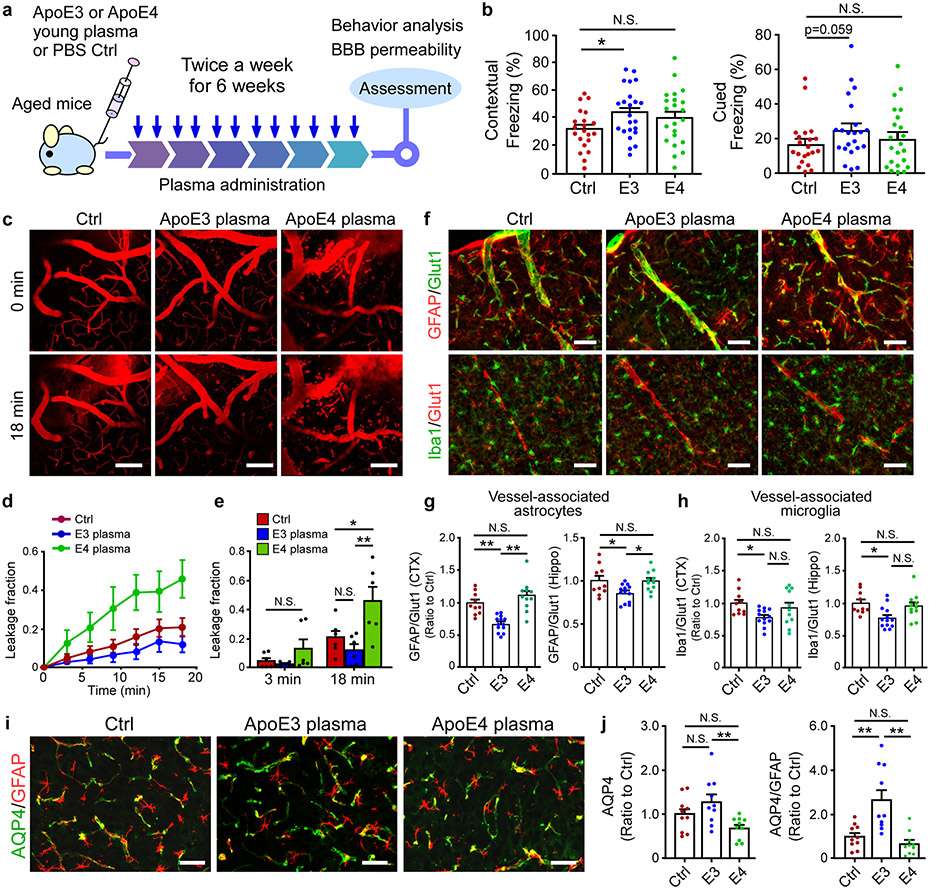
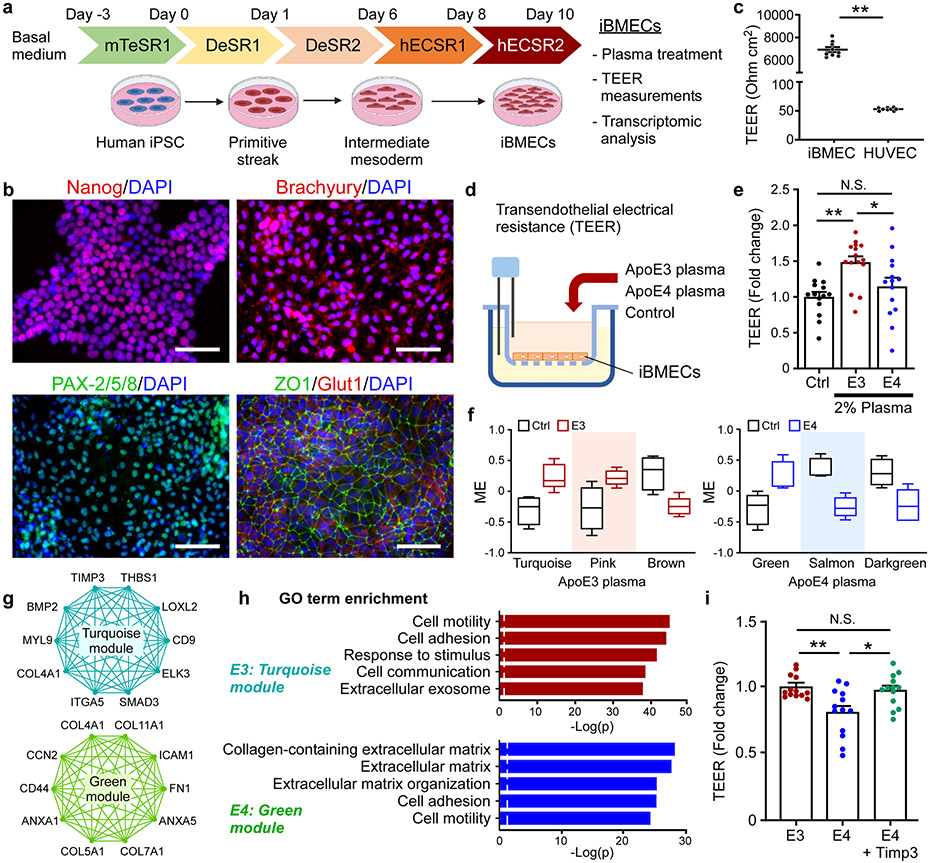
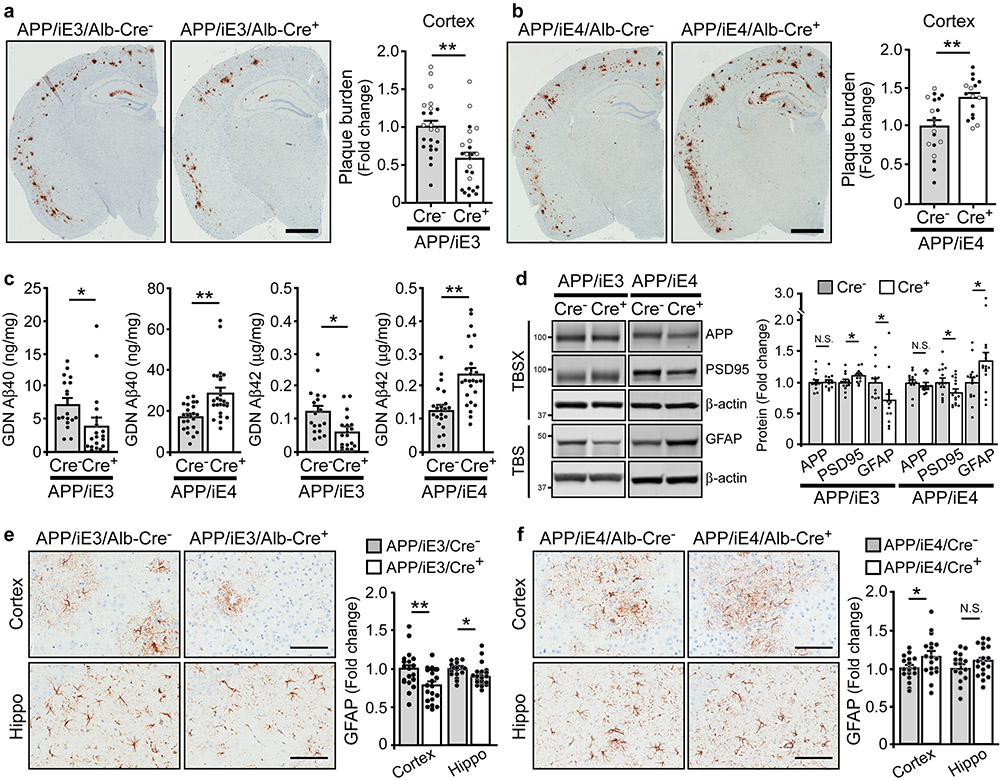
The ε4 allele of the apolipoprotein E (APOE) gene, a genetic risk factor for Alzheimer's disease, is abundantly expressed in both the brain and periphery. Here, we present evidence that peripheral apoE isoforms, separated from those in the brain by the blood-brain barrier, differentially impact Alzheimer's disease pathogenesis and cognition. To evaluate the function of peripheral apoE, we developed conditional mouse models expressing human APOE3 or APOE4 in the liver with no detectable apoE in the brain. Liver-expressed apoE4 compromised synaptic plasticity and cognition by impairing cerebrovascular functions. Plasma proteome profiling revealed apoE isoform-dependent functional pathways highlighting cell adhesion, lipoprotein metabolism and complement activation. ApoE3 plasma from young mice improved cognition and reduced vessel-associated gliosis when transfused into aged mice, whereas apoE4 compromised the beneficial effects of young plasma. A human induced pluripotent stem cell-derived endothelial cell model recapitulated the plasma apoE isoform-specific effect on endothelial integrity, further supporting a vascular-related mechanism. Upon breeding with amyloid model mice, liver-expressed apoE4 exacerbated brain amyloid pathology, whereas apoE3 reduced it. Our findings demonstrate pathogenic effects of peripheral apoE4, providing a strong rationale for targeting peripheral apoE to treat Alzheimer's disease.


Figures

Extended Data Fig. 1.
Extended Data Fig. 1.. Liver-expressed apoE3 restores peripheral lipid profiles.
a, EGFP, a surrogate of apoE expression, was detected in liver of iE3/Cre+ but not iE3/Cre mice. Similar results were observed in at least three independent experiments. Scale bar, 50 μm. b-d, ApoE levels in the liver, plasma, and brain of iE3/Cre, iE3/Cre+ (Cre, n=10; Cre+, n=15), and apoE3-TR (n=8) mice were examined by ELISA. **, P<0.0001. e, The apoE was not detected by Western blotting in the brains of iE3/Cre or iE3/Cre+ mice compared to apoE3-TR mice (n=4/group). **, P<0.0001. f, The RNA levels for apoE in the brains of iE3/Cre, apoE3-TR, iE4/Cre, and apoE4-TR mice (n=8/group) were examined by real-time PCR. **, P<0.0001. g, Total cholesterol and triglyceride levels in the plasma of iE3/Cre or iE3/Cre+ mice (Cre, n=9; Cre+, n=11) and apoE3-TR mice (n=8) were examined. Cholesterol: **, P<0.0001. Triglyceride: Cre vs. Cre+: **, P=0.002; Cre vs. E3: **, P=0.0002. h, Distribution of plasma lipoprotein cholesterol in iE3/Cre or iE3/Cre+ mice (n=3/group) at 12 months of age. Pooled plasma from apoE3-TR mice (n=3/group) was included as control. Data represent mean ± s.e.m. One-way analysis of variance (ANOVA) with Tukey’s post-hoc test was used for statistical analyses. N.S., not significant.
Extended Data Fig. 2.
Extended Data Fig. 2.. Expression of apoE4 in the liver leads to compromised tight junction integrity in the brain.
a, Brain sections from iE4/Cre or iE4/Cre+ mice (Cre, n=11; Cre+, n=14) at 12-13 months of age were immunostained with anti-claudin-5 (CLDN5; green) and anti-Glut1 (red) antibodies. The total Glut1 signals and the CLDN5 signals normalized against Glut1 were quantified. *, P=0.024. Scale bar, 25 μm. b, Brain sections from the iE4/Cre or the iE4/Cre+ mice (Cre, n=12; Cre+, n=14) at 12-13 months of age were immunostained with anti-ZO1 (green) and anti-Glut1 (red) antibodies. The total Glut1 signals and the ZO1 signals normalized against Glut1 were quantified. *, P=0.038. Scale bar, 25 μm. c, Brain sections from iE4/Cre or iE4/Cre+ mice (Cre, n=11; Cre+, n=13) at 12-13 months of age were immunostained with anti-IgG (green) and anti-Glut1 (red) antibodies. The total Glut1 signals and the IgG signals normalized against Glut1 were quantified. *, P=0.047. Scale bar, 10 μm. Data represent mean ± s.e.m. d, Brain sections from iE4/Cre or iE4/Cre+ mice (Cre, n=8; Cre+, n=9) at 12-13 months of age were immunostained with anti-fibrinogen (green) and anti-Glut1 (red) antibodies. The total Glut1 signals and the fibrinogen signals normalized against Glut1 were quantified. *, P=0.034. Scale bar, 10 μm. Data represent mean ± s.e.m. e, Brain sections from the iE4/Cre or iE4/Cre+ mice (Cre, n=8; Cre+, n=9) at 12-13 months of age were immunostained with anti-CD13 (red) for pericytes and anti-Glut1 (green) antibodies. The total Glut1 signals and the CD13 signals normalized against Glut1 were quantified. Scale bar, 25 μm. Data represent mean ± s.e.m. N.S., not significant, two-tailed Student's t-test.
Extended Data Fig. 3.
Extended Data Fig. 3.. Cerebral vascular function in mice expressing apoE3 or apoE4 in the liver by two-photon imaging.
a-d, The BBB integrity, CBF, and vasomotion in the arterioles of iE4/Cre and iE4/Cre+ mice were assessed by two-photon imaging. a, CBF in the cerebral veins and capillaries of iE4/Cre or iE4/Cre+ mice at 6-7 months of age were measured. Each data point represents blood vessel-related measurement with various number of measurements in each animal from 5 animals per genotype. b, c, Vessel branch densities in the cerebral arterioles of iE4/Cre or iE4/Cre+ mice (Cre, n=3; Cre+, n=3) at 1.5~2 months of age were assessed. Scale bar, 50 μm. d, CBF in the cerebral arterioles of iE4/Cre or iE4/Cre+ mice at young age (1.5~2-month-old) was examined. e-j, BBB permeability, CBF, and vasomotion in the arterioles of iE3/Cre and iE3/Cre+ mice (Cre, n=3; Cre+, n=3) at 6-7 months of age were assessed by two-photon imaging. Each data point represents blood vessel-related measurement with various number of measurements in each animal from 3 animals per genotype. e, CBF in the cerebral arterioles of iE3/Cre and iE3/Cre+ mice was examined. f, BBB integrity was examined after intravenous injection of Texas Red conjugated dextran (40 kDa) for 30 mins. Scale bar, 100 μm. g, Fractions of BBB leakage over time are shown. h, BBB leakage, calculated as BBB permeability surface (PS) area product for Texas Red-conjugated dextran, in the cortex of iE3/Cre mice was quantified. i, The frequency and amplitude of arteriolar oscillation in iE3/Cre and iE3/Cre+ mice were measured. j, Vessel branch densities in the cerebral arterioles of iE3/Cre and iE3/Cre+ mice were examined. Scale bar, 50 μm. Data expressed as mean ± s.e.m. N.S., not significant, two-tailed Student's t-test.
Extended Data Fig. 4.
Extended Data Fig. 4.. Peripheral apoE4 expression is associated with gene expression profiles consistent with reduced vascular functions and compromised energy homeostasis.
Brain cortical tissues from iE4/Cre mice (Cre, n=8; Cre+, n=8) at 12-13 month of age were subjected to RNA-Sequencing. a, Module-genotype correlation. Each rectangle represents a module and selected modules are shown. The number in the front of each module is the correlation coefficient (r) between the module eigengene to genotype; the correlation p-value is in the parentheses. Red represents positive correlation to iE4/Cre+ and blue represents negative correlation to iE4/Cre+. b, Heatmaps of genes within the lightyellow module and selected gene ontologies enriched in the module. c, Interaction of genes involved in the gene ontologies (blue nodes) and hub genes (red nodes) in the lightyellow module. The thickness of the lines represents the strength of gene-gene connection. d, Expression of collagen family members (i.e., Col6a3, Col11a2), collagen and calcium binding EGF domain-containing protein 1 (Ccbe1), elastin (Eln), annexin A4 (Anxa4), and genes involved in carbohydrate biosynthetic process as well as the hub genes (Lefty1, Rspo2 and Atp8b1) in the lightyellow module shown in (c) were validated in iE4/Cre mice (Cre, n=8; Cre+, n=8) by real-time PCR analysis. Data expressed as mean ± s.e.m. Ptpn2 (*, P=0.042); Col6a3 (*, P=0.036); Col1a2 (*, P=0.027); Ccbe1 (**, P=0.006); Eln (*, P=0.04); Anxa4 (*, P=0.014); lsyna (*, P=0.047); Smad6 (*, P=0.041); Chst12 (*, P=0.028); Lefty1 (*, P=0.021); Rspo2 (**, P=0.006); Atp8b1 (*, P=0.031), two-tailed Student's t-test. e, Sunburst plot showing the module hierarchical structure relationship. Each rectangular block denotes a module. A total of 1002 modules were identified in the E4 network, with module size ranging from 10 to 960. The color intensity denotes the FDR adjusted P value significance of GSEA based enrichment for differential expression signals. Functional annotations are highlighted for modules overrepresented with GO/pathway genes (red text for positive GSEA enrichment score with regard to differential expression signal).
Extended Data Fig. 5.
Extended Data Fig. 5.. Evaluation of glio-vascular-enriched single cell transcriptomics in mice with peripheral expression of apoE isoforms.
Brain cortical tissues from iE3/Cre and iE4/Cre mice (n=4/genotype) at 12-13 months of age were subjected to vascular and glial cell-enriched single cell RNA-sequencing (scRNA-seq). a, Feature plot of canonical markers defining major cell types. b, Split dot plot depicting marker genes for each cell population in iE3/Cre and iE4/Cre scRNA-seq datasets. Marker genes were identified in an unbiased fashion blind to known cell type markers. The expression level (color intensity) and the percentage of cells in a cluster expressing a given gene (size) are reflected in circles (Cre, red; Cre+, blue). c, The proportions of cells in each cluster. d, The numbers for each major cell type identified are as follow: Astrocyte (5881), endothelial cell (3970), smooth muscle cell (2495), pericyte (1667), neuron (3014), choroid plexus (2212), microglia (252), and oligodendrocyte (206). The proportions of cell types are shown. e, The number of differentially-expressed genes (DEGs) in glio-vascular unit upon peripheral expression of apoE3 (red) or apoE4 (blue). AC, astrocyte; EC, endothelial cell; FB, fibroblast; SMC, smooth muscle cell; PC, pericyte; MC, myeloid cell; Neu, neuron; CP, choroid plexus.
Extended Data Fig. 6.
Extended Data Fig. 6.. Brain transcriptional changes in astrocytes influenced by peripheral apoE isoform expression.
a, Violin plots showing the mean and variance differences between iE4/Cre and iE4/Cre+ astrocytes for genes regulating oxidative stress, lipid metabolism, and hypoxia/stress responses (Selenop, Mfge8, Plpp3, and Vegfa). b, Gene ontology (GO) enrichment analysis for genes upregulated (red) or down-regulated (blue) in astrocytes from iE4/Cre+ mice compared to iE4/Cre mice. c, Top gene ontology and canonical pathways enriched for DEGs in the astrocytes from iE3/Cre and iE4/Cre mice were identified by gene set enrichment analysis (GSEA). d, Violin plots showing the mean and variance differences between iE4/Cre and iE4/Cre+ astrocytes for genes regulating astrocyte endfeet (Tmem212, Kcnj10, Sntn, Ankrd66, Stoml3, Pla2g7, Atp2a2). e, Volcano plot depicting up- and down-regulated genes in astrocytic cell populations (AC1, AC2, AC3) in iE3/Cre+ mice compared to iE3/Cre control mice. Genes significant at the P value ≤ 0.05 and fold change ≥ 1.2 are denoted in red. f, Violin plots showing the mean and variance differences between iE3/Cre and iE3/Cre+ astrocytes for genes regulating lactate homeostasis (Slc16a1), cellular protection (Psap and Selenow), immune response (Ifi27, Cox5a), and cellular senescence/stress response (Sod1 and Hspa5). g, Gene ontology enrichment analysis for genes up-regulated (orange) or down-regulated (green) in astrocytes from iE3/Cre+ mice compared to iE3/Cre control mice. Limma’s moderate t-test statistics were used to rank the transcriptome-wide gene-phenotype association.
Extended Data Fig. 7.
Extended Data Fig. 7.. Reduced vessel-associated astrocytes and microglia in aged mice treated with apoE3 young plasma.
Brain tissues from aged mice treated with Ctrl (PBS/sodium citrate), apoE3, or apoE4 young plasma were subjected to co-immunostaining for GFAP (astrocyte) or Iba1 (for microglia) together with Glut1 (endothelial marker). a, Representative images for the hippocampus of treated experimental mice are shown. Scale bar, 50 μm. b, Quantification of total GFAP and Glut1 (Ctrl: 10 mice; E3: 13 mice; E4: 11 mice) in the hippocampus. **, P<0.0001. c, Quantification of total Iba1 and Glut1 (Ctrl: 10 mice; E3: 13 mice; E4: 11 mice) in the hippocampus. d, e, Cortical brain tissues from young plasma-treated mice were co-stained for tight junction (TJ) protein ZO1 (green) and an endothelial marker Glut1 (red). Scale bar, 50 μm. e, The total ZO1 and TJ coverage (ZO1 against Glut1) was quantified (Ctrl: 10 mice; E3: 10 mice; E4: 10 mice). *, P=0.02; **, P=0.007. f, g, Cortical brain tissues from young plasma-treated mice were co-stained for TJ protein CLDN5 (green) and an endothelial marker Glut1 (red). Scale bar, 50 μm. g, The total CLDN5 and TJ coverage (CLDN5 against Glut1) was quantified (Ctrl: 10 mice; E3: 10 mice; E4: 9 mice). Ctrl vs. E3 (*, P=0.034); E3 vs. E4 (*, P=0.044). h, i, Cortical brain tissues from young plasma-treated mice were co-stained for blood protein fibrinogen (green) and an endothelial marker Glut1 (red). Scale bar, 50 μm. i, The total fibrinogen and the fibrinogen/Glut1 signal was quantified (Ctrl: 10 mice; E3: 10 mice; E4: 10 mice). Fibrinogen: Ctrl vs. E3 (*, P=0.04); E3 vs. E4 (*, P=0.045). Fibrinogen/Glut1: Ctrl vs. E3 (**, P=0.001); E3 vs. E4 (*, P=0.015). j, k, Cortical brain tissues from young plasma-treated mice were co-stained for a pericyte marker CD13 (green) and an endothelial marker Glut1 (red). Scale bar, 50 μm. k, The total CD13 signal and pericyte coverage (CD13 against Glut1) was quantified (Ctrl: 10 mice; E3: 10 mice; E4: 10 mice). b-k, Data represent mean ± s.e.m. N.S., not significant, one-way ANOVA with a Tukey’s post-hoc test.
Extended Data Fig. 8.
Extended Data Fig. 8.. Liver-specific expression of apoE3 decreases, whereas apoE4 increases Aβ plaque deposition.
a, Brain sections from 9-month-old APP/PS1 mice expressing apoE3 (Cre , n=21; Cre+, n=22) or apoE4 (Cre, n=19; Cre+, n=15) in the liver were immunostained with a pan-Aβ antibody. The Aβ plaque burden in the hippocampus was quantified. Black circle: male; Grey circle: female. E3: *, P=0.041; E4: **, P=0.009, two-tailed Student's t-test. b, Representative images of Aβ staining in the cortex of APP/Alb/iE3 or APP/Alb/iE4 mice (murine Apoe−/− background) are shown. Scale bar, 200 μm. Images from APP/iE mice (murine Apoe+/+ background) were included as visual representation. Note that only diffused plaques were observed in APP/Alb/iE3 or iE4 mice due to the absence of murine apoE in the brain. c, d, TBS- and TBSX-soluble Aβ40 and Aβ42 levels in the cortex of 9-month-old APP/iE3/Cre mice (Cre, n=18; Cre+, n=19) or APP/iE4/Cre mice (Cre, n=22; Cre+, n=25) were examined by specific Aβ ELISA. c, TBS-E3_Aβ40: *, P=0.036; Aβ42: *, P=0.045. TBS-E4_Aβ40: **, P=0.008; Aβ42: **, P=0.001. d, TBSX-E3_Aβ40: *, P=0.024; Aβ42: *, P=0.030. TBSX-E4_Aβ40: **, P=0.002; Aβ42: **, P=0.0003. e, f, Brain sections from APP/PS1 mice expressing apoE3 (Cre, n=8; Cre+, n=8) or apoE4 (Cre, n=6; Cre+, n=6) in the liver (murine Apoe−/− background) were labeled for fibrillar Aβ using Thioflavin S (Thio S). Scale bar (upper panels), 1 mm; Scale bar (bottom panels), 100 μm. Images from APP/iE mice (murine Apoe+/+ background) were included for comparison. The amount of fibrillar plaques in the APP/Alb/iE3 or APP/Alb/iE4 mice was minimal due to the absence of murine apoE in the brain. The percentage of area covered by Thio S-positive plaques in the cortex and hippocampus of experimental mice was quantified. g, h, Brain sections from 9-month-old APP/PS1 mice expressing apoE3 (Cre, n=27; Cre+, n=28) or apoE4 (Cre, n=19; Cre+, n=19) in the liver were immunostained with an Iba1 antibody. Scale bar, 100 μm. The immunoreactivity of Iba1 in cortex and hippocampus were quantified. Data expressed as mean ± s.e.m. Cortex: *, P = 0.011; Hippo: *, P = 0.030. N.S., not significant, two-tailed Student's t-test.
Extended Data Fig. 9.
Extended Data Fig. 9.. AAV-mediated liver expression of apoE4 enhances amyloid pathology and related toxicity.
a, Schematic illustration of the experimental paradigm. 5xFAD amyloid mice at 1-1.5 month of age were transduced with AAV-Alb-apoE3 or AAV-Alb-apoE4 virus via intravenous injection. b, c, The amyloid deposition in the brain of experimental mice at 4 months of age was examined by immunostaining for Aβ. Scale bar, 1 mm. The amyloid plaque burdens in the cortex and hippocampus (E3, n=14; E4, n=16) were quantified. **, P = 0.007. d, e, ApoE levels in the plasma and brain of experimental mice (E3, n=15; E4, n=16) were measured by ELISAs. **, P = 0.0098. f, TBSX-soluble and -insoluble (guanidine; GDN) Aβ40 and Aβ42 levels in the cortex of 4-month-old 5xFAD mice transduced with AAV-Alb-apoE3 (n=15) or AAV-Alb-apoE4 (n=16) were examined by specific Aβ ELISA. TBSX-Aβ40 (*, P = 0.012); TBSX-Aβ42 (*, P = 0.031). GDN-Aβ40 (*, P = 0.049); GDN-Aβ42 (*, P = 0.033). g, Thio S-positive plaques in the cortex of experimental mice were shown and quantified. Scale bar, 100 μm. h, i, Brain sections from experimental mice (n=12/genotype) were immunostained with GFAP or Iba1 antibody. Scale bar, 100 μm. The immunoreactivity of GFAP and Iba1 in cortex and hippocampus were quantified. j, Representative images of plaque-associated microglia in mice expressing apoE3 or apoE4 in the liver are shown. Scale bar, 50 μm. The number of Iba1-positive microglia (green) surrounding Aβ plaque (red) between 50-300 μm2 plaque sizes were quantified. Each dot represents the average value from an individual mouse (E3, n=10; E4, n=11). *, P = 0.049. k, Co-immunofluorescence staining of LAMP1 (green) and Aβ plaques (red) was used to examine plaque-associated neuritic dystrophy. Scale bar, 50 μm. The LAMP1 immunoreactivity was quantified. *, P = 0.027. l, LAMP1 immunoreactivity was positively correlated with Thio S-positive fibrillar plaques. c-l, Data represent mean ± s.e.m., two-tailed Student's t-test.
Extended Data Fig. 10.
Extended Data Fig. 10.. Potential mechanisms by which peripheral apoE4 impacts cerebrovascular integrity, brain function, and AD pathology.
Peripheral apoE4 may modulate plasma factors that promote inflammatory responses and hypoxia/stress in endothelial cells along with cells in the glio-vascular unit. Tight junction markers (i.e., Claudin-5 and ZO1) and astrocyte end-feet marker (i.e., AQP4) are down-regulated, whereas the dysregulation of ECM and vessel-associated gliosis are exacerbated in mice expressing apoE4 in the liver. Compromised BBB integrity along with an increase of blood-derived proteins (e.g., albumin, IgG, fibrinogen) in the brain, some of which have been shown to increase microglia-mediated oxidative stress and disrupt synaptic function, may contribute to cognitive deficits in apoE4 mice. Additionally, the impairment of cerebrovascular functions and altered microglial responses may directly or indirectly influence Aβ clearance and Aβ deposition, which together exacerbate amyloid pathology in apoE4 mice. Not depicted here, peripheral apoE3 expression may regulate blood factors that benefit the endothelial integrity and vascular health. For example, Timp3, previously shown to ameliorate the vascular diseases through inhibiting excess matrix metalloproteinase (MMP) activity and inflammation,, is elevated in apoE3 mice and increases apoE4 plasma-associated endothelial integrity in the human iPSC-derived cellular model.
Fig. 1 ∣
Fig. 1 ∣. Opposing effects of liver-expressed apoE3 and apoE4 on brain cognition and synaptic function.
a, The structure of the ROSA-targeting vector with the Tet-off regulatory cassette for APOE and eGFP expression. Breeding to Alb-Cre mice removed the loxP-flanked Neor gene and led to expression of human apoE3 or apoE4 in the liver. b, GFP was exclusively detected in the liver of iE4/Cre+ mice. Similar results were observed in at least three independent experiments. Scale bar, 50 μm. c, d, ApoE levels in the liver, plasma, or brain of iE4/Cre mice (Cre, n=11; Cre+, n=11) and apoE4-TR mice (n=5) at 12-13 months of age were examined by ELISA. **, P<0.0001. e, No apoE was detected in the brains of iE4/Cre mice (n=3/group) at 12-13 months of age by Western blotting. **, P=0.0002. f, Total cholesterol and triglyceride levels in the plasma of iE4/Cre mice (Cre, n=9; Cre+, n=10) and apoE4-TR mice (n=8) were examined. Cholesterol: **, P<0.0001; Triglyceride: **, P=0.003 (Cre vs. Cre+); P=0.0004. g, Distribution of plasma lipoprotein cholesterol in iE4/Cre or iE4/Cre+ mice (n=3/group). Pooled plasma from apoE4-TR mice (n=3) was included as controls. N.S., not significant. One-way analysis of variance (ANOVA) with Tukey’s post-hoc test. h, Memory performance of mice expressing apoE3 (Cre, n=18; Cre+, n=21 for contextual test; **, P=0.003; Cre, n=18; Cre+, n=20 for cued test; **, P=0.005) or apoE4 (Cre, n=18; Cre+, n=18; **, P=0.003; *, P=0.048) in the liver examined by fear conditioning tests. The percentage of time spent showing freezing behavior in response to stimulus is shown. Black circle: male; Grey circle: female. i, Analyses of anxiety-related behaviors in iE3/Cre (Cre, n=16; Cre+, n=19) and iE4/Cre mice (Cre, n=18; Cre+, n=18) assessed by open field analysis (OFA). N.S., not significant. j, k, Normalized fEPSP responses to field stimulation were summarized during recordings from the CA1 region of hippocampal slices from iE3/Cre mice (Cre, n=10; Cre+, n=12) or iE4/Cre mice (Cre, n=9; Cre+, n=12). Averages of the last 5 min of fEPSP recording were quantified. Data represent mean ± s.e.m.; iE3: *, P=0.03; iE4: *, P=0.018, two-tailed Student's t-test.
Fig. 2 ∣
Fig. 2 ∣. Compromised cerebrovascular integrity and astrogliosis associated with liver-specific expression of apoE4.
a-e, Two-photon imaging was used to assess vascular functions in male iE4/Cre mice (Cre, n=5; Cre+, n=5) at 6-7 months of age. b, d-f, In two-photon analyses, each data point represents blood vessel-related observation with varying number of measurements in each animal from 5 mice per genotype. a, The representative images at 0 and 30 mins after dextran injection are shown. Scale bar, 100 μm. b, The leakage of dextran signals were monitored over time (left panel). The fraction of BBB leakage at 30 min after injection of dextran was quantified (right panel). *, P=0.045. c, Brain sections from iE4/Cre mice (Cre, n=12; Cre+, n=14) at 12-13 months of age were immunostained with albumin and Glut1 antibodies. The total Glut1 (red) and the albumin (green) normalized against Glut1 were quantified. Scale bar, 50 μm. *, P=0.024. d, The cerebral blood flow (CBF) in the cerebral arterioles of iE4/Cre mice at 6-7 months of age was measured. **, P<0.0001. e, The frequency and amplitude of arteriolar oscillation in iE4/Cre mice were measured. The data points represent the measurements for frequency (*, P=0.042) or amplitude (*, P=0.045) of arteriolar oscillation in each vessel from 5 mice/genotype. f, The vessel branch densities in the cerebral arterioles of iE4/Cre mice were examined. **, P<0.0001. Scale bar, 50 μm. g, Brain sections from iE4/Cre mice (Cre, n=10; Cre+, n=10) at 12-13 months of age were immunostained with a GFAP antibody and quantified. **, P=0.005. Scale bar, 50 μm. h, Brain tissues from iE4/Cre mice (Cre, n=8; Cre+, n=8) were subjected to RNA Sequencing. Top gene ontology and canonical pathways enriched for differential expression signals between Cre and Cre+ mice were identified by GSEA. Minus sign for down-regulation; Positive sign for up-regulation. i, Collagen IV-positive (Red) basement membrane and lectin-positive endothelium (Green) in the cortex of iE4/Cre mice (Cre, n=3; Cre+, n=4). Scale bar, 50 μm. j, Collagen IV levels in iE4/Cre mice (Cre, n=11; Cre+, n=12) examined by ELISA. *, P=0.045. Data represent mean ± s.e.m. N.S., not significant, two-tailed Student's t-test.
Fig. 3 ∣
Fig. 3 ∣. Vascular enriched scRNA-Seq reveals reduced astrocytic endfeet and increased immune responses associated with liver-specific expression of apoE4.
Brain cortical tissues from iE3/Cre and iE4/Cre mice (n=4/genotype) at 12-13 months of age were subjected to vascular and glial cell-enriched single cell RNA-Sequencing (scRNA-Seq). a, Diagram showing an overview of the scRNA-seq experiment. b, The t-SNE plot showing the clusters of single cell events captured in scRNA-seq. c, Volcano plot depicting up- and down-regulated genes in astrocytic cell populations (AC1, AC2, AC3) in iE4/Cre+ mice compared to iE4/Cre control mice. Genes significant at the P value ≤ 0.05 and fold change ≥ 1.2 are denoted red in color. d, Heatmap revealing the scaled expression of differentially expressed genes in astrocytes from iE3/Cre and iE4/Cre mice. e, Brain sections from iE4/Cre or iE4/Cre+ mice (Cre, n=11; Cre+, n=11) at 12-13 months of age were immunostained with anti-AQP4 (green) and anti-GFAP (red) antibodies. The AQP4 immunoreactivity with or without normalization to GFAP signal was quantified. Scale bar, 100 μm. Data represent mean ± s.e.m. AQP4: *, P = 0.036; AQP4/GFAP: *, P = 0.038, two-tailed Student's t-test. f, g, Violin plots showing the mean and variance differences between iE4/Cre and iE4/Cre+ astrocytes for genes regulating astrocyte endfeet (Aqp4 and Mlc1), innate immune response (H2-K1, Cxcl14 and Psmc6), and hypoxia/stress responses (Hsbp1).
Fig. 4 ∣
Fig. 4 ∣. Transcriptional signatures in brain endothelial cells associated with liver-specific expression of apoE4.
a, Volcano plots illustrating up- or down-regulated genes in the endothelial cell populations (EC1, EC2, EC3/FB, EC4/FB) from iE4/Cre mice (Cre+ vs. Cre). Genes significant at the P value ≤ 0.05 and fold change ≥ 1.2 are denoted red in color. b, Gene ontology analyses for up- or down-regulated genes in the endothelial cell populations of the iE4/Cre mice c, d, Violin plots showing the mean and variance difference between iE4/Cre and iE4/Cre+ endothelial cells for genes regulating inflammatory response (Cxcl12 and Gkn3), cell proliferation (Pdgfrα), lactate homeostasis (Glu1), mitochondrial function (Ndufs5 and Ndufaf8), matrix assembly (Vim), oxidative stress (Prnp), regulators of MMP family (Timp3), and hypoxia/stress response (Sod1, Hspa1a, Hspa1b, and Hsp90aa1). e, Brain sections from iE4/Cre or iE4/Cre+ mice (Cre, n=11; Cre+, n=14) at 12-13 months of age were subjected to co-immunostaining for Cxcl12 (red) and Glut1 (green), and the Cxcl12/Glut1 signals were quantified. *, P = 0.036, two-tailed Student's t-test. Scale bar, 50 μm. f, Brain sections from the iE4/Cre or iE4/Cre+ mice (Cre, n=10; Cre+, n=10) at 12-13 months of age were subjected to RNAScope assay for Gkn3 (blue) and co-immunostaining for Glut1 (green). The Gkn3/Glut1 signal was quantified. *, P = 0.039. Scale bar, 50 μm. g, Brain sections from iE4/Cre or iE4/Cre+ mice (Cre, n=9; Cre+, n=10) at 12-13 months of age were subjected to RNAScope analysis for Vwf (red) and co-immunostaining for Glut1 (blue). The Vwf/Glut1 signal was quantified. *, P = 0.024. Scale bar, 50 μm. Data represent mean ± s.e.m.
Fig. 5 ∣
Fig. 5 ∣. ApoE isoform-specific changes in plasma protein network and the association with vascular related pathway.
Plasma from iE3/Cre (a-f) mice (Cre, n=4; Cre+, n=4), and iE4/Cre (g-m) mice (Cre, n=4; Cre+, n=4) were subjected to proteomics analysis. The protein modules (MEs) associated with APOE3 or APOE4 genotype were identified by WGCNA analysis. a, g, Module-genotype correlation. Numbers in the table indicate the correlations of the corresponding module eigengenes and genotype, with the P values shown in parentheses. The red color represents positive correlation and blue represents negative correlation to APOE genotype. b, h, Modules that are significantly correlated with APOE3 (b) or APOE4 (h) genotype. The box in the plots displays 25th and 75th percentile values. The center line represents the median and the whiskers show minimum and maximum values. c, i, Network plots of the proteins with high intramodular connectivity in the brown and magenta modules in the iE3/Cre group (c) and red and tan modules in the iE4/Cre group (i). d, j, Pathway analysis using gene ontology (GO) showing the pathways enriched in the protein-sets of the brown and magenta modules in the iE3/Cre group (d), as well as red and tan modules in the iE4/Cre group (j). Limma’s moderate t-test statistics were used. e, Circos plot showing the associated genes and pathways in the endothelial cell clusters negatively correlated with the changes of plasma Timp3 in the iE3/Cre group. f, Timp3-regulated pathways in the endothelial cell clusters of the iE3/Cre group. k, Circos plot showing the associated genes and pathways in the endothelial cell clusters negatively correlated with the changes of plasma Agt in the iE4/Cre group. l, Agt-regulated pathways in the endothelial cell clusters of the iE4/Cre group. Limma’s moderate t-test statistics were used. m, Circos plot showing the associated proteins and pathways in the plasma correlated with the changes of Cxcl12 in endothelial cell clusters in the iE4/Cre group.
Fig. 6 ∣
Fig. 6 ∣. Differential effects of apoE3 and apoE4 young plasma on cerebrovascular integrity and cognitive function in aged mice.
a, Schematic illustration of the experimental procedures for young plasma treatment. b, Memory performance of mice treated with Ctrl, or young plasma from apoE3-TR or apoE4-TR mice examined by fear conditioning contextual test (Ctrl: n=21; E3: n=23; E4: n=22), and cued test (Ctrl: n=21; E3: n=22; E4: n=22). The percentage of time spent showing freezing behavior in response to stimulus in contextual or cued test is shown. *, P=0.046, Wilcoxon rank sum test. c-e, Two-photon imaging was used to assess BBB integrity in 28-month-old mice (n=3/group) treated with Ctrl, apoE3 or apoE4 young plasma. Mice were intravenously injected with Texas Red conjugated dextran (40 kDa), and the BBB permeability was examined. Scale bar, 100 μm. d, The fractions of BBB leakage over time are shown. e, The fractions of BBB leakage at 3 or 18 min after injection of dextran were quantified. *, P = 0.01; **, P = 0.0006. f, g, Vessel-associated astrocytes or microglia in the cortex were examined by double labeling with anti-GFAP (astrocyte) or anti-Iba1 (for microglia) together with endothelial marker Glut1 antibody (for visualizing vasculature). Representative images of cortex from experimental mice are shown. Scale bar, 50 μm. Data from individual animals are shown. g, Fluorescence intensity for GFAP signals surrounding vasculature in the cortex (Ctrl vs. E3: **, P = 0.0009; E3 vs. E4: **, P<0.0001) or hippocampus (Ctrl vs. E3: *, P=0.04; E3 vs. E4: *, P=0.039) of mice (Ctrl: n=10; E3: n=13; E4: n=11) was quantified. h, Fluorescence intensity for Iba1 signals surrounding vasculature in the cortex (*, P=0.045) or hippocampus (*, P=0.017) of mice (Ctrl: n=10; E3: n=13; E4: n=11) was quantified. i, j, Brain sections from young plasma-treated mice (10 mice/group) were immunostained with anti-AQP4 (green) and anti-GFAP (red) antibodies. The AQP4 immunoreactivity (**, P=0.008) and AQP4/GFAP signals (Ctrl vs. E3: **, P=0.002; E3 vs. E4: **, P=0.0002) was quantified. Scale bar, 50 μm. Data represent mean ± s.e.m. One-way ANOVA with a Tukey’s post-hoc test.
Fig. 7 ∣
Fig. 7 ∣. ApoE isoform-specific effects of young plasma on human endothelial barrier integrity and transcriptomic signature.
a, Schematic diagram of human brain endothelial cell (iBMEC) differentiation from iPSCs and the experimental design. b, Characterization of brain endothelial cell differentiation at different time points. Similar results were observed in at least three independent experiments. The iPSC pluripotency and mesoderm lineage differentiation were confirmed by Nanog, Brachyury (a primitive streak marker), or PAX2/5/8 (an intermediate mesoderm marker) staining, respectively. The iPSC-derived iBMECs were stained for Glut1 (an endothelial marker) and ZO1 (a tight junction protein) at Day 12. Scale bars: 100 μm. c, The transendothelial electrical resistance (TEER) in iBMECs and human umbilical vein endothelial cells (HUVECs) was measured. **, P < 0.0001. d, The transwell setup in which the iBMECs were treated with control or young plasma, followed by the assessment of the endothelial cell integrity. e, Human iBMECs cultured in the transwell system were treated with PBS-citrate (control), apoE3 young plasma (2%) or apoE4 young plasma (2%) for 24 hr. The TEER values were measured and compared to the control. Data represent mean ± s.e.m. from three independent experiments. **, P=0.002; *, P=0.034; N.S., not significant. One-way ANOVA with a Tukey’s post-hoc test. f, Modules significantly correlated with apoE3 or apoE4 plasma treatment compared to control identified from RNA-Seq. The box in the plots displays 25th and 75th percentile values. The center line represents the median and the whiskers show minimum and maximum values. g, Network plots of the proteins with high intramodular connectivity in the turquoise module of apoE3 group, and in the green module of apoE4 group. h, Pathway analysis using gene ontology showing the pathways enriched in the gene-sets of the turquoise module and green module. i, The human iBMECs were treated with apoE3 or apoE4 young plasma, or apoE4 plasma together with Timp3 (0.5 μg/ml) for 24 hr, and the TEER values were measured. Data represent mean ± s.e.m. from three independent experiments. **, P=0.003; *, P=0.012; N.S., not significant. One-way ANOVA with a Tukey’s post-hoc test was used to determine the significance between groups.
Fig. 8 ∣
Fig. 8 ∣. Opposing effects of liver-expressed of apoE3 and apoE4 on Aβ plaque deposition and associated neuroinflammation.
a, b, Brain sections from 9-month-old APP/iE3/Alb-Cre mice (Cre, n=23; Cre+, n=24) and APP/iE4/Alb-Cre mice (Cre, n=19; Cre+, n=16) were immunostained with a pan-Aβ antibody. Representative images of Aβ staining are shown, and the plaque burden in the cortex was quantified. Scale bar, 1 mm. Black circles are males; grey circles are females. Data represent mean ± s.e.m. E3: **, P=0.005; E4: **, P=0.002, two-tailed Student's t-test. c, Insoluble Aβ40 and Aβ42 levels in the cortex of 9-month-old APP/iE3/Alb-Cre mice (Cre, n=18; Cre+, n=19) and APP/iE4/Alb-Cre mice (Cre, n=22; Cre+, n=25) were examined by specific Aβ ELISA. E3: Aβ40 (*, P=0.03); Aβ42 (**, P=0.005). E4: Aβ40 (**, P=0.0004); Aβ42 (**, P<0.0001), two-tailed Student's t-test. d, The levels of APP, postsynaptic marker PSD-95, and GFAP in the cortex of APP/iE3/Alb-Cre mice (Cre, n=14; Cre+, n=14) and APP/iE4/Alb-Cre mice (Cre, n=15; Cre+, n=16) at 9 months of age were examined by Western blotting and quantified. E3: PSD-95 (*, P=0.026); GFAP (*, P=0.04). E4: PSD-95 (*, P=0.037); GFAP (*, P=0.037). e, f, Brain sections from APP/iE3/Alb-Cre mice (Cre, n=19; Cre+, n=21) and APP/iE4/Alb-Cre mice (Cre, n=17; Cre+, n=18) at 9 months of age were immunostained with GFAP antibody and quantified. Scale bar, 100 μm. Data represent mean ± s.e.m. E3: Cortex (**, P=0.008); Hippo (*, P=0.005). E4: Cortex (*, P=0.046). N.S., not significant, two-tailed Student's t-test.

Comment in

References

    1. Guo T, et al. Molecular and cellular mechanisms underlying the pathogenesis of Alzheimer's disease. Molecular neurodegeneration 15, 40 (2020). - PMC - PubMed
    1. de la Torre JC Alzheimer disease as a vascular disorder: nosological evidence. Stroke 33, 1152–1162 (2002). - PubMed
    1. Whitmer RA, Karter AJ, Yaffe K, Quesenberry CP Jr. & Selby JV Hypoglycemic episodes and risk of dementia in older patients with type 2 diabetes mellitus. JAMA 301, 1565–1572 (2009). - PMC - PubMed
    1. Zlokovic BV Neurovascular pathways to neurodegeneration in Alzheimer's disease and other disorders. Nature reviews. Neuroscience 12, 723–738 (2011). - PMC - PubMed
    1. Di Marco LY, Farkas E, Martin C, Venneri A & Frangi AF Is Vasomotion in Cerebral Arteries Impaired in Alzheimer's Disease? J Alzheimers Dis 46, 35–53 (2015). - PMC - PubMed

Publication types