

The histone deacetylase SIRT6 promotes glycolysis through the HIF-1α/HK2 signaling axis and induces erlotinib resistance in non-small cell lung cancer
- PMID: 35915188
- PMCID: PMC9617843
- DOI: 10.1007/s10495-022-01751-y
The histone deacetylase SIRT6 promotes glycolysis through the HIF-1α/HK2 signaling axis and induces erlotinib resistance in non-small cell lung cancer
Abstract
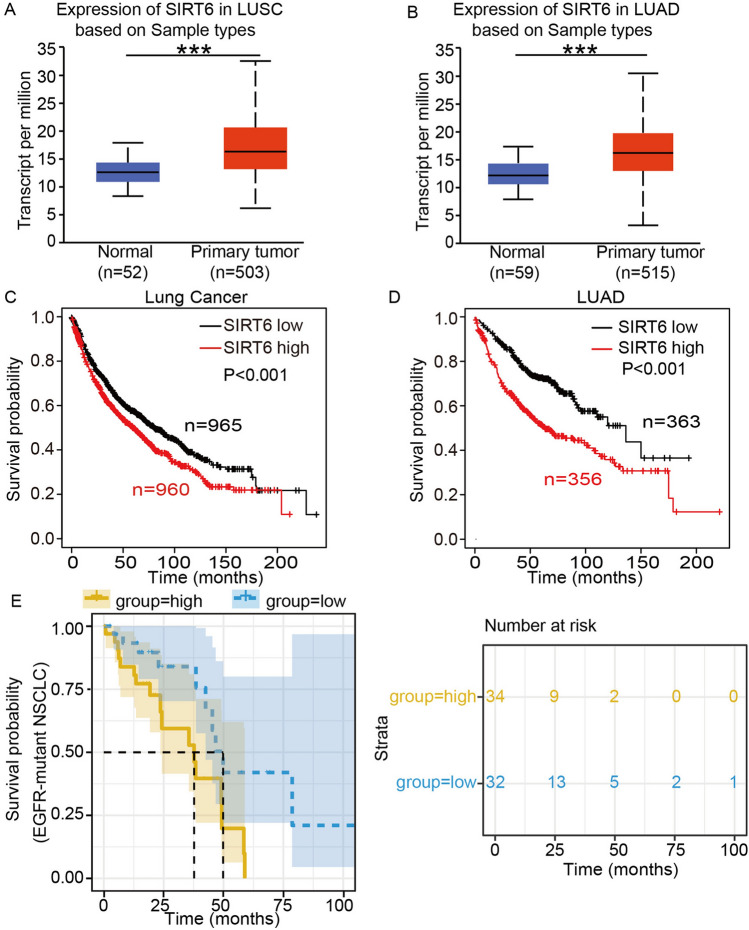
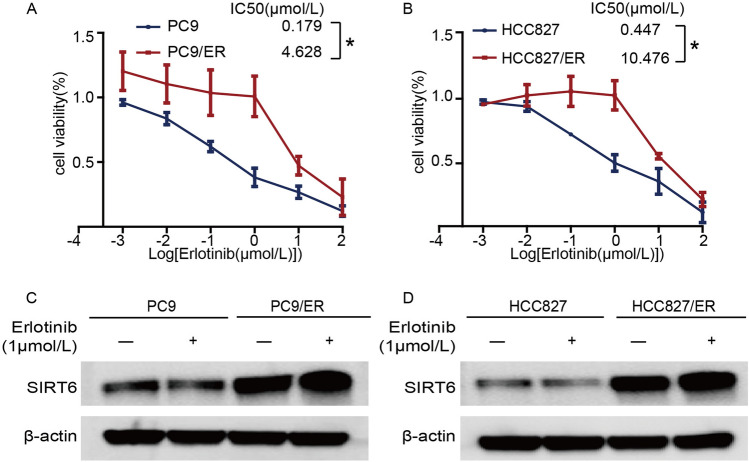
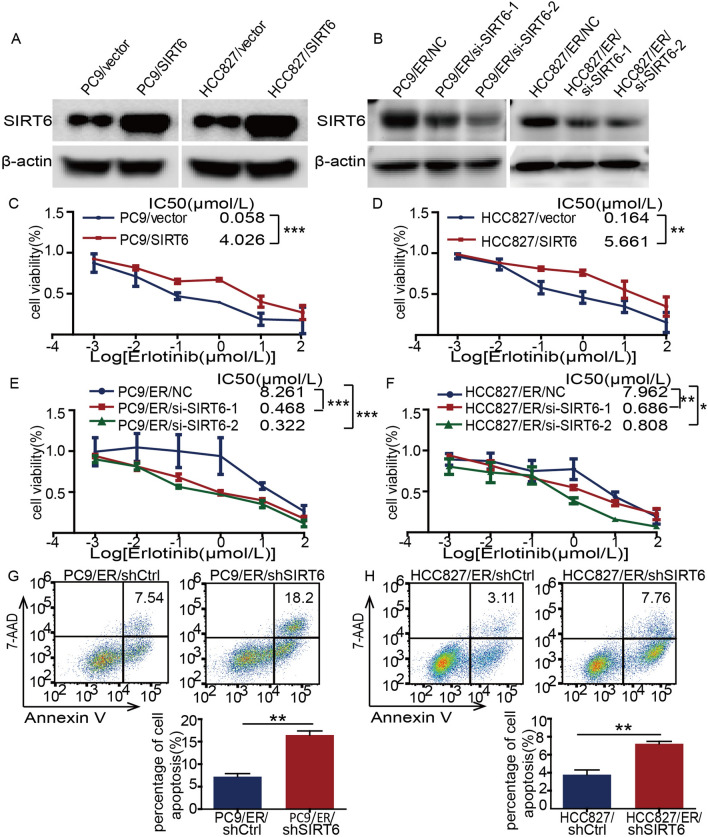
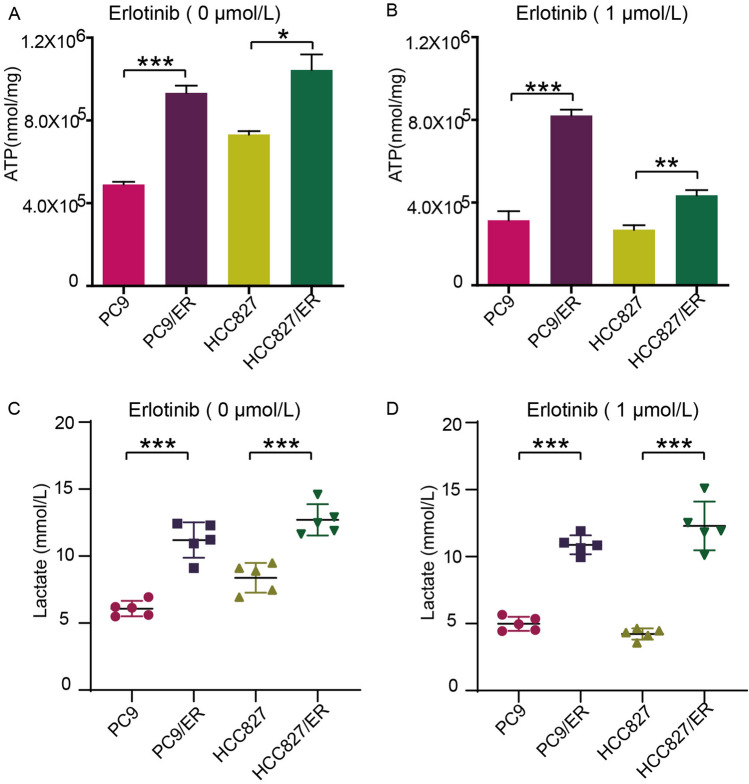
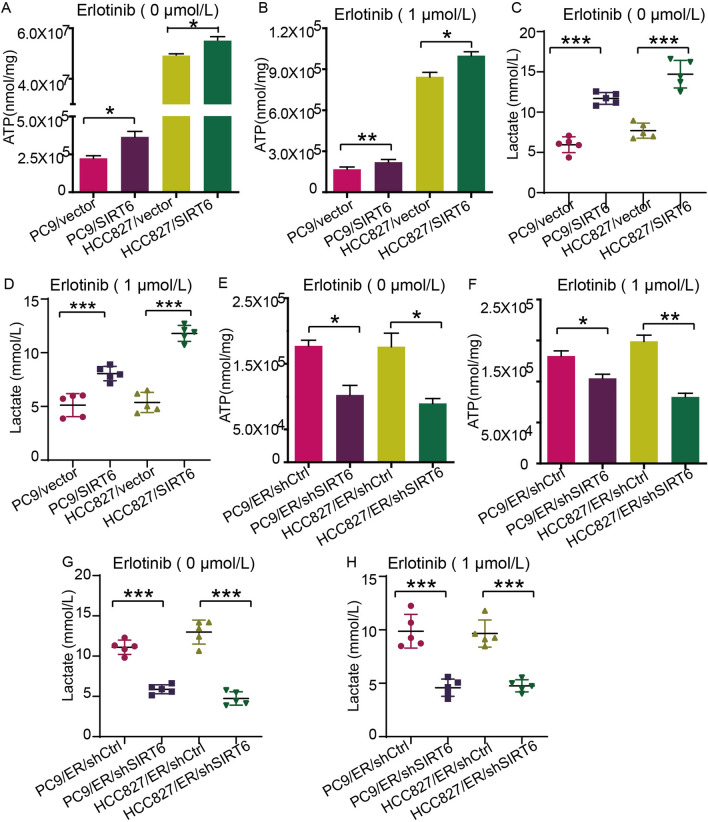
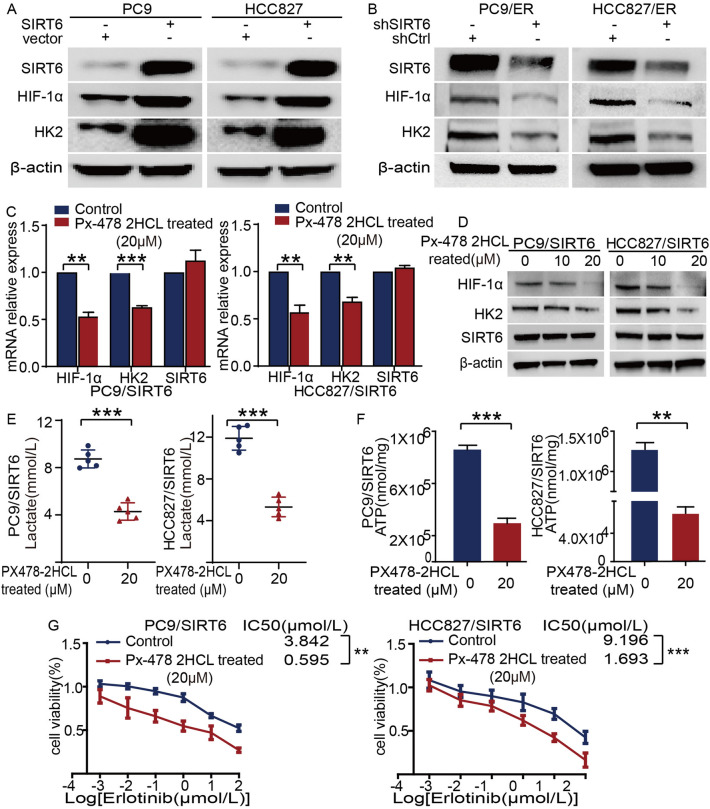
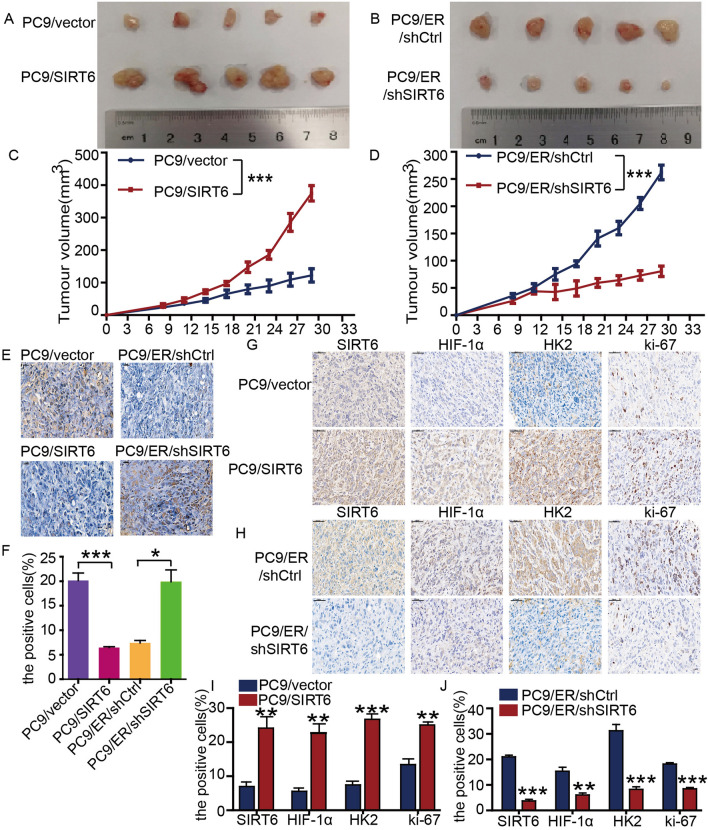
Erlotinib is a first-generation epidermal growth factor receptor tyrosine kinase inhibitor (EGFR-TKI). Overcoming erlotinib resistance is crucial to improve the survival of advanced non-small cell lung cancer (NSCLC) patients with sensitive EGFR mutations. It is also an important clinical problem that urgently needs a solution. In this study, we explored strategies to overcome erlotinib resistance from the perspective of energy metabolism. SIRT6 is a histone deacetylase. Here, we found that high expression of SIRT6 is associated with poor prognosis of lung adenocarcinoma, especially in EGFR-mutated NSCLC patients. The next cell experiment found that SIRT6 expression increased in erlotinib-resistant cells, and SIRT6 expression was negatively correlated with the sensitivity of NSCLC to erlotinib. Inhibition of SIRT6 promoted erlotinib-induced apoptosis in erlotinib-resistant cells, and glycolysis in drug-resistant cells was also inhibited. Functional studies have shown that SIRT6 increases glycolysis through the HIF-1α/HK2 signaling axis in drug-resistant cells and inhibits the sensitivity of NSCLC cells to erlotinib. In addition, the HIF-1α blocker PX478-2HCL attenuated the glycolysis and erlotinib resistance induced by SIRT6. More importantly, we confirmed the antitumor effect of SIRT6 inhibition combined with erlotinib in NSCLC-bearing mice. Our findings indicate that the cancer metabolic pathway regulated by SIRT6 may be a new target for attenuating NSCLC erlotinib resistance and has potential as a biomarker or therapeutic target to improve outcomes in NSCLC patients.
Keywords: EGFR-TKI; Erlotinib; Glycolysis; NSCLC; SIRT6.
© 2022. The Author(s).
Conflict of interest statement
All authors declare no conflict of interest.
Figures
Similar articles
-
Inhibition of histone deacetylases sensitizes EGF receptor-TK inhibitor-resistant non-small-cell lung cancer cells to erlotinib in vitro and in vivo.Br J Pharmacol. 2017 Oct;174(20):3608-3622. doi: 10.1111/bph.13961. Epub 2017 Aug 24. Br J Pharmacol. 2017. PMID: 28749535 Free PMC article.
-
Chloroquine in combination with aptamer-modified nanocomplexes for tumor vessel normalization and efficient erlotinib/Survivin shRNA co-delivery to overcome drug resistance in EGFR-mutated non-small cell lung cancer.Acta Biomater. 2018 Aug;76:257-274. doi: 10.1016/j.actbio.2018.06.034. Epub 2018 Jun 28. Acta Biomater. 2018. PMID: 29960010
-
JAK2 inhibitor TG101348 overcomes erlotinib-resistance in non-small cell lung carcinoma cells with mutated EGF receptor.Oncotarget. 2015 Jun 10;6(16):14329-43. doi: 10.18632/oncotarget.3685. Oncotarget. 2015. PMID: 25869210 Free PMC article.
-
Treatment of Brain Metastases of Non-Small Cell Lung Carcinoma.Int J Mol Sci. 2021 Jan 8;22(2):593. doi: 10.3390/ijms22020593. Int J Mol Sci. 2021. PMID: 33435596 Free PMC article. Review.
-
Natural Product-Based Glycolysis Inhibitors as a Therapeutic Strategy for Epidermal Growth Factor Receptor-Tyrosine Kinase Inhibitor-Resistant Non-Small Cell Lung Cancer.Int J Mol Sci. 2024 Jan 9;25(2):807. doi: 10.3390/ijms25020807. Int J Mol Sci. 2024. PMID: 38255882 Free PMC article. Review.
Cited by
-
CCT6A facilitates lung adenocarcinoma progression and glycolysis via STAT1/HK2 axis.J Transl Med. 2024 May 15;22(1):460. doi: 10.1186/s12967-024-05284-7. J Transl Med. 2024. PMID: 38750462 Free PMC article.
-
Targeting sirtuins for cancer therapy: epigenetics modifications and beyond.Theranostics. 2024 Oct 14;14(17):6726-6767. doi: 10.7150/thno.100667. eCollection 2024. Theranostics. 2024. PMID: 39479446 Free PMC article. Review.
-
DNMBP-AS1/hsa-miR-30a-5p/PGC1α axis suppresses tumor progression of colorectal cancer by inhibiting PKM2-mediated Warburg effect and enhance anti-PD-1 therapy efficacy.Cell Death Discov. 2025 Jul 2;11(1):299. doi: 10.1038/s41420-025-02561-2. Cell Death Discov. 2025. PMID: 40603870 Free PMC article.
-
Sirtuin family in lung adenocarcinoma.Discov Oncol. 2025 Jul 23;16(1):1398. doi: 10.1007/s12672-025-03217-4. Discov Oncol. 2025. PMID: 40702355 Free PMC article. Review.
-
Friend or foe? The role of SIRT6 on macrophage polarized to M2 subtype in acute kidney injury to chronic kidney disease.Ren Fail. 2025 Dec;47(1):2482121. doi: 10.1080/0886022X.2025.2482121. Epub 2025 Apr 22. Ren Fail. 2025. PMID: 40260529 Free PMC article. Review.
References
-
- Siegel RL, Miller KD, Fuchs HE. Cancer statistics, 2021. CA Cancer J Clin. 2021;71:7–33. - PubMed
-
- Herbst RS, Morgensztern D, Boshoff C. The biology and management of non-small cell lung cancer. Nature. 2018;553:446–454. - PubMed
-
- Greenhalgh J, Dwan K, Boland A, et al. First-line treatment of advanced epidermal growth factor receptor (EGFR) mutation positive non-squamous non-small cell lung cancer. Cochrane Database Syst Rev. 2016;3:CD010383. - PubMed
-
- Yue D, Xu S, Wang Q, et al. Erlotinib versus vinorelbine plus cisplatin as adjuvant therapy in Chinese patients with stage IIIA EGFR mutation-positive non-small-cell lung cancer (EVAN): a randomised, open-label, phase 2 trial. Lancet Respir Med. 2018;6:863–873. - PubMed
-
- Lu X, Yu L, Zhang Z, et al. Targeting EGFR(L858R/T790M) and EGFR(L858R/T790M/C797S) resistance mutations in NSCLC: Current developments in medicinal chemistry. Med Res Rev. 2018;38:1550–1581. - PubMed
Publication types
MeSH terms
Substances
LinkOut - more resources
Full Text Sources
Medical
Research Materials
Miscellaneous
