. 2022 Aug 1;12(1):13160.
doi: 10.1038/s41598-022-16965-y.

The E3 ubiquitin ligase HECTD1 contributes to cell proliferation through an effect on mitosis

Affiliations

The E3 ubiquitin ligase HECTD1 contributes to cell proliferation through an effect on mitosis

Natalie Vaughan et al. Sci Rep. .

Abstract

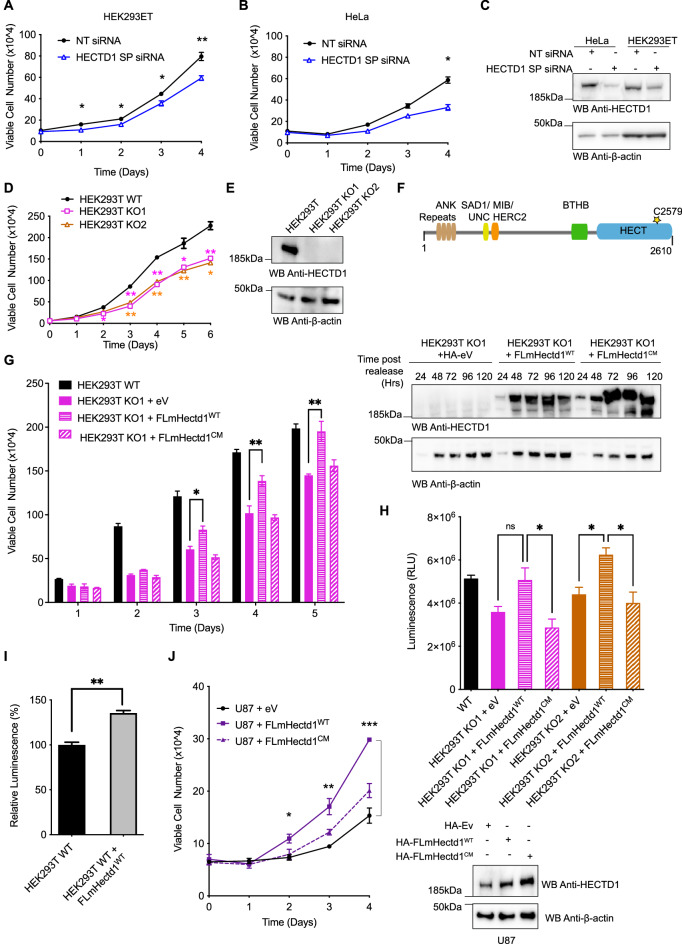
The cell cycle is tightly regulated by protein phosphorylation and ubiquitylation events. During mitosis, the multi-subunit cullin-RING E3 ubiquitin ligase APC/c functions as a molecular switch which signals for one cell to divide into two daughter cells, through the ubiquitylation and proteasomal degradation of mitotic cyclins. The contributions of other E3 ligase families during cell cycle progression remain less well understood. Similarly, the roles of ubiquitin chain types beyond homotypic K48 chains in S-phase or branched K11/K48 chains during mitosis, also remain to be fully determined. Our recent findings that HECTD1 ubiquitin ligase activity assembles branched K29/K48 ubiquitin linkages prompted us to evaluate HECTD1 function during the cell cycle. We used transient knockdown and genetic knockout to show that HECTD1 depletion in HEK293T and HeLa cells decreases cell number and we established that this is mediated through loss of ubiquitin ligase activity. Interestingly, we found that HECTD1 depletion increases the proportion of cells with aligned chromosomes (Prometa/Metaphase) and we confirmed this molecularly using phospho-Histone H3 (Ser28) as a marker of mitosis. Time-lapse microscopy of NEBD to anaphase onset established that HECTD1-depleted cells take on average longer to go through mitosis. In line with this data, HECTD1 depletion reduced the activity of the Spindle Assembly Checkpoint, and BUB3, a component of the Mitosis Checkpoint Complex, was identified as novel HECTD1 interactor. BUB3, BUBR1 or MAD2 protein levels remained unchanged in HECTD1-depleted cells. Overall, this study reveals a novel putative role for HECTD1 during mitosis and warrants further work to elucidate the mechanisms involved.


Conflict of interest statement

The authors declare no competing interests.

Figures

Figure 1
Figure 1
HECTD1 depletion reduces cell proliferation. (A, B) The Effect of transient siRNA knock down of HECTD1 on cell number was determined using trypan blue exclusion in HEK293ET (A) and HeLa (B). Data was plotted as mean with error bars that represent ± S.E.M., over three independent experiments (n = 3) defined as three separate transfections, **p < 0.01, *p < 0.05 by paired student’s t-test. (C) Immunoblot analysis showing HECTD1 transient knock down using 20 pmol SMARTpool (SP) siRNA in HEK293ET and HeLa following 72 h incubation. HEK293ET and Hela cells were transfected with lipofectamine 2000 or RNAiMAX, respectively. Cells harvested at the indicated timepoint, lysed in RIPA buffer, and lysates were analysed on a 4–12% SDS PAGE followed by western blot analysis using anti-HECTD1, and anti-β-actin antibody as loading control. (D) Cell number was also quantified in HEK293T cells and two independent HECTD1 KO cell lines, KO1 and KO2. Data was plotted as mean with error bars that represent ± S.E.M., over three independent experiments (n = 3) defined as three separate transfections, **p < 0.01, *p < 0.05 by paired student’s t-test. (E) Immunoblot analysis showing the absence of HECTD1 in HECTD1 KO1 and KO2 cell lysates. (F) Domain organisation of mouse Hectd1 highlighting HECTD1 catalytic cysteine C2579. (G) Rescue assay showing that re-expression in HEK293T KO1 of HA-FL-mHectd1 wild-type (WT), but not catalytic mutant C2579G or an empty vector control, yields a similar number of cells compared to HEK293T WT cells. Data was plotted as mean with error bars that represent ± S.E.M., over three independent experiments (n = 3) defined as three separate transfections, **p < 0.01, *p < 0.05 by a one-way ANOVA with Dunnett’s post-test. Right panel shows expression levels of HA-tagged constructs. (H) A similar trend was also observed using the Cell-Titer-Glo Luminescence cell viability assay. The indicated samples were harvested at 48 h post-transfection prior to analysis. Data plotted as mean with error bars that represent ± S.E.M., over three independent experiments (n = 3) defined as three separate transfections, *p < 0.05 by a one-way ANOVA with Dunnett’s post-test. (I) HEK293T WT cells were transfected with HA-FL-mHectd1WT or an HA-empty vector (ev) using PEI. 48 h post-transfection cells were harvested, and cell proliferation measured (relative luminescence) with CellTiter-Glo. Data is plotted as mean with error bars that represent ± S.E.M, over three independent experiments (n = 3), **p < 0.01 by a paired student’s t-test. (J) Viable cell count (× 104) for U87 cells transfected with 250 ng either HA-empty vector (Ev), HA-FL-mHectd1WT, or HA-FL-mHectd1C2579G(CM) using PEI. Samples were harvested at the indicated times post-transfection and counted using trypan blue to quantify the number of viable cells. Data plotted as mean with error bars that represent ± S.E.M., over three independent experiments (n = 3). ***p < 0.001, **p < 0.01, *p < 0.05 by one-way ANOVA with a Dunnett’s post-test. Right panel shows expression levels of HA-tagged constructs in U87.
Figure 2
Figure 2
Cell cycle analysis of HECTD1-depleted cells. (A) Cell cycle analysis by flow cytometry PI staining in HEK293ET wild-type and HEK293ET cells treated for 48 h with either a non-targeting siRNA (NT siRNA), HECTD1 SMARTpool (SP) siRNA or the individual SMARTpool HECTD1 siRNA #6. (B) Representative images of HEK293T cells stained for EdU, phospho-Histone 3 (Ser28), Hoechst and imaged using an IN Cell Analyzer 2000 high-content microscope. Click-EdU staining was used as a readout for cells in S-phase and quantified relative to the total number of cells for: (C) HEK293T WT, KO1 and KO2, (D) HEK293T siRNA-treated, (E) hTERT-RPE siRNA-treated, or (F) NT-shRNA or HECTD1-shRNA clone 2. Data plotted as mean with error bars that represent ± S.E.M., over three experiments (n = 3 wells for each condition). Data analysed by unpaired t-test with Kruskal–Wallis. (G) Cell cycle analysis by flow cytometry PI staining. HEK293T WT or KO1 cells were synchronised in late G2 with 9 µM RO3306 for 20 h, and then released from block in full media. At each of the indicated timepoints, cells were fixed using 70% ethanol, and stained using 2 µg/ml PI, with 100 µg/ml RNase A, for 30 min at room temperature. Stained samples were then analysed immediately by flow cytometry. Gated population percentages are indicated on each graph. PI-A of 50 is equivalent to 2 N (G1 population), and PI-A of 100 is equivalent to 4 N (G2/M population). Graph showing the percentage of G1 and G2/M populations in HEK293T WT and KO1 cell lines at each time point post RO3306 release. (H) Immunoblot analysis of RIPA lysates from HEK293T wild-type, HECTD1 KO1 and KO2 cell lysates. No PARP cleavage nor or a change in p21Waf1/Cip1 levels was observed in HECTD1-depleted cells. In contrast, an increase in the levels of phospho-H3 (Ser28) was detected in both HECTD1 KO lines. GAPDH was used as loading control. To enable detection of the same samples with different antibodies, membranes were cut prior to hybridization. Uncropped western blot images are included in the “Supplementary data”, with cropped areas highlighted with a red box.
Figure 3
Figure 3
HECTD1 depletion increases phospho-H3 (Ser28) protein levels. (A) Phospho-H3 (Ser28) levels were assessed in HEK293T wild-type and KO1 and 2 cell lysates, and changes were quantified and normalized to β-actin. Representative immunoblots of HEK293T KO cells compared to WT control (n = 2). Signal intensity was quantified using ImageJ, ratios for pH3(Ser28)/β-actin were determined and normalised to data from HEK293T cells which was set at 1. (B) A similar effect on Phospho-H3 (Ser28) levels was also observed following transient transfection with HECTD1 SMARTpool (SP) siRNA for 72 h in HEK293T (representative data from n = 3) and 48 h in hTERT-RPE cells (n = 1). Signal intensity was quantified using ImageJ, ratios for pH3(Ser28)/β-actin or pH3(Ser28)/GAPDH were determined and normalised to data from NT siRNA-treated HEK293ET or RPE, respectively. (C) Quantification of phospho-H3 (Ser28) median signal intensity obtained by high-content microscopy analysis of HEK293T cells treated with siRNA including NT, HECTD1 SMARTpool or HECTD1 siRNA#6. Each condition was set up as two independent wells and data were analysed by One-way Anova. The lower panel shows HECTD1 levels in cells analysed by HCM for this experiment. GAPDH was used as loading control. (D) Immunoblots showing a phospho-H3 (Ser28) ‘tail’ in HECTD1-depleted cells compared to control (representative analysis of 2 independent experiments). Cells were treated with 2 mM Thymidine for 18 h, followed by a 9 h release. A second treatment with 2 mM Thymidine for 15 h was carried out, before releasing cells into full media. Samples were harvested at 0, 3, 6, 8, 10, 12, and 14 h post-release. Samples were collected at the indicated timepoints, lysed with RIPA and analysed by immunoblotting using anti-HECTD1, anti-phospho-H3 (Ser28) and anti-β-actin antibodies. Signal intensity was quantified using ImageJ and ratios for pH3(Ser28)/β-actin were determined (E, F) Immunoblot analysis of cells synchronised using the CDK1 inhibitor RO3306. (E) HEK293T WT or KO1 were synchronised in late G2 using 9 µM RO3306 for 20 h, and then released into full media to enter mitosis. Samples were harvested at the indicated timepoints post release, lysed in RIPA, and probed for HECTD1, phospho-H3 (Ser28) and GAPDH (n = 1). (F) As in (E) but using HEK293T NT-shRNA and HECTD1-shRNA#2 stable cell lines (n = 1). Signal intensity was quantified using ImageJ and ratios for pH3(Ser28)GAPDH were determined. To enable detection of the same samples with different antibodies, membranes were cut prior to hybridization. Uncropped western blot images are included  in the “Supplementary data”, with cropped areas highlighted with a red box.
Figure 4
Figure 4
HECTD1 plays a role during mitotic progression. (A) Confocal images of HEK293T cells at each mitotic stage which were used for scoring (B) and (C). Cells were scored according to chromatin morphology based on Hoechst (blue) and α-tubulin (green) staining. Prometaphase refers to cells with misaligned chromosomes while Metaphase (i.e., Prometaphase/Metaphase) refers to cells with aligned chromosomes at the metaphase plate. (B) HEK293ET cells and (C) HeLa cells were scored according to chromatin morphology or spindle morphology, following 48 h transfection with Non-Targeting (NT) siRNA, HECTD1 SMARTpool (SP) siRNA, SMARTpool individual HECTD1 siRNA #06, or #08. Data plotted as mean with error bars that represent ± S.E.M., over 6 biological repeats (individual transfections). **p < 0.01, ***p < 0.001, and ****p < 0.0001 using a one-way ANOVA with a Dunnett’s post-test. Each HECTD1 siRNA condition was significant when compared to the corresponding NT siRNA control. (D) The duration of NEBD to anaphase onset was timed in asynchronous HEK293T WT and KO1 and KO2 cell lines. Vertical scatter plot showing the time taken for individual cells to progress from NEBD to anaphase onset. Error bars represent ± S.E.M., ***p < 0.001, using a one-way ANOVA with a Dunnett’s post-test. Number of cells filmed are as follows, WT = 116, KO1 = 136, and KO2 = 161, filmed over 4 independent experiments. (E) Vertical scatter plot showing the time taken (min) for each cell to progress from NEBD to anaphase onset in HEK293T KO1 cells transfected for 48 h with either HA-FL-mHectd1WT, or HA-FL-mHectd1C2579G(CM). Lower panel shows expression levels of HA-tagged constructs.
Figure 5
Figure 5
HECTD1 contributes to SAC activation. (A) Experimental setup to test for the effect of HECTD1 depletion on SAC activity. (B) Immunoblot analysis showing HECTD1 levels following 48 h treatment with HECTD1 SMARTpool (SP) siRNA in HEK293ET cells. β-actin was used as loading control. (C, D) Cell cycle analysis by flow cytometry PI staining for HEK293ET treated for 48 h with NT (Top) or HECTD1 SP siRNA (Bottom) prior to addition of DMSO (C) or Nocodazole (50 ng/ml for 18 h) (D), as shown in (A). (E) Immunoprecipitation assay of endogenous HECTD1 in HEK293T cells showing interaction with endogenous BUB3, but not MAD2 or BUBR1. Normal Rabbit IgG was used for control IP. Representative data of duplicate experiments. Note that the same results were obtained whether cells were asynchronous or arrested in mitosis through nocodazole treatment. (F) Immunoblot showing that levels of MCC components BUB3, BUBR1 and MAD2 remains similar in HEK293T WT and HECTD1 KO1 cells. (G) Immunoblot showing HECTD1 levels remain similar during S, G2 and M-phase. HEK293ET cells were synchronised in low serum for 48 h before treatment with 4 μg/ml Aphidicolin for 15 h, prior to release in complete media. Cells were harvested at the indicated time points prior to western blot analysis using anti-HECTD1, anti-Cyclin B1 (Sc-245) and anti-β-actin. Signal intensity was quantified using ImageJ and ratios for HECTD1/β-actin were determined. (H) HECTD1 levels remain similar during mitosis. HEK293T cells were synchronised in late G2 with RO3306 (Lane 2) or released from RO3306 block into mitosis for 10 min (Lane 3) or 30 min (Lane 4). Phospho-H3 (Ser28) was used to show the effective synchronisation using R03306, while β-actin was used as loading control. Sample from synchronous cells is shown in Lane 1. To enable detection of the same samples with different antibodies, membranes were cut prior to hybridization. Uncropped western blot images are included in the “Supplementary data”, with cropped areas highlighted with a red box.
Figure 6
Figure 6
TRABID NZF 1–3 traps ubiquitin chains during cell cycle progression. (A) Domain organisation of TRABID showing the AA1-200 region which contains three Npl14 UBDs. GST alone, GST-tagged TRABID NZF 1–3 and the ubiquitin binding deficient TRABID NZF 1–3 TY to LV were produced in E. coli and used as baits for pull-down experiments. (B) 5 μg of the indicated recombinant proteins were run on a 4–12% SDS PAGE and stained with Coomassie. (C) GST alone or GST-TRABID NZF 1–3 were used as baits in pull-down experiments with cell lysates from asynchronous HEK293T WT cells treated with DMSO or 10 μM MG132 for 6 h prior to cell lysis. Following pull-down with Pierce Glutathione magnetics agarose beads, samples were resolved on 4–12% SDS PAGE, transferred onto PVDF, and probed with anti-Ubiquitin or anti-HECTD1 antibodies. Anti-GST was used as loading control for the baits and β-actin was used as a loading control for lysates. One star (*) indicates GST and (**) corresponds to GST-TRABID NZF 1–3. (D) GST-TRABID NZF 1–3 traps ubiquitin and its interaction with HECTD1 requires functional ubiquitin binding domains. Pull-downs and Input were carried out as in (B) using lysates from HEK293T WT and HEK293T KO1 mutant cells. (E, F) Pull-down assay to determine the ability of GST-TRABID NZF 1–3 to pull down endogenous ubiquitin from synchronised HEK293T WT. (E) Cell cycle analysis by flow cytometry showing Histograms for each cell cycle phase is shown. PI-A of 50 is equivalent to 2 N (G1 population), and PI-A of 100 is equivalent to 4 N (G2/M population). HEK293T WT cells were synchronised using 4 μg/ml Aphidicolin to enrich for G1 phase cells; 2 mM Thymidine with a 2 h release (double thymidine block) to synchronise cells in S phase; 9 μM RO3306 for 20 h to obtain G2; 9 μM RO3306 for 20 h followed by 20 min release to obtain cells in M phase. (F) Immunoblot analysis of pull-downs carried out using lysates from synchronised cell populations and with the indicated GST baits. The membrane for the pull-down experiment was probed for ubiquitin, HECTD1, BUB3, and GST as loading control. Input samples also analysed for the same antibodies as well as Anti-phospho Histone H3 (Ser28) and anti-β-Actin M-phase and loading controls, respectively. * Represents GST, ** GST-TRABID NZF 1–3, and *** reflects uneven loading of the lysate obtained from the S-phase synchronisation. To enable detection of the same samples with different antibodies, membranes were cut prior to hybridization. Uncropped western blot images are included in the “Supplementary data”, with cropped areas highlighted with a red box.

Similar articles

Cited by

References

    1. Glotzer M, Murray AW, Kirschner MW. Cyclin is degraded by the ubiquitin pathway. Nature. 1991;349:132–138. doi: 10.1038/349132a0. - DOI - PubMed
    1. Ciechanover A, Elias S, Heller H, Hershko A. "Covalent affinity" purification of ubiquitin-activating enzyme. J. Biol. Chem. 1982;257:2537–2542. doi: 10.1016/S0021-9258(18)34957-3. - DOI - PubMed
    1. Haas AL, Warms JV, Hershko A, Rose IA. Ubiquitin-activating enzyme. Mechanism and role in protein-ubiquitin conjugation. J. Biol. Chem. 1982;257:2543–2548. doi: 10.1016/S0021-9258(18)34958-5. - DOI - PubMed
    1. Mayer A, Gropper R, Schwartz AL, Ciechanover A. Purification, characterization, and rapid inactivation of thermolabile ubiquitin-activating enzyme from the mammalian cell cycle mutant ts85. J. Biol. Chem. 1989;264:2060–2068. doi: 10.1016/S0021-9258(18)94141-4. - DOI - PubMed
    1. Goebl MG, et al. The yeast cell cycle gene CDC34 encodes a ubiquitin-conjugating enzyme. Science (New York, NY) 1988;241:1331–1335. doi: 10.1126/science.2842867. - DOI - PubMed

Publication types