

Evaluating the efficiency of coarser to finer resolution multispectral satellites in mapping paddy rice fields using GEE implementation
- PMID: 35915211
- PMCID: PMC9343374
- DOI: 10.1038/s41598-022-17454-y
Evaluating the efficiency of coarser to finer resolution multispectral satellites in mapping paddy rice fields using GEE implementation
Abstract
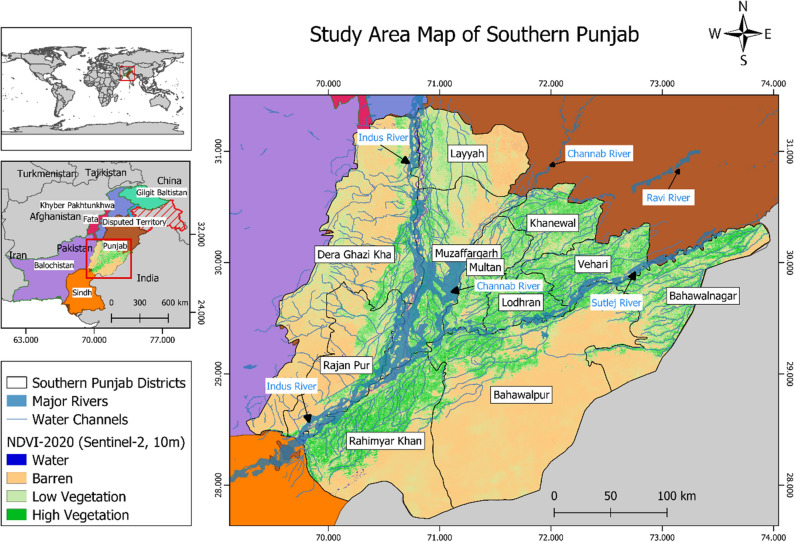
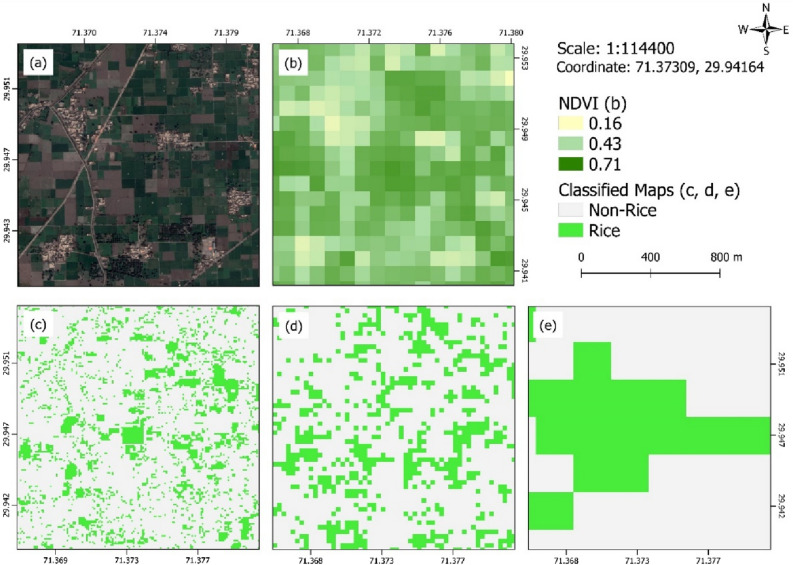
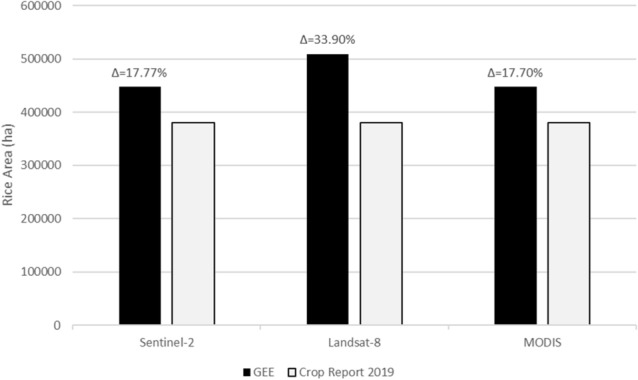
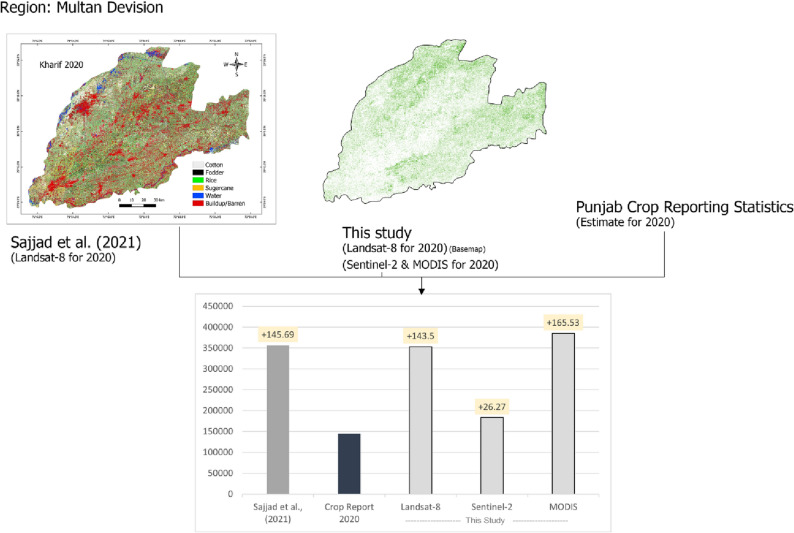
Timely and accurate estimation of rice-growing areas and forecasting of production can provide crucial information for governments, planners, and decision-makers in formulating policies. While there exists studies focusing on paddy rice mapping, only few have compared multi-scale datasets performance in rice classification. Furthermore, rice mapping of large geographical areas with sufficient accuracy for planning purposes has been a challenge in Pakistan, but recent advancements in Google Earth Engine make it possible to analyze spatial and temporal variations within these areas. The study was carried out over southern Punjab (Pakistan)-a region with 380,400 hectares devoted to rice production in year 2020. Previous studies support the individual capabilities of Sentinel-2, Landsat-8, and Moderate Resolution Imaging Spectroradiometer (MODIS) for paddy rice classification. However, to our knowledge, no study has compared the efficiencies of these three datasets in rice crop classification. Thus, this study primarily focuses on comparing these satellites' data by estimating their potential in rice crop classification using accuracy assessment methods and area estimation. The overall accuracies were found to be 96% for Sentinel-2, 91.7% for Landsat-8, and 82.6% for MODIS. The F1-Scores for derived rice class were 83.8%, 75.5%, and 65.5% for Sentinel-2, Landsat-8, and MODIS, respectively. The rice estimated area corresponded relatively well with the crop statistics report provided by the Department of Agriculture, Punjab, with a mean percentage difference of less than 20% for Sentinel-2 and MODIS and 33% for Landsat-8. The outcomes of this study highlight three points; (a) Rice mapping accuracy improves with increase in spatial resolution, (b) Sentinel-2 efficiently differentiated individual farm level paddy fields while Landsat-8 was not able to do so, and lastly (c) Increase in rice cultivated area was observed using satellite images compared to the government provided statistics.
© 2022. The Author(s).
Conflict of interest statement
The authors declare no competing interests.
Figures


References
-
- GOP, G. J. Economic Advisor’s Wing: Islamabad, Pakistan. Pakistan Economic Survey 2017–18. Finance Division (2018).
-
- Luo, T., Young, R. & Reig, P. J. Aqueduct Projected Water Stress Country Rankings. Technical Note (2015).
-
- Nizami A, Zulfiqar M, Ali J, Khan N, Sheikh I. Improving water productivity in rice—A response to climate change and water stress in Pakistan. Sarhad J. Agric. 2020 doi: 10.17582/journal.sja/2020/36.2.383.388. - DOI
-
- Sporchia F, Thomsen M, Caro DJ. Drivers and trade-offs of multiple environmental stressors from global rice. Sustain. Prod. Consum. 2020;26:16–32. doi: 10.1016/j.spc.2020.09.009. - DOI
Publication types
MeSH terms
LinkOut - more resources
Full Text Sources
