

Identifying genetic markers enriched by brain imaging endophenotypes in Alzheimer's disease
- PMID: 35915443
- PMCID: PMC9344647
- DOI: 10.1186/s12920-022-01323-8
Identifying genetic markers enriched by brain imaging endophenotypes in Alzheimer's disease
Abstract
Background: Alzheimer's disease (AD) is a complex neurodegenerative disorder and the most common type of dementia. AD is characterized by a decline of cognitive function and brain atrophy, and is highly heritable with estimated heritability ranging from 60 to 80[Formula: see text]. The most straightforward and widely used strategy to identify AD genetic basis is to perform genome-wide association study (GWAS) of the case-control diagnostic status. These GWAS studies have identified over 50 AD related susceptibility loci. Recently, imaging genetics has emerged as a new field where brain imaging measures are studied as quantitative traits to detect genetic factors. Given that many imaging genetics studies did not involve the diagnostic outcome in the analysis, the identified imaging or genetic markers may not be related or specific to the disease outcome.
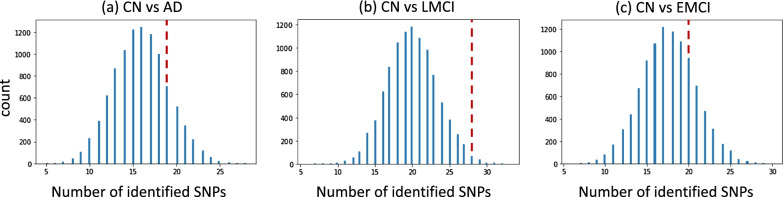
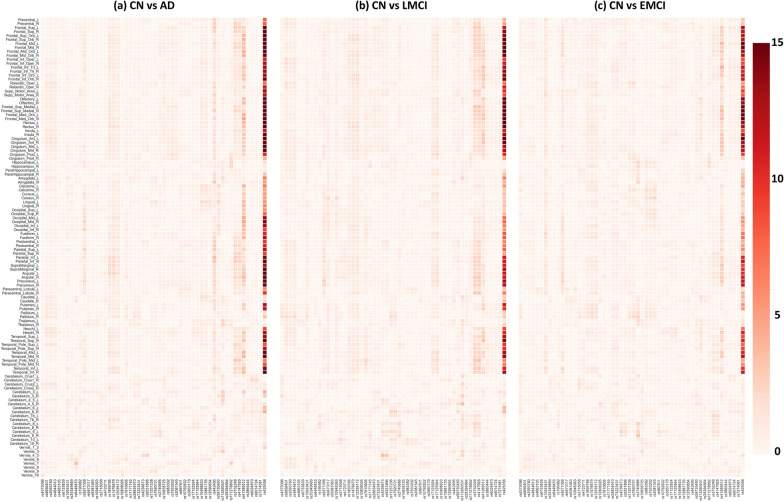
Results: We propose a novel method to identify disease-related genetic variants enriched by imaging endophenotypes, which are the imaging traits associated with both genetic factors and disease status. Our analysis consists of three steps: (1) map the effects of a genetic variant (e.g., single nucleotide polymorphism or SNP) onto imaging traits across the brain using a linear regression model, (2) map the effects of a diagnosis phenotype onto imaging traits across the brain using a linear regression model, and (3) detect SNP-diagnosis association via correlating the SNP effects with the diagnostic effects on the brain-wide imaging traits. We demonstrate the promise of our approach by applying it to the Alzheimer's Disease Neuroimaging Initiative database. Among 54 AD related susceptibility loci reported in prior large-scale AD GWAS, our approach identifies 41 of those from a much smaller study cohort while the standard association approaches identify only two of those. Clearly, the proposed imaging endophenotype enriched approach can reveal promising AD genetic variants undetectable using the traditional method.
Conclusion: We have proposed a novel method to identify AD genetic variants enriched by brain-wide imaging endophenotypes. This approach can not only boost detection power, but also reveal interesting biological pathways from genetic determinants to intermediate brain traits and to phenotypic AD outcomes.
Keywords: Brain imaging genetics; Genome-wide association study; Imaging-diagnosis map; Imaging-genetics map.
© 2022. The Author(s).
Conflict of interest statement
The authors declare that they have no competing interests.
Figures

Similar articles
-
Identifying Alzheimer's genes via brain transcriptome mapping.BMC Med Genomics. 2022 May 19;15(Suppl 2):116. doi: 10.1186/s12920-022-01260-6. BMC Med Genomics. 2022. PMID: 35590321 Free PMC article.
-
Identification of Novel Genes Associated with Cortical Thickness in Alzheimer's Disease: Systems Biology Approach to Neuroimaging Endophenotype.J Alzheimers Dis. 2020;75(2):531-545. doi: 10.3233/JAD-191175. J Alzheimers Dis. 2020. PMID: 32310165
-
Genome-wide association study identifies four novel loci associated with Alzheimer's endophenotypes and disease modifiers.Acta Neuropathol. 2017 May;133(5):839-856. doi: 10.1007/s00401-017-1685-y. Epub 2017 Feb 28. Acta Neuropathol. 2017. PMID: 28247064 Free PMC article.
-
Strategies for multivariate analyses of imaging genetics study in Alzheimer's disease.Neurosci Lett. 2021 Sep 25;762:136147. doi: 10.1016/j.neulet.2021.136147. Epub 2021 Jul 29. Neurosci Lett. 2021. PMID: 34332030 Review.
-
Alcohol Dependence Genetics: Lessons Learned From Genome-Wide Association Studies (GWAS) and Post-GWAS Analyses.Alcohol Clin Exp Res. 2015 Aug;39(8):1312-27. doi: 10.1111/acer.12792. Epub 2015 Jun 25. Alcohol Clin Exp Res. 2015. PMID: 26110981 Free PMC article. Review.
Cited by
-
KAT8 beyond Acetylation: A Survey of Its Epigenetic Regulation, Genetic Variability, and Implications for Human Health.Genes (Basel). 2024 May 17;15(5):639. doi: 10.3390/genes15050639. Genes (Basel). 2024. PMID: 38790268 Free PMC article. Review.
-
Mining High-Level Imaging Genetic Associations via Clustering AD Candidate Variants with Similar Brain Association Patterns.Genes (Basel). 2022 Aug 24;13(9):1520. doi: 10.3390/genes13091520. Genes (Basel). 2022. PMID: 36140686 Free PMC article.
References
-
- Jansen IE, Savage JE, Watanabe K, Bryois J, Williams DM, Steinberg S, Sealock J, Karlsson IK, Hägg S, Athanasiu L, et al. Genome-wide meta-analysis identifies new loci and functional pathways influencing alzheimer’s disease risk. Nat Genet. 2019;51(3):404–413. doi: 10.1038/s41588-018-0311-9. - DOI - PMC - PubMed
-
- Association A, et al. 2020 alzheimer’s disease facts and figures. Alzheimer’s Dement. 2020;16(3):391–460. doi: 10.1002/alz.12068. - DOI
-
- Kunkle BW, Grenier-Boley B, Sims R, Bis JC, Damotte V, Naj AC, Boland A, Vronskaya M, Van Der Lee SJ, Amlie-Wolf A, et al. Genetic meta-analysis of diagnosed alzheimer’s disease identifies new risk loci and implicates a, tau, immunity and lipid processing. Nat Genet. 2019;51(3):414–430. doi: 10.1038/s41588-019-0358-2. - DOI - PMC - PubMed
Publication types
MeSH terms
Substances
Grants and funding
LinkOut - more resources
Full Text Sources
Medical
