

Feature extraction from MRI ADC images for brain tumor classification using machine learning techniques
- PMID: 35915448
- PMCID: PMC9344709
- DOI: 10.1186/s12938-022-01022-6
Feature extraction from MRI ADC images for brain tumor classification using machine learning techniques
Abstract
Background: Diffusion-weighted (DW) imaging is a well-recognized magnetic resonance imaging (MRI) technique that is being routinely used in brain examinations in modern clinical radiology practices. This study focuses on extracting demographic and texture features from MRI Apparent Diffusion Coefficient (ADC) images of human brain tumors, identifying the distribution patterns of each feature and applying Machine Learning (ML) techniques to differentiate malignant from benign brain tumors.
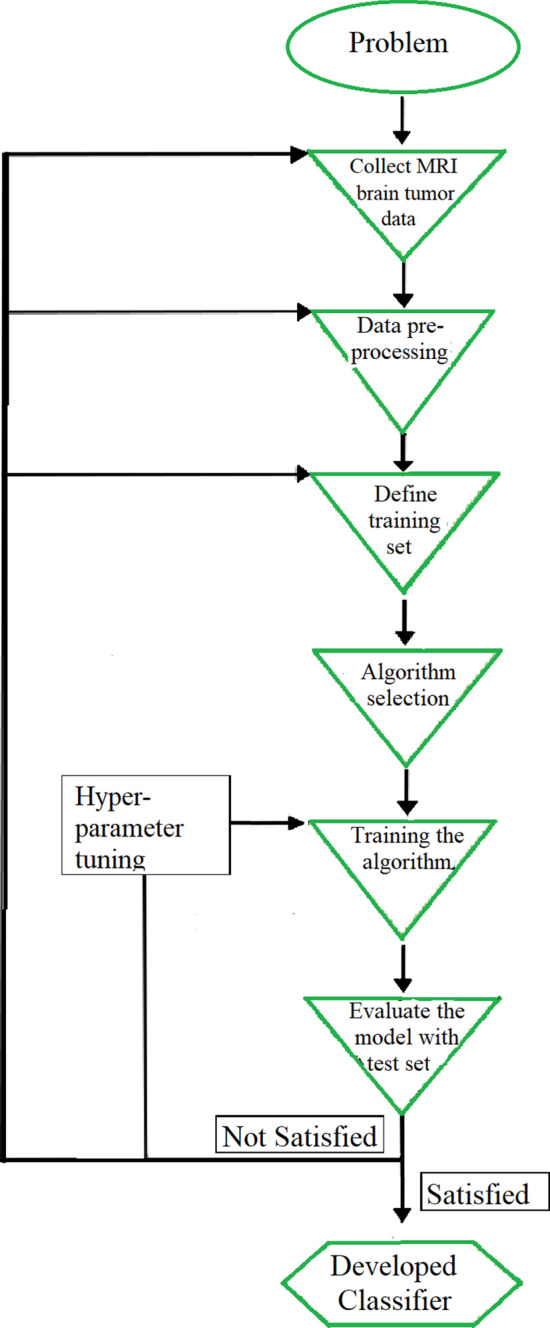
Methods: This prospective study was carried out using 1599 labeled MRI brain ADC image slices, 995 malignant, 604 benign from 195 patients who were radiologically diagnosed and histopathologically confirmed as brain tumor patients. The demographics, mean pixel values, skewness, kurtosis, features of Grey Level Co-occurrence Matrix (GLCM), mean, variance, energy, entropy, contrast, homogeneity, correlation, prominence and shade, were extracted from MRI ADC images of each patient. At the feature selection phase, the validity of the extracted features were measured using ANOVA f-test. Then, these features were used as input to several Machine Learning classification algorithms and the respective models were assessed.
Results: According to the results of ANOVA f-test feature selection process, two attributes: skewness (3.34) and GLCM homogeneity (3.45) scored the lowest ANOVA f-test scores. Therefore, both features were excluded in continuation of the experiment. From the different tested ML algorithms, the Random Forest classifier was chosen to build the final ML model, since it presented the highest accuracy. The final model was able to predict malignant and benign neoplasms with an 90.41% accuracy after the hyper parameter tuning process.
Conclusions: This study concludes that the above mentioned features (except skewness and GLCM homogeneity) are informative to identify and differentiate malignant from benign brain tumors. Moreover, they enable the development of a high-performance ML model that has the ability to assist in the decision-making steps of brain tumor diagnosis process, prior to attempting invasive diagnostic procedures, such as brain biopsies.
Keywords: ANOVA f-test feature selection; Apparent diffusion coefficient; Brain tumor classification; Diffusion weighted imaging; Machine learning; Magnetic resonance imaging; Random forest.
© 2022. The Author(s).
Conflict of interest statement
The authors declare that they have no competing interests.
Figures


References
-
- Jafarpour S, Sedghi Z, Amirani MC. A robust brain MRI classification with GLCM features. Int J Comput Appl. 2012;37(12):1–5.
-
- Kohler BA, Ward E, McCarthy BJ, Schymura MJ, Ries LA, Eheman C, Jemal A, Anderson RN, Ajani UA, Edwards BK. Annual report to the nation on the status of cancer, 1975–2007, featuring tumors of the brain and other nervous system. J Natl Cancer Inst. 2011;103(9):714–736. doi: 10.1093/jnci/djr077. - DOI - PMC - PubMed
-
- Arakeri MP, Reddy GRM. Computer-aided diagnosis system for tissue characterization of brain tumor on magnetic resonance images. Signal Image Video Process. 2015;9(2):409–425. doi: 10.1007/s11760-013-0456-z. - DOI
MeSH terms
LinkOut - more resources
Full Text Sources
Medical
