

Machine learning algorithms' accuracy in predicting kidney disease progression: a systematic review and meta-analysis
- PMID: 35915457
- PMCID: PMC9341041
- DOI: 10.1186/s12911-022-01951-1
Machine learning algorithms' accuracy in predicting kidney disease progression: a systematic review and meta-analysis
Abstract
Background: Kidney disease progression rates vary among patients. Rapid and accurate prediction of kidney disease outcomes is crucial for disease management. In recent years, various prediction models using Machine Learning (ML) algorithms have been established in nephrology. However, their accuracy have been inconsistent. Therefore, we conducted a systematic review and meta-analysis to investigate the diagnostic accuracy of ML algorithms for kidney disease progression.
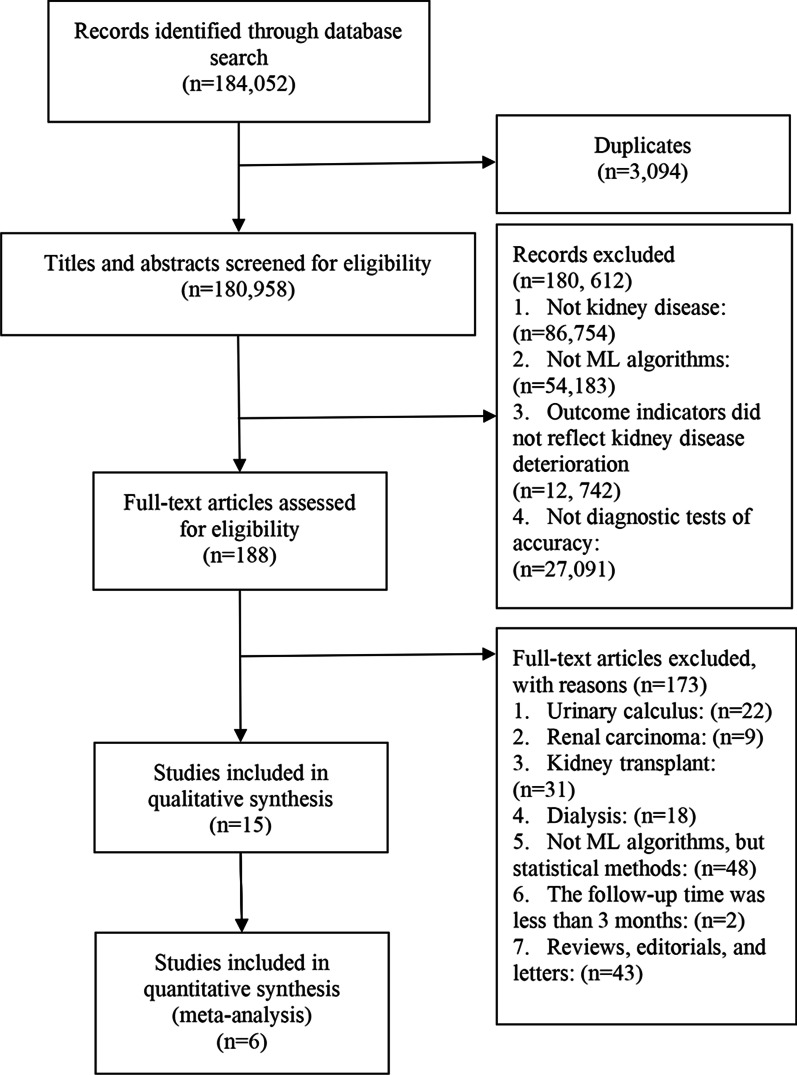
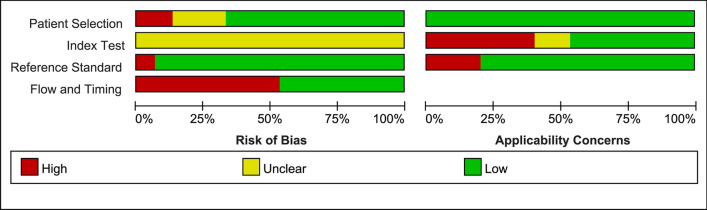
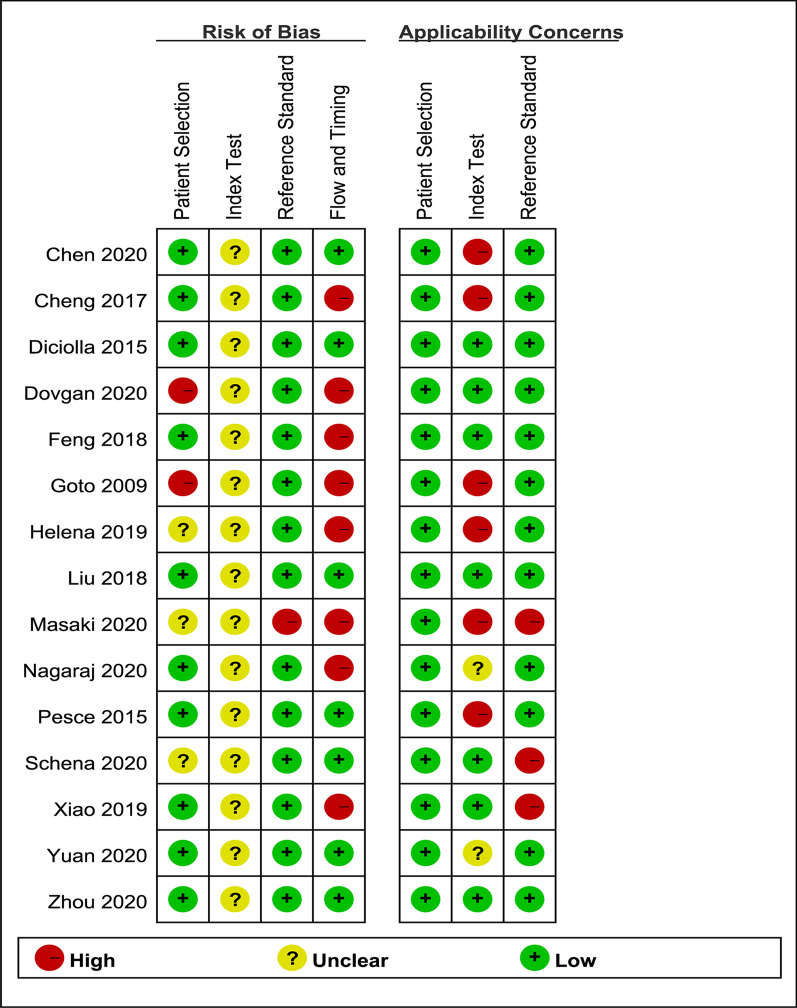
Methods: We searched PubMed, EMBASE, Cochrane Central Register of Controlled Trials, the Chinese Biomedicine Literature Database, Chinese National Knowledge Infrastructure, Wanfang Database, and the VIP Database for diagnostic studies on ML algorithms' accuracy in predicting kidney disease prognosis, from the establishment of these databases until October 2020. Two investigators independently evaluate study quality by QUADAS-2 tool and extracted data from single ML algorithm for data synthesis using the bivariate model and the hierarchical summary receiver operating characteristic (HSROC) model.
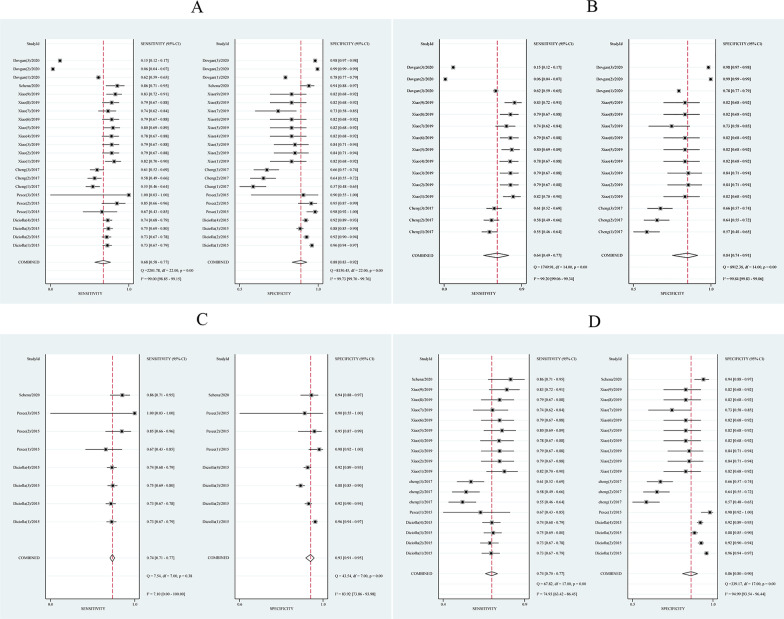
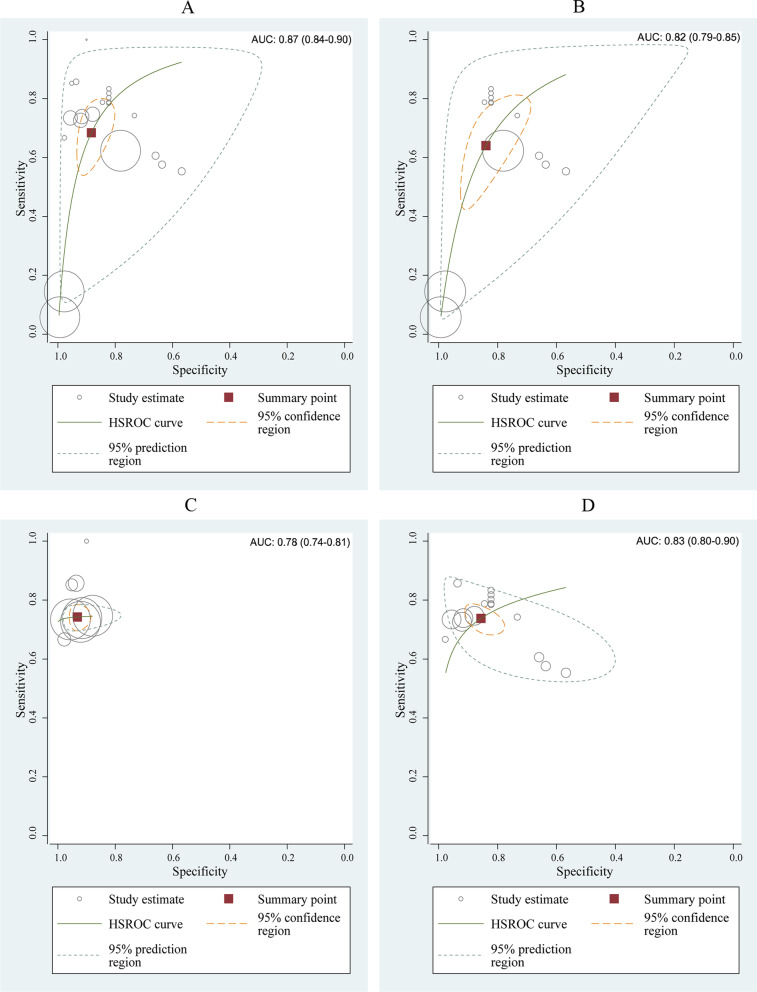
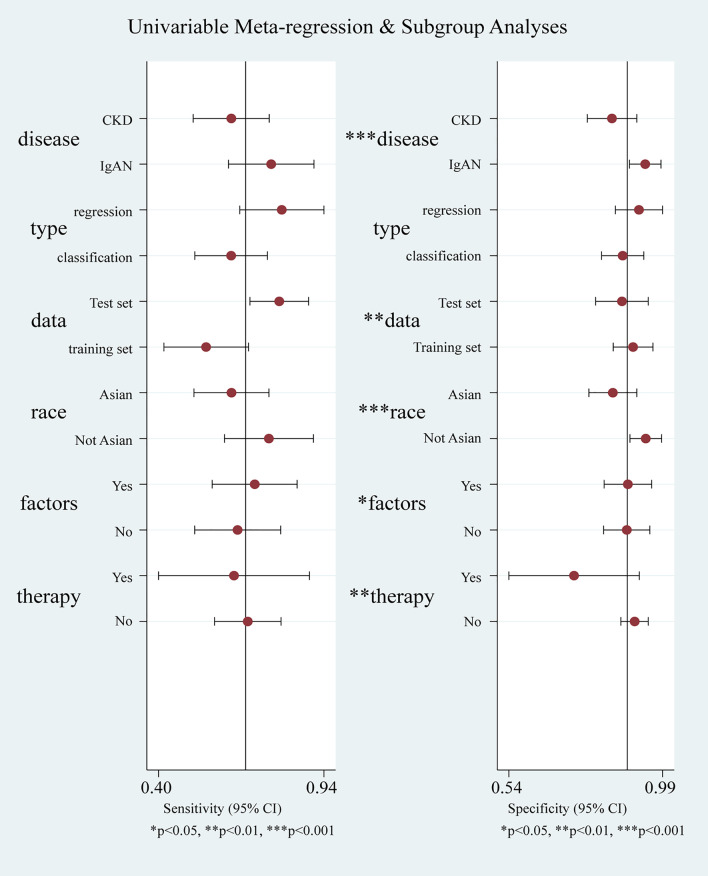
Results: Fifteen studies were left after screening, only 6 studies were eligible for data synthesis. The sample size of these 6 studies was 12,534, and the kidney disease types could be divided into chronic kidney disease (CKD) and Immunoglobulin A Nephropathy, with 5 articles using end-stage renal diseases occurrence as the primary outcome. The main results indicated that the area under curve (AUC) of the HSROC was 0.87 (0.84-0.90) and ML algorithm exhibited a strong specificity, 95% confidence interval and heterogeneity (I2) of (0.87, 0.84-0.90, [I2 99.0%]) and a weak sensitivity of (0.68, 0.58-0.77, [I2 99.7%]) in predicting kidney disease deterioration. And the the results of subgroup analysis indicated that ML algorithm's AUC for predicting CKD prognosis was 0.82 (0.79-0.85), with the pool sensitivity of (0.64, 0.49-0.77, [I2 99.20%]) and pool specificity of (0.84, 0.74-0.91, [I2 99.84%]). The ML algorithm's AUC for predicting IgA nephropathy prognosis was 0.78 (0.74-0.81), with the pool sensitivity of (0.74, 0.71-0.77, [I2 7.10%]) and pool specificity of (0.93, 0.91-0.95, [I2 83.92%]).
Conclusion: Taking advantage of big data, ML algorithm-based prediction models have high accuracy in predicting kidney disease progression, we recommend ML algorithms as an auxiliary tool for clinicians to determine proper treatment and disease management strategies.
Keywords: Artificial intelligence; CKD progression; Chronic kidney disease; Immunoglobulin A nephropathy; Machine learning algorithm; Prediction models.
© 2022. The Author(s).
Conflict of interest statement
The authors declare that they have no competing interests.
Figures
Similar articles
-
Predicting radiation pneumonitis in lung cancer using machine learning and multimodal features: a systematic review and meta-analysis of diagnostic accuracy.BMC Cancer. 2024 Nov 5;24(1):1355. doi: 10.1186/s12885-024-13098-5. BMC Cancer. 2024. PMID: 39501204 Free PMC article.
-
The predictive effect of different machine learning algorithms for pressure injuries in hospitalized patients: A network meta-analyses.Heliyon. 2022 Nov 2;8(11):e11361. doi: 10.1016/j.heliyon.2022.e11361. eCollection 2022 Nov. Heliyon. 2022. PMID: 36387440 Free PMC article.
-
Diagnostic accuracy of machine-learning-assisted detection for anterior cruciate ligament injury based on magnetic resonance imaging: Protocol for a systematic review and meta-analysis.Medicine (Baltimore). 2019 Dec;98(50):e18324. doi: 10.1097/MD.0000000000018324. Medicine (Baltimore). 2019. PMID: 31852123 Free PMC article.
-
Artificial intelligence and machine learning applications in urinary tract infections identification and prediction: a systematic review and meta-analysis.World J Urol. 2024 Aug 1;42(1):464. doi: 10.1007/s00345-024-05145-4. World J Urol. 2024. PMID: 39088072
-
Applying stacking ensemble method to predict chronic kidney disease progression in Chinese population based on laboratory information system: a retrospective study.PeerJ. 2024 Nov 1;12:e18436. doi: 10.7717/peerj.18436. eCollection 2024. PeerJ. 2024. PMID: 39498292 Free PMC article.
Cited by
-
Derivation and Validation of a Machine Learning Model for the Prevention of Unplanned Dialysis.Clin J Am Soc Nephrol. 2024 Sep 1;19(9):1098-1108. doi: 10.2215/CJN.0000000000000489. Epub 2024 May 24. Clin J Am Soc Nephrol. 2024. PMID: 38787617
-
Classification of primary glomerulonephritis using machine learning models: a focus on IgA nephropathy prediction.BMC Nephrol. 2025 Jun 23;26(1):289. doi: 10.1186/s12882-025-04253-6. BMC Nephrol. 2025. PMID: 40551127 Free PMC article.
-
An integrated machine learning predictive scheme for longitudinal laboratory data to evaluate the factors determining renal function changes in patients with different chronic kidney disease stages.Front Med (Lausanne). 2023 Oct 4;10:1155426. doi: 10.3389/fmed.2023.1155426. eCollection 2023. Front Med (Lausanne). 2023. PMID: 37859858 Free PMC article.
-
Artificial intelligence in chronic kidney disease management: a scoping review.Theranostics. 2025 Mar 21;15(10):4566-4578. doi: 10.7150/thno.108552. eCollection 2025. Theranostics. 2025. PMID: 40225559 Free PMC article.
-
Benefits of Information Technology in Healthcare: Artificial Intelligence, Internet of Things, and Personal Health Records.Healthc Inform Res. 2023 Oct;29(4):323-333. doi: 10.4258/hir.2023.29.4.323. Epub 2023 Oct 31. Healthc Inform Res. 2023. PMID: 37964454 Free PMC article.
References
-
- World Health Organization. World Health Statistics 2019 Monitoring Health for The SDGs, Sustainable Development Goals. Geneva: World Health Organization; 2019.Licence: CCBY-NC-SA3.0IGO.https://apps.who.int/iris/bitstream/handle/10665/324835/9789241565707-en....
-
- Scott J, Danile E, Andrew S, et al. National kidney foundation’s primer on kidney disease. 7. New York City: Elsevier; 2018. pp. 2–18.
Publication types
MeSH terms
LinkOut - more resources
Full Text Sources
Medical
Miscellaneous
