. 2022 Aug 1;4(1):46.
doi: 10.1186/s42523-022-00194-9.

Longitudinal fecal microbiome and metabolite data demonstrate rapid shifts and subsequent stabilization after an abrupt dietary change in healthy adult dogs

Affiliations

Longitudinal fecal microbiome and metabolite data demonstrate rapid shifts and subsequent stabilization after an abrupt dietary change in healthy adult dogs

Ching-Yen Lin et al. Anim Microbiome. .

Abstract

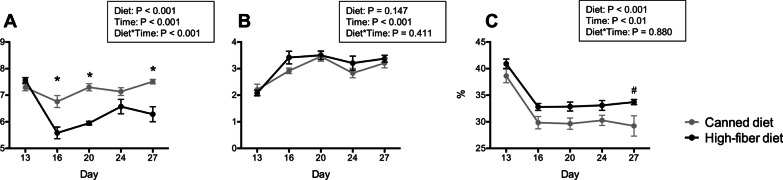
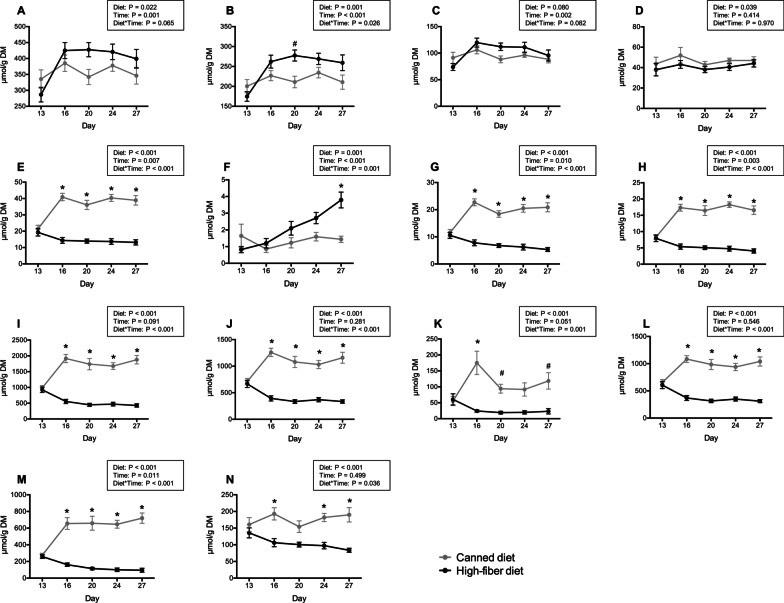
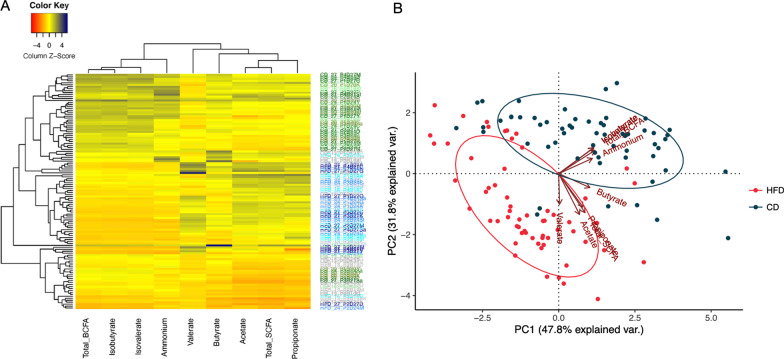
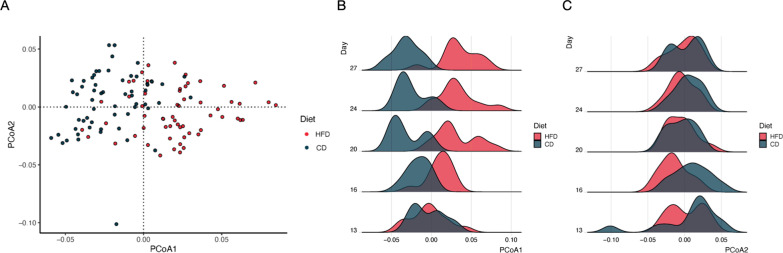
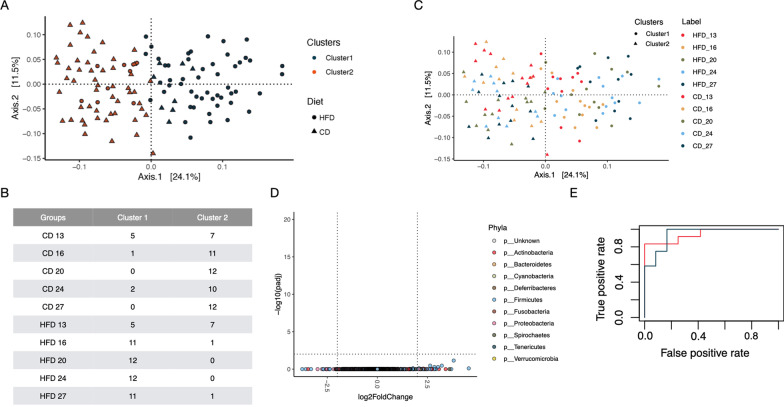
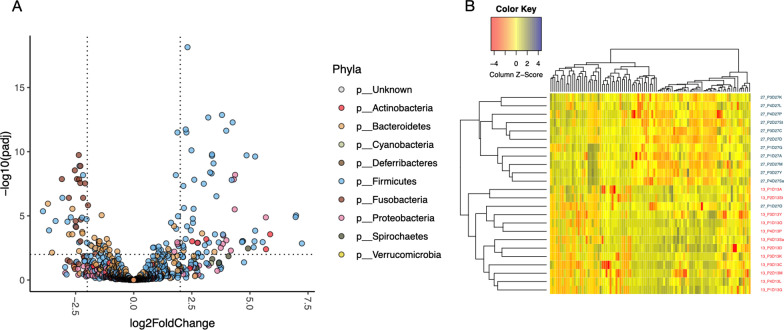
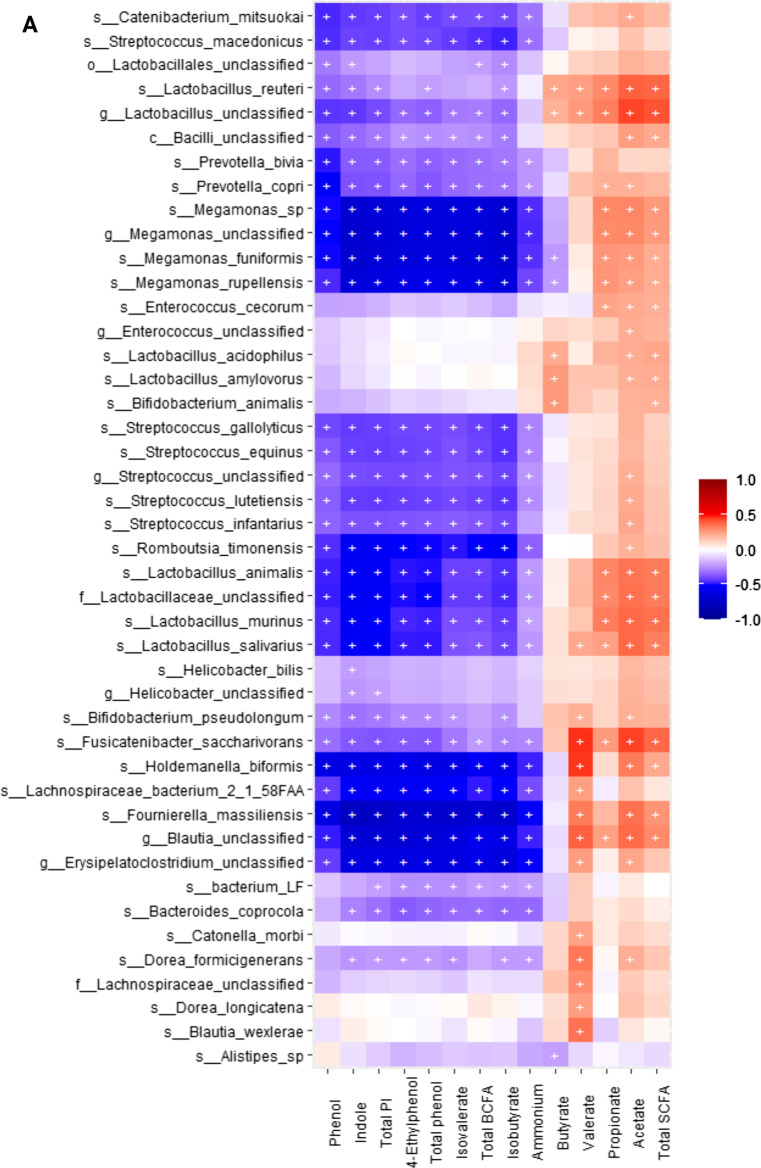
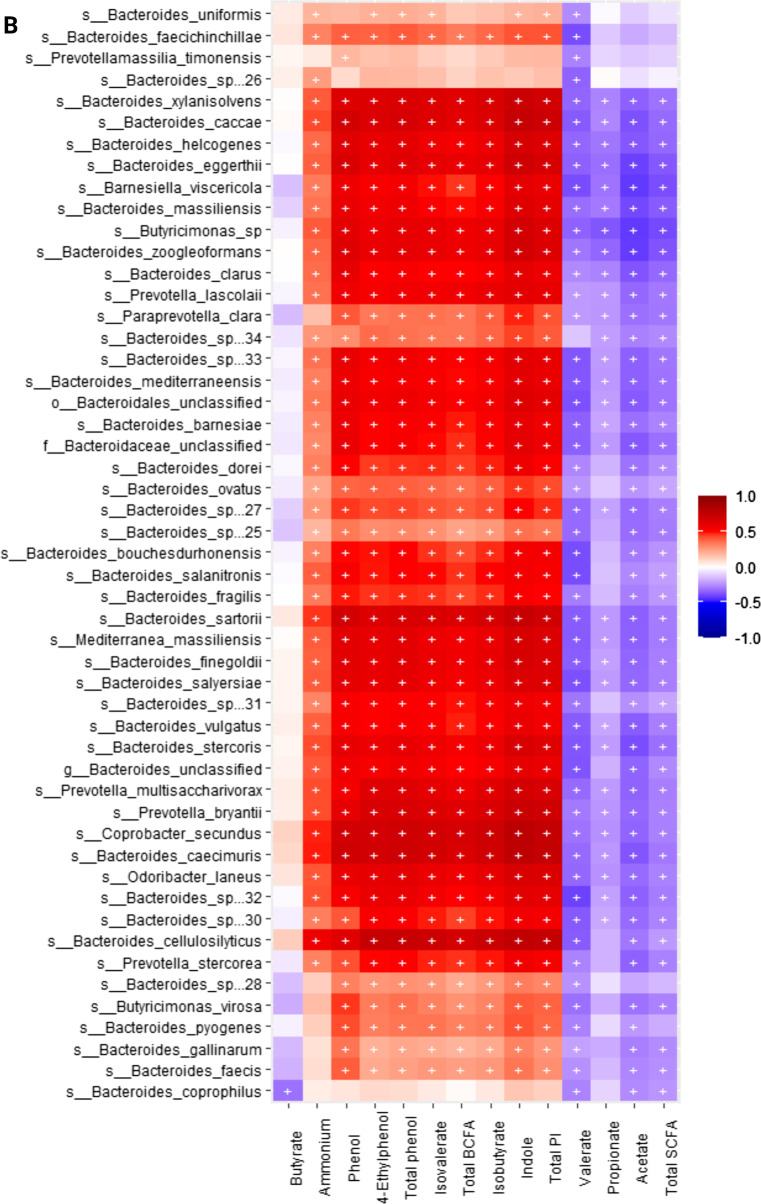
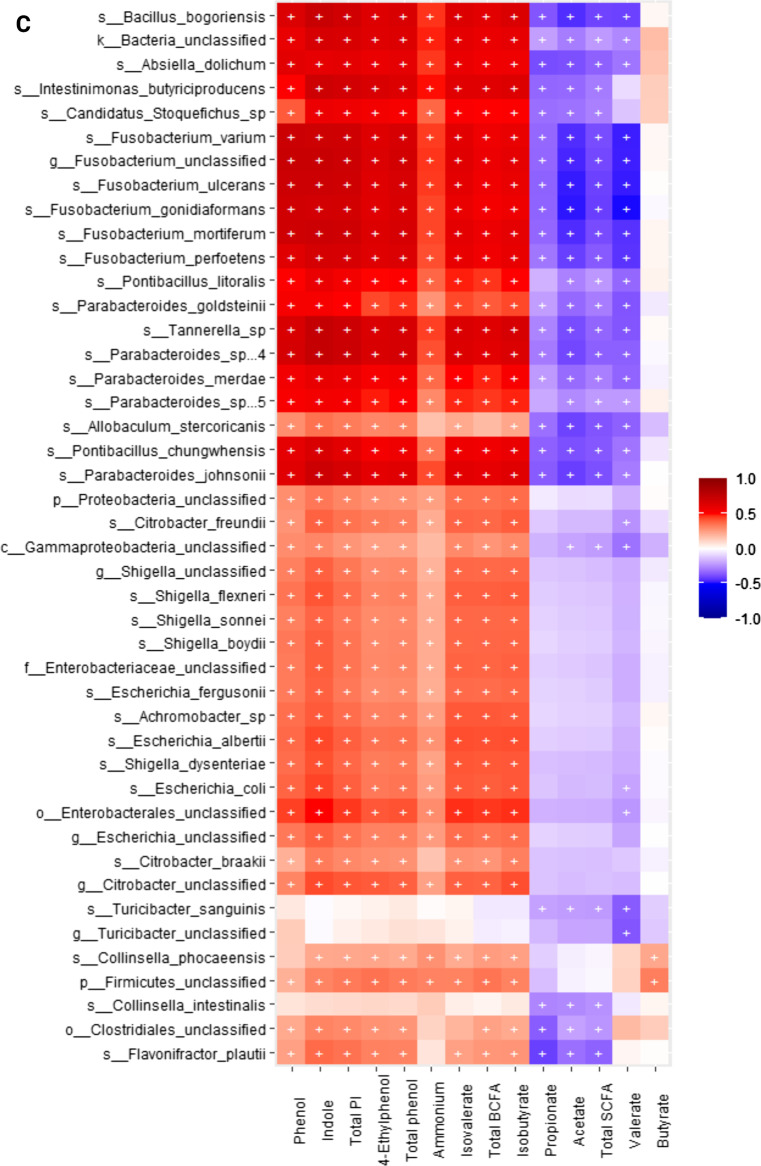
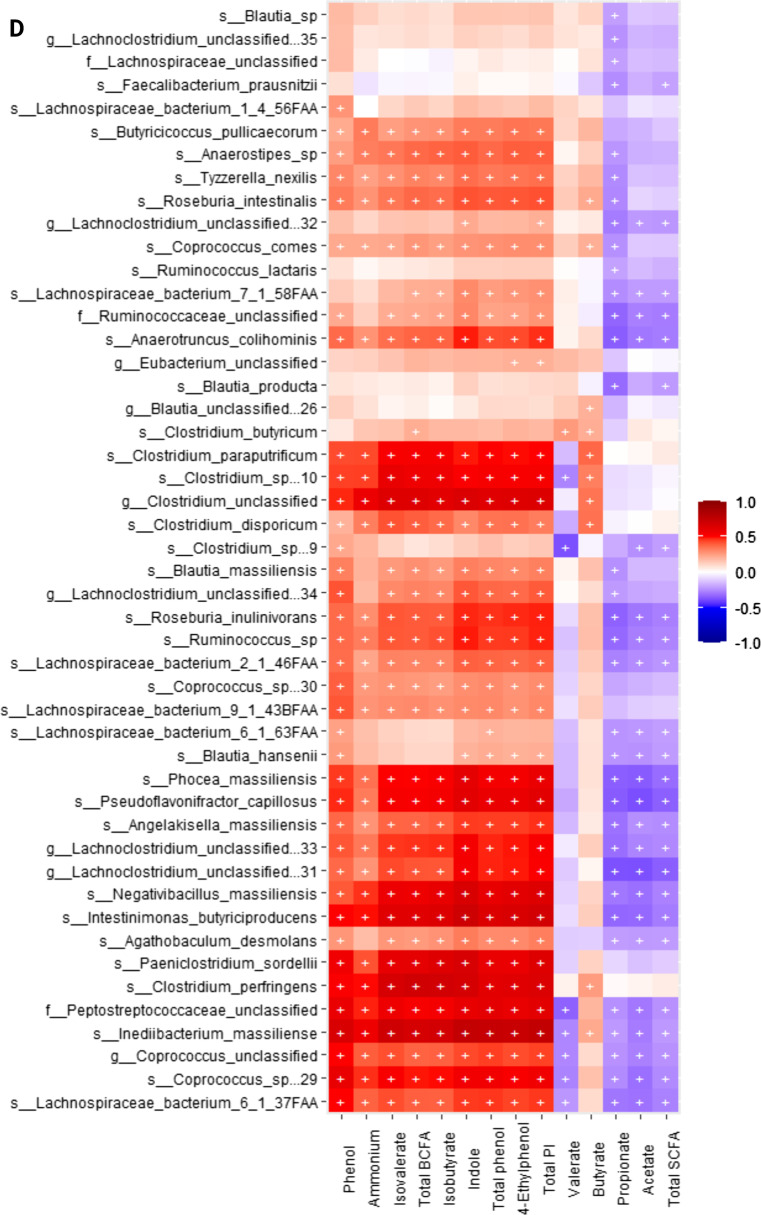
Background: Diet has a large influence on gut microbiota diversity and function. Although previous studies have investigated the effect of dietary interventions on the gut microbiome, longitudinal changes in the gut microbiome, microbial functions, and metabolite profiles post dietary interventions have been underexplored. How long these outcomes require to reach a steady-state, how they relate to one another, and their impact on host physiological changes are largely unknown. To address these unknowns, we collected longitudinal fecal samples following an abrupt dietary change in healthy adult beagles (n = 12, age: 5.16 ± 0.87 year, BW: 13.37 ± 0.68 kg) using a crossover design. All dogs were fed a kibble diet (control) from d1-14, and then fed that same diet supplemented with fiber (HFD) or a protein-rich canned diet (CD) from d15-27. Fresh fecal samples were collected on d13, 16, 20, 24, and 27 for metabolite and microbiome assessment. Fecal microbial diversity and composition, metabolite profiles, and microbial functions dramatically diverged and stabilized within a few days (2 d for metabolites; 6 d for microbiota) after dietary interventions. Fecal acetate, propionate, and total short-chain fatty acids increased after change to HFD, while fecal isobutyrate, isovalerate, total branched-chain fatty acids, phenol, and indole increased after dogs consumed CD. Relative abundance of ~ 100 bacterial species mainly belonging to the Firmicutes, Proteobacteria, and Actinobacteria phyla increased in HFD. These shifts in gut microbiome diversity and composition were accompanied by functional changes. Transition to HFD led to increases in the relative abundance of KEGG orthology (KO) terms related to starch and sucrose metabolism, fatty acid biosynthesis, and amino sugar and nucleotide sugar metabolism, while transition to CD resulted in increased relative abundance of KO terms pertaining to inositol phosphate metabolism and sulfur metabolism. Significant associations among fecal microbial taxa, KO terms, and metabolites were observed, allowing for high-accuracy prediction of diet group by random forest analysis.

Conclusions: Longitudinal sampling and a multi-modal approach to characterizing the gastrointestinal environment allowed us to demonstrate how drastically and quickly dietary changes impact the fecal microbiome and metabolite profiles of dogs following an abrupt dietary change and identify key microbe-metabolite relationships that allowed for treatment prediction.

Keywords: Canine metagenome; Fecal metabolites; Gastrointestinal health; Gut microbiota; Microbial function.


Conflict of interest statement

A.R.J., J.S., and R.W.H. hold stock options in and/or are employed by NomNomNow, Inc. All other authors have no conflicts of interest.

Figures

Fig. 1
Fig. 1
Fecal characteristics, including fecal pH (A), fecal scores (B), and fecal dry matter (C) of dogs fed a high-fiber diet or protein-rich canned diet. *Mean values within time points that were different between diets (P < 0.05); #Mean values within time points that tended to be different between diets (P < 0.10). Fecal samples were scored according to a 5-point scale: 1 = hard, dry pellets, small hard mass; 2 = hard, formed, dry stool; remains firm and soft; 3 = soft, formed, and moist stool, retains shape; 4 = soft, unformed stool, assumes shape of container; and 5 = watery, liquid that can be poured
Fig. 2
Fig. 2
Fecal total short-chain fatty acids (A), acetate (B), propionate (C), butyrate (D), total branched-chain fatty acids (E), valerate (F), isovalerate (G), isobutyrate (H), total phenol and indole (I), total phenol (J), phenol (K), 4-ethylphenol (L), indole (M), and ammonia (N) of dogs fed a high-fiber diet or protein-rich canned diet. *Mean values within time points that were different between diets (P < 0.05); #Mean values within time points that tended to be different between diets (P < 0.10)
Fig. 3
Fig. 3
A Heatmap showing differences in fecal metabolites including short-chain fatty acids (SCFA), branched-chain fatty acids (BCFA) and ammonia in different diet groups [grey: control diet at baseline (d 13); green: high-fiber diet (HFD); blue: protein-rich canned diet (CD)] B PCA plot showing fecal metabolites of the HFD or CD treatment groups clustering together and separately
Fig. 4
Fig. 4
Shifts in fecal microbiome composition between the high-fiber diet (HFD) and the protein-rich canned diet (CD) groups over time from shotgun sequencing. A Principal Coordinate Analysis (PCoA) of species-level fecal microbiomes from all time points using Jensen-Shannon distance. B The fecal bacterial composition was comparable between the diet groups on d 13 when the dietary regimen started. Microbiome composition shifted in opposite directions along PCoA1 over time between diet groups. C No significant shift was observed along PCoA2 over time. PERMANOVA was used to assess the association between diet and period with the fecal microbiome composition. Kruskal-Wallis test was used to assess association between diets and the top two axes (PCo1, PCo2) followed by Dunn’s post-hoc test to evaluate the difference over time within each dietary group
Fig. 5
Fig. 5
Differences between groups and between time points within each group. A Partitioning around medoids clustering of fecal microbiota using the top two PCoA axes (Fig. 4) revealed dogs in this study can be partitioned into two clusters (blue and red). BC Cluster 1 contained primarily time points from the high-fiber diet (HFD) and Cluster 2 was enriched with time points from the protein-rich canned diet (CD). At the start of the trial (i.e., d 13), however, individuals were almost evenly split between the two clusters. This agrees with DESeq that showed no differences in genus abundance between the two diet groups at d 13 (D). E Moreover, a random forest (RF) classifier accurately differentiated the microbial compositions by diet
Fig. 6
Fig. 6
Bacterial species associated with the high-fiber diet. A Volcano plot showing differential abundance of bacterial species in the high-fiber diet group between d 13 vs. d 27. Each dot is a bacterial species and dots are colored by phylum. Positive values in x-axis represent species that had higher relative abundance after a high-fiber diet was administered for 14 d (d 27) relative to baseline. Negative values in the x-axis represent species that decreased in abundance in the high-fiber diet group relative to the baseline. The horizontal dotted line represents significance threshold of FDR adjusted P < 0.01 obtained from DESeq2 and the two vertical lines differentiate the species with log2 fold change in abundance. Species with FDR adjusted P < 0.01 and absolute log2 fold change > 2 were considered statistically significant. B Heatmap showing differences in relative abundance of differentially abundant bacterial species between d 13 (red) and d 27 (green)
Fig. 7
Fig. 7
Bacterial species associated with the protein-rich canned diet. A Volcano plot showing differential abundance of bacterial species in the protein-rich canned diet group between d 13 vs. d 27. Each dot is a bacterial species and dots are colored by phylum. Positive values in x-axis represent species that had higher relative abundance after fiber diet was administered for 14 d (d 27) relative to baseline. Negative values in the x-axis represent species that decreased in abundance in the protein-rich canned diet relative to the baseline. The horizontal dotted line represents significance threshold of FDR adjusted P < 0.01 obtained from DESeq2 and the two vertical lines differentiate the species with log2 fold change in abundance. Species with FDR adjusted P < 0.01 and absolute log2 fold change > 2 were considered statistically significant. B Heatmap showing differences in relative abundance of differentially abundant bacterial species between d 13 (red) and d 27 (green)
Fig. 8
Fig. 8
Shifts in predicted gut microbial functions between the high-fiber diet (HFD) and the protein-rich canned diet (CD) groups over time. A Principal Coordinate Analysis (PCoA) of KO using Jensen-Shannon distance shows that KO terms were comparable between the diet groups on d 13 when the dietary regimen started. No significant shift was observed along PCoA1. B KO terms shifted in opposite directions along PCoA2 over time between diet groups. A Kruskal-Wallis test was used to assess association between diets and the top two PCoA axes followed by Dunn’s post-hoc test to evaluate the difference between groups. Heatmaps show differences in relative abundance of KO terms between d 13 (red) and d 27 (green) in the HFD group (C) and the CD group (D)
Fig. 9
Fig. 9
Heatmap of significant correlation values (r) between fecal microbial species and fecal metabolites. A Bacteria that primarily had a negative correlation with phenols, indoles and branched-chain fatty acids (BCFA; products of protein fermentation) and a positive correlation with short-chain fatty acids (SCFA; products of carbohydrate fermentation). B-D Bacteria that primarily had a positive correlation with phenols, indoles, and BCFA and a negative correlation with SCFA. The X and Y axes of the thermal graph are the metabolites and species, respectively. R values are represented by different colors (red: positive; blue: negative). Significant correlations (adj P < 0.05) are indicated by ‘+’
Fig. 9
Fig. 9
Heatmap of significant correlation values (r) between fecal microbial species and fecal metabolites. A Bacteria that primarily had a negative correlation with phenols, indoles and branched-chain fatty acids (BCFA; products of protein fermentation) and a positive correlation with short-chain fatty acids (SCFA; products of carbohydrate fermentation). B-D Bacteria that primarily had a positive correlation with phenols, indoles, and BCFA and a negative correlation with SCFA. The X and Y axes of the thermal graph are the metabolites and species, respectively. R values are represented by different colors (red: positive; blue: negative). Significant correlations (adj P < 0.05) are indicated by ‘+’

Similar articles

Cited by

References

    1. Carmody RN, Gerber GK, Luevano JM, Gatti DM, Somes L, Svenson KL, et al. Diet dominates host genotype in shaping the murine gut microbiota. Cell Host Microbe. 2015;17:72–84. - PMC - PubMed
    1. Wernimont SM, Radosevich J, Jackson MI, Ephraim E, Badri DV, MacLeay JM, et al. The effects of nutrition on the gastrointestinal microbiome of cats and gogs: impact on health and disease. Front Microbiol. 2020;11:1266. - PMC - PubMed
    1. Holscher HD. Dietary fiber and prebiotics and the gastrointestinal microbiota. New York: Taylor and Francis Inc.; 2017. pp. 172–84. - PMC - PubMed
    1. Desai MS, Seekatz AM, Koropatkin NM, Kamada N, Hickey CA, Wolter M, et al. A dietary fiber-deprived gut microbiota degrades the colonic mucus barrier and enhances Pathogen susceptibility. Cell. 2016;167:1339–1353.e21. - PMC - PubMed
    1. Makki K, Deehan EC, Walter J, Bäckhed F. The impact of dietary fiber on gut microbiota in host health and disease. Cell Host Microbe. 2018;23:705–15. - PubMed

LinkOut - more resources