. 2023 Jan;118(1):48-60.
doi: 10.1111/add.16018. Epub 2022 Aug 17.

Modeling the impact of COVID-19 pandemic-driven increases in alcohol consumption on health outcomes and hospitalization costs in the United States

Affiliations

Modeling the impact of COVID-19 pandemic-driven increases in alcohol consumption on health outcomes and hospitalization costs in the United States

Carolina Barbosa et al. Addiction. 2023 Jan.

Abstract

Background and aims: Alcohol consumption increased in the early phases of the COVID-19 pandemic in the United States. Alcohol use disorder (AUD) and risky drinking are linked to harmful health effects. This paper aimed to project future health and cost impacts of shifts in alcohol consumption during the COVID-19 pandemic.

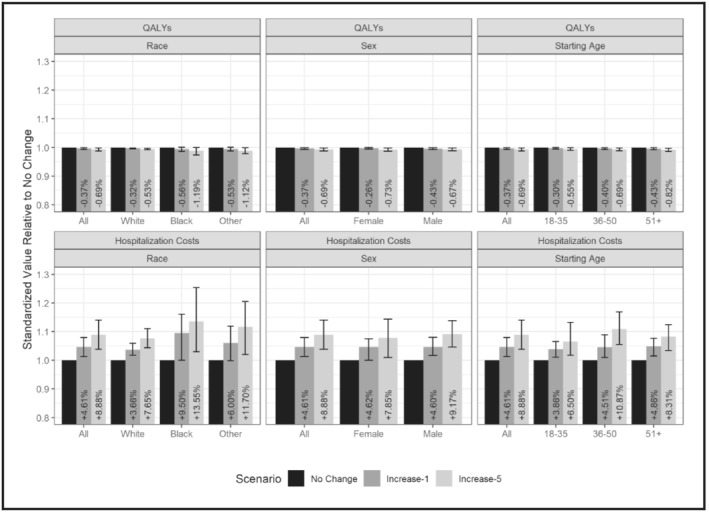
Design: An individual-level simulation model of the long-term drinking patterns for people with life-time AUD was used to simulate 10 000 individuals and project model outcomes to the estimated 25.9 million current drinkers with life-time AUD in the United States. The model considered three scenarios: (1) no change (counterfactual for comparison); (2) increased drinking levels persist for 1 year ('increase-1') and (3) increased drinking levels persist for 5 years ('increase-5').

Setting: United States.

Participants: Current drinkers with life-time AUD.

Measurements: Life expectancy [life-years (LYs)], quality-adjusted life-years (QALYs), alcohol-related hospitalizations and associated hospitalization costs and alcohol-related deaths, during a 5-year period.

Findings: Short-term increases in alcohol consumption (increase-1 scenario) resulted in a loss of 79 000 [95% uncertainty interval (UI]) 26 000-201 000] LYs, a loss of 332 000 (104 000-604 000) QALYs and 295 000 (82 000-501 000) more alcohol-related hospitalizations, costing an additional $5.4 billion ($1.5-9.3 billion) over 5 years. Hospitalizations for cirrhosis of the liver accounted for approximately $3.0 billion ($0.9-4.8 billion) in hospitalization costs, more than half the increase across all alcohol-related conditions. Health and cost impacts were more pronounced for older age groups (51+), women and non-Hispanic black individuals. Increasing the duration of pandemic-driven increases in alcohol consumption in the increase-5 scenario resulted in larger impacts.

Conclusions: Simulations show that if the increase in alcohol consumption observed in the United States in the first year of the pandemic continues, alcohol-related mortality, morbidity and associated costs will increase substantially over the next 5 years.

Keywords: COVID-19; alcohol consumption; alcohol use disorder; alcohol-related hospitalizations; alcohol-related liver disease; alcohol-related morbidity and mortality; health utility; hospitalization cost; simulation model.


Figures

FIGURE 1
FIGURE 1
Average drinks per day over the first 10 years by simulation scenario. The shading shows the 95% uncertainty interval for drinks per day (DPD) during the first 10 years of the simulation. Uncertainty diminishes over time once drinking level transition probabilities return to their pre‐COVID levels, because uncertainty intervals in the figure capture the uncertainty related to changes in consumption during the pandemic. With each passing cycle, simulated individuals with alcohol use disorder (AUD) grow closer to the transition probability’s steady state. At the beginning of the simulation (year = 0), the average DPD is 4.4 drinks for all scenarios. In the no change scenario, DPD decreases to 3.2 drinks after 5 years and to 2.5 DPD by 10 years. In the increase‐1 scenario, average DPD increases to 5.1 after year 1, drops to 3.4 DPD by year 5 and to 2.6 DPD by year 10. In the increase‐5 scenario a high drinking level, approximately 5.1 DPD, is sustained for 5 years, dropping to approximately 3 DPD by year 10. Reduced drinking through time results from the long‐term drinking patterns calibrated in the validated model [16], as is also consistent with the general literature that shows that alcohol consumption declines steadily with age [79].
FIGURE 2
FIGURE 2
Standardized outcomes per person for each COVID scenario by race, sex and age strata, 5‐year follow‐up. Standardized outcomes computed by dividing each stratum’s value for a particular outcome by the no change value within that scenario. Starting age refers to the age of the individual when entering the model (and the age at which changes in consumption due to COVID took effect). Error bars represent the impact of uncertainty in consumption changes, using the values of the 95% confidence interval of the survey estimates. Percentages represent the difference in the outcome compared to the no change scenario. This figure shows standardized outcomes for quality‐adjusted life‐years (QALYs) and hospitalization costs over a 5‐year follow‐up period for each increased drinking scenario and stratum. We see a larger decline in QALYs and a larger increase in hospitalization costs for non‐Hispanic black people and people in the other race/ethnicity group, which includes Hispanic people and those of races other than black and white. The standardized outcomes also show a larger effect of the increase in consumption for women than for men. By age group, standardized differences in QALYs and costs are most apparent in the increase‐5 scenario. There is a larger cost increase for people aged 36–50 years and a slightly larger QALY decrease for people aged 51 years or older. Supporting information, Appendix Figure B1 shows results for LYs and total hospitalizations for the 5‐year follow‐up period.

References

    1. Esterwood E, Saeed SA. Past epidemics, natural disasters, COVID19, and mental health: learning from history as we deal with the present and prepare for the future. Psychiatry Q. 2020;91:1121–33. - PMC - PubMed
    1. Wu P, Liu X, Fang Y, Fan B, Fuller CJ, Guan Z, et al. Alcohol abuse/dependence symptoms among hospital employees exposed to a SARS outbreak. Alcohol Alcohol. 2008;43:706–12. - PMC - PubMed
    1. Moise IK, Ruiz MO. Hospitalizations for substance abuse disorders before and after hurricane Katrina: spatial clustering and area‐level predictors, New Orleans, 2004 and 2008. Prev Chronic Dis. 2016;13:E145. - PMC - PubMed
    1. North CS, Ringwalt CL, Downs D, Derzon J, Galvin D. Postdisaster course of alcohol use disorders in systematically studied survivors of 10 disasters. Arch Gen Psychiatry. 2011;68:173–80. - PubMed
    1. Welch AE, Caramanica K, Maslow CB, Cone JE, Farfel MR, Keyes KM, et al. Frequent binge drinking five to six years after exposure to 9/11: findings from the world trade center health registry. Drug Alcohol Depend. 2014;140:1–7. - PMC - PubMed

Publication types