Irisin Ameliorates Intervertebral Disc Degeneration by Activating LATS/YAP/CTGF Signaling
- PMID: 35915608
- PMCID: PMC9338732
- DOI: 10.1155/2022/9684062
Irisin Ameliorates Intervertebral Disc Degeneration by Activating LATS/YAP/CTGF Signaling
Abstract
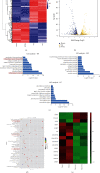
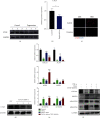
Unbalanced metabolism of an extracellular matrix (ECM) in nucleus pulposus cells (NPCs) is widely acknowledged as the primary cause of intervertebral disc degeneration (IDD). Irisin, a novel myokine, is cleaved from fibronectin type III domain-containing 5 (FNDC5) and has recently been proven to regulate the metabolism of ECM. However, little is known about its potential on NPCs and the development of IDD. Therefore, this study sought to examine the protective effects and molecular mechanism of irisin on IDD in vivo and in vitro. Decreased expression levels of FNDC5 and anabolism markers (COL2A1 and ACAN) but increased levels of catabolism markers (ADAMTS4) were found in degenerative nucleus pulposus (NP) tissues. In a punctured-induced rat IDD model, irisin treatment was found to significantly slow the development of IDD, and in TNF-α-stimulated NPCs, irisin treatment partly reversed the disorder of ECM metabolism. In mechanism, RNA-seq results suggested that irisin treatment affected the Hippo signaling pathway. Further studies revealed that with irisin treatment, the phosphorylation levels of key factors (LATS and YAP) were downregulated, while the expression level of CTGF was upregulated. Moreover, CTGF knockdown partially eliminated the protective effects of irisin on the metabolism of ECM in NPCs, including inhibiting the anabolism and promoting the catabolism. Taken together, this study demonstrated that the expression levels of FNDC5 were decreased in degenerative NP tissues, while irisin treatment promoted the anabolism, inhibited the catabolism of the ECM in NPCs, and delayed the progression of IDD via LATS/YAP/CTGF signaling. These results shed light on the protective actions of irisin on NPCs, leading to the development of a novel therapeutic target for treating IDD.
Copyright © 2022 Taiqiu Chen et al.
Conflict of interest statement
The authors declare that there is no conflict of interest regarding the publication of this paper.
Figures


Similar articles
-
IL-32 aggravates metabolic disturbance in human nucleus pulposus cells by activating FAT4-mediated Hippo/YAP signaling.Int Immunopharmacol. 2024 Nov 15;141:112966. doi: 10.1016/j.intimp.2024.112966. Epub 2024 Aug 22. Int Immunopharmacol. 2024. PMID: 39178518
-
Chondroitin synthase-3 regulates nucleus pulposus degeneration through actin-induced YAP signaling.FASEB J. 2020 Dec;34(12):16581-16600. doi: 10.1096/fj.202001021R. Epub 2020 Oct 22. FASEB J. 2020. PMID: 33089528
-
Melatonin reverses tumor necrosis factor-alpha-induced metabolic disturbance of human nucleus pulposus cells via MTNR1B/Gαi2/YAP signaling.Int J Biol Sci. 2022 Mar 6;18(5):2202-2219. doi: 10.7150/ijbs.65973. eCollection 2022. Int J Biol Sci. 2022. PMID: 35342351 Free PMC article.
-
Notochordal cells: A potential therapeutic option for intervertebral disc degeneration.Cell Prolif. 2024 Feb;57(2):e13541. doi: 10.1111/cpr.13541. Epub 2023 Sep 11. Cell Prolif. 2024. PMID: 37697480 Free PMC article. Review.
-
Regulatory Effect of Inflammatory Mediators in Intervertebral Disc Degeneration.Mediators Inflamm. 2023 Apr 17;2023:6210885. doi: 10.1155/2023/6210885. eCollection 2023. Mediators Inflamm. 2023. PMID: 37101594 Free PMC article. Review.
Cited by
-
The mechanisms of exercise improving cardiovascular function by stimulating Piezo1 and TRP ion channels: a systemic review.Mol Cell Biochem. 2025 Jan;480(1):119-137. doi: 10.1007/s11010-024-05000-5. Epub 2024 Apr 16. Mol Cell Biochem. 2025. PMID: 38625513
-
Emerging role and function of Hippo-YAP/TAZ signaling pathway in musculoskeletal disorders.Stem Cell Res Ther. 2024 Oct 29;15(1):386. doi: 10.1186/s13287-024-04011-9. Stem Cell Res Ther. 2024. PMID: 39468616 Free PMC article. Review.
-
The Hippo pathway in bone and cartilage: implications for development and disease.PeerJ. 2025 Apr 22;13:e19334. doi: 10.7717/peerj.19334. eCollection 2025. PeerJ. 2025. PMID: 40292098 Free PMC article. Review.
-
Evolutionary Insights into Irisin/FNDC5: Roles in Aging and Disease from Drosophila to Mammals.Biomolecules. 2025 Feb 11;15(2):261. doi: 10.3390/biom15020261. Biomolecules. 2025. PMID: 40001564 Free PMC article. Review.
-
The physiological and pathogenic roles of yes-associated protein/transcriptional co-activator with PDZ-binding motif in bone or skeletal motor system-related cells.Cytojournal. 2025 Feb 8;22:13. doi: 10.25259/Cytojournal_237_2024. eCollection 2025. Cytojournal. 2025. PMID: 40134564 Free PMC article. Review.
References
MeSH terms
Substances
LinkOut - more resources
Full Text Sources
Miscellaneous

