. 2022 Jul 23:2022:9306614.
doi: 10.1155/2022/9306614. eCollection 2022.

Inhibition of c-MYC-miRNA 19 Pathway Sensitized CML K562 Cells to Etoposide via NHE1 Upregulation

Affiliations

Inhibition of c-MYC-miRNA 19 Pathway Sensitized CML K562 Cells to Etoposide via NHE1 Upregulation

Shannan Cao et al. Oxid Med Cell Longev. .

Abstract

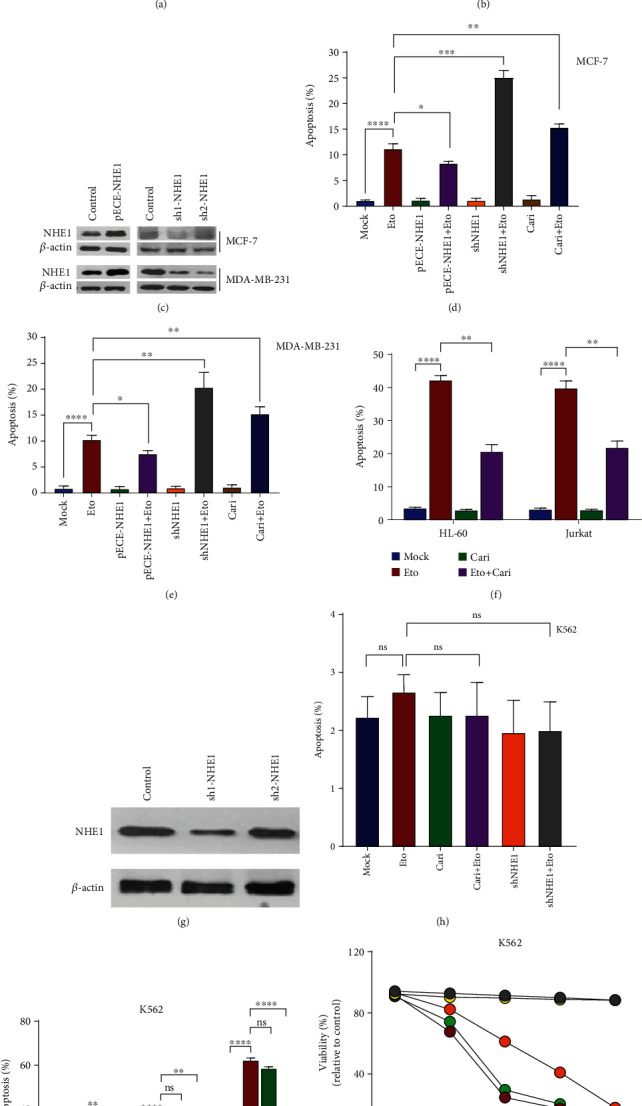
As a previously discovered target of DNA damage, Na+/H+ exchanger 1 (NHE1) plays a role in regulation of intracellular pH (pHi) through the extrusion of intracellular proton (H+) in exchange for extracellular sodium (Na+). Its abnormal expression and dysfunction have been reported in solid tumor and hematopoietic malignancies. Here, we reported that suppression of NHE1 in BCR-ABL+ hematopoietic malignancies' K562 cells treated with Etoposide was manipulated by miR-19 and c-MYC. Inhibition of miR-19 or c-MYC enhanced the expression of NHE1 and sensitized K562 cells to Etoposide in vitro. The in vivo nude mouse transplantation model was also performed to confirm the enhanced sensitivity of K562 cells to Etoposide by inhibiting the miR-19 or c-MYC pathway. TCGA analysis conferred a negative correlation between miR-19 level and leukemia patients' survival. Thus, our results provided a potential management by which the c-MYC-miRNA 19 pathway might have a crucial impact on sensitizing K562 cells to Etoposide in the therapeutic approaches.


Conflict of interest statement

We state here that none of our authors has financial or other conflicts of interest that might be constructed as influencing the results or interpretation of our study.

Figures

Figure 1
Figure 1
NHE1 affected the sensitivity of different cell lines to apoptosis. (a, b) MTT analysis of cells that were exposed to Cariporide (Cari) with or without Etoposide (Eto). OD values of untreated control cells were set as 100%. All other values refer to the untreated control. (c) Western blotting indicating the efficiency of pECE-NHE1 and two shRNA (sh1 and sh2) to NHE1 was carried out in MCF-7 and MDA-MB-231 cells. (d, e) Apoptosis of MCF-7 and MDA-MB-231cells transfected with indicated plasmids or treated with Cariporide was detected. Cells were transfected and then treated with Etoposide for 24 h. (f) Apoptosis of different hematopoietic cell lines exposed to Cariporide with or without Etoposide was shown. (g) Western blotting indicating the efficiency of two shRNA (sh1 and sh2) to NHE1 was carried out in K562 cells. (h) K562 cells were transfected with indicated shNHE1 plasmid or treated with Cariporide and then exposed to Etoposide. The apoptosis was shown. (i, j) K562 cells were transfected with indicated shNHE1 plasmid or treated with Cariporide and then exposed to Imatinib. The apoptosis and viability curves were shown. Data was shown as mean ± s.e.m. of triplicate assays. P < 0.05. ∗∗P < 0.01. ∗∗∗P < 0.001. ∗∗∗∗P < 0.0001.
Figure 2
Figure 2
Etoposide altered NHE1 expression and pHi value among hematopoietic cell lines. (a) The mRNA expression level of NHE1 in HL-60, Jurkat, and K562 cells treated with Etoposide was detected. (b) The mRNA expression level of NHE1 in HL-60, Jurkat, and K562 cells treated with Irradiate was detected. (c, d) The protein expression level of NHE1 in HL-60 and Jurkat cells treated with Etoposide or in K562 cells treated with Imatinib was detected. Densitometric value was normalized by β-actin and showed the fold of treatment versus control. (e) The pHi in HL-60, Jurkat, and K562 cells treated with Etoposide was detected. (f) The pHi in HL-60, Jurkat, and K562 cells treated with Irradiate was detected. (g, h) The pHi in K562 cells with indicated treatments was detected. Data was shown as mean ± s.e.m. of triplicate assays. P < 0.05. ∗∗P < 0.01. ∗∗∗P < 0.001. ∗∗∗∗P < 0.0001.
Figure 3
Figure 3
Characterization of NHE1 promoter activity responded to Etoposide. (a) SLC9A1 promoter activity responded to serum deprivation. (b) Luciferase activity in K562 cells transfected with PGL3-1360 and incubated with Etoposide at different final concentrations was detected. (c) Response of PGL3-1360 and its progressive deletion regions in K562 cells to Etoposide was clarified by relative luciferase activity. (d) A schematic diagram of the proximal SLC9A1 promoter indicating 2 potential OCT1 transcription factor binding sites. (e) Biotinylated oligo pull-down assay was performed to show the binding between OCT1 and target sequence. Data was shown as mean ± s.e.m. of triplicate assays. P < 0.05. ∗∗P < 0.01. ∗∗∗P < 0.001. ∗∗∗∗P < 0.0001.
Figure 4
Figure 4
Identification of 3′ UTR of NHE1 mRNA as a possible target of miRNAs. (a) K562 cells transfected with pGL3-SLC9A1 showed lower relative luciferase activity than cells transfected with pGL3-control. This result was in according with what was found by introducing another luciferase report assay psiCHECK-2 vector constructed with the same sequence. (b) A schematic diagram of the putative seed regions in the 3′ UTR of NHE1. Highly conserved regions among vertebrates were shown in the diagram. By analyzing the sequence of 3′ UTR in silico, NHE1 was computationally predicted to be a target of multiple miRNAs, including hsa-miR-19. (c) The mutation of miR-19 binding site could increase activity of 3′ UTR, and the same trend was found by using miR-19 inhibitor. (d, e) Activity of SLC9A1 promoter and 3′ UTR responded to signaling inhibitors in K562 cells. (f) NHE1 expression at mRNA level was detected in K562 cells with indicated treatments. (g–i) NHE1 expression at protein level was detected in K562 cells with indicated treatments. (j) The pHi value in K562 cells with indicated treatments was detected. Data was shown as mean ± s.e.m. of triplicate assays. P < 0.05. ∗∗P < 0.01. ∗∗∗P < 0.001. ∗∗∗∗P < 0.0001.
Figure 5
Figure 5
miR-19 and c-MYC affected apoptosis of K562 cells treated with Etoposide both in vitro and in vivo. (a, b) Inhibition of miR-19 or c-MYC showed synergistic effect with Etoposide treatment on K562 cell apoptosis. (c, d) Inhibition of miR-19 or c-MYC further inhibited tumorigenicity potential of K562 cells treated with Etoposide in vivo. Representative photographs of tumors taken at the time of killing were shown. The tumor volume for each mouse was determined (in cubic millimeter) by measuring in two directions and calculated as tumor volume = length × (width)2/2. The tumor growth curve was accordingly shown. (e, f) TCGA data showed the negative correlation between miR-19 expression level and overall survival of leukemia patients. The patients' overall survival curve was accordingly shown. Data was shown as mean ± s.e.m. of triplicate assays. P < 0.05. ∗∗P < 0.01. ∗∗∗P < 0.001. ∗∗∗∗P < 0.0001.

Similar articles

References

    1. Zeller C., Hinzmann B., Seitz S., et al. SASH1: a candidate tumor suppressor gene on chromosome 6q24.3 is downregulated in breast cancer. Oncogene . 2003;22(19):2972–2983. - PubMed
    1. Zaboikin M., Srinivasakumar N., Schuening F. Gene therapy with drug resistance genes. Cancer Gene Therapy . 2006;13(4):335–345. doi: 10.1038/sj.cgt.7700912. - DOI - PubMed
    1. Fulda S. Exploiting inhibitor of apoptosis proteins as therapeutic targets in hematological malignancies. Leukemia . 2012;26(6):1155–1165. doi: 10.1038/leu.2012.4. - DOI - PubMed
    1. Gilbert L. A., Hemann M. T. DNA damage-mediated induction of a chemoresistant niche. Cell . 2010;143(3):355–366. doi: 10.1016/j.cell.2010.09.043. - DOI - PMC - PubMed
    1. Visvader J. E., Lindeman G. J. Cancer stem cells in solid tumours: accumulating evidence and unresolved questions. Nature Reviews. Cancer . 2008;8(10):755–768. doi: 10.1038/nrc2499. - DOI - PubMed

MeSH terms